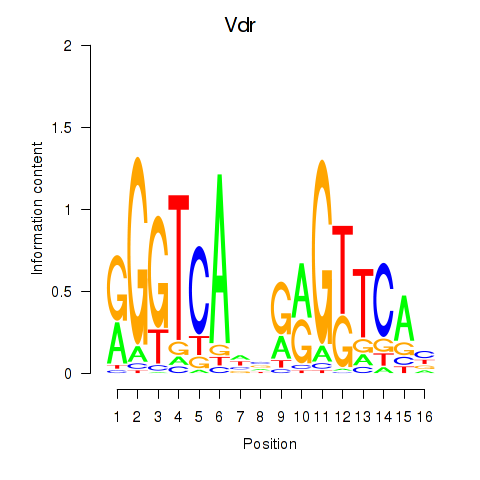
Motif ID: Vdr
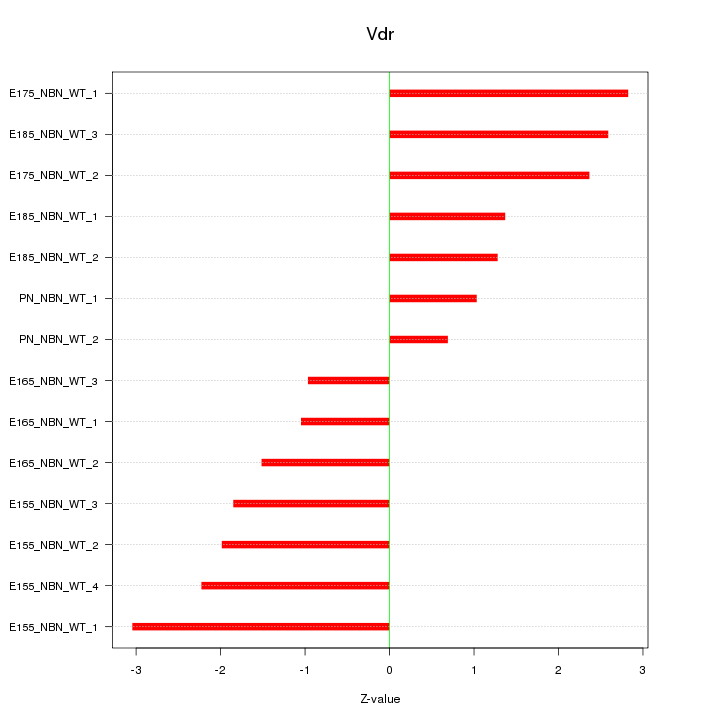
Z-value: 1.913
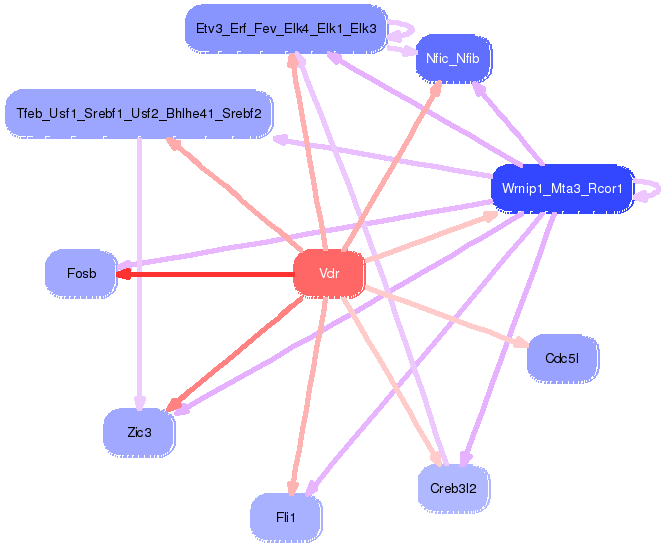
Transcription factors associated with Vdr:
| Gene Symbol | Entrez ID | Gene Name |
|---|---|---|
| Vdr | ENSMUSG00000022479.9 | Vdr |

Top targets:
Gene overrepresentation in biological_process category:
| Log-likelihood per target | Total log-likelihood | Term | Description |
|---|---|---|---|
| 1.5 | 4.5 | GO:0031117 | serotonin receptor signaling pathway(GO:0007210) positive regulation of microtubule depolymerization(GO:0031117) |
| 1.3 | 3.9 | GO:0042822 | vitamin B6 metabolic process(GO:0042816) pyridoxal phosphate metabolic process(GO:0042822) pyridoxal phosphate biosynthetic process(GO:0042823) |
| 1.3 | 6.4 | GO:0048143 | astrocyte activation(GO:0048143) |
| 1.3 | 6.3 | GO:0070305 | response to cGMP(GO:0070305) cellular response to cGMP(GO:0071321) |
| 1.0 | 10.5 | GO:0030322 | stabilization of membrane potential(GO:0030322) |
| 1.0 | 7.1 | GO:0060666 | dichotomous subdivision of terminal units involved in salivary gland branching(GO:0060666) |
| 0.9 | 3.6 | GO:0001920 | negative regulation of receptor recycling(GO:0001920) |
| 0.7 | 2.8 | GO:0035934 | corticosterone secretion(GO:0035934) |
| 0.5 | 1.6 | GO:0070269 | pyroptosis(GO:0070269) |
| 0.5 | 1.5 | GO:0030827 | negative regulation of cGMP metabolic process(GO:0030824) negative regulation of cGMP biosynthetic process(GO:0030827) negative regulation of guanylate cyclase activity(GO:0031283) |
| 0.4 | 1.8 | GO:0006867 | asparagine transport(GO:0006867) glutamine transport(GO:0006868) |
| 0.4 | 1.3 | GO:0090285 | negative regulation of protein glycosylation in Golgi(GO:0090285) |
| 0.4 | 1.7 | GO:0035990 | tendon cell differentiation(GO:0035990) tendon formation(GO:0035992) |
| 0.4 | 2.0 | GO:0007217 | tachykinin receptor signaling pathway(GO:0007217) |
| 0.4 | 1.1 | GO:0010845 | positive regulation of reciprocal meiotic recombination(GO:0010845) |
| 0.3 | 2.0 | GO:0035469 | determination of pancreatic left/right asymmetry(GO:0035469) |
| 0.3 | 0.7 | GO:0071907 | determination of digestive tract left/right asymmetry(GO:0071907) |
| 0.3 | 1.3 | GO:0031581 | hemidesmosome assembly(GO:0031581) |
| 0.3 | 5.3 | GO:0060134 | prepulse inhibition(GO:0060134) |
| 0.3 | 2.2 | GO:0019254 | carnitine metabolic process, CoA-linked(GO:0019254) |
| 0.3 | 0.9 | GO:0036388 | pre-replicative complex assembly involved in nuclear cell cycle DNA replication(GO:0006267) pre-replicative complex assembly(GO:0036388) pre-replicative complex assembly involved in cell cycle DNA replication(GO:1902299) |
| 0.3 | 1.7 | GO:1903352 | ornithine transport(GO:0015822) L-ornithine transmembrane transport(GO:1903352) |
| 0.3 | 0.8 | GO:0045204 | MAPK export from nucleus(GO:0045204) |
| 0.3 | 1.8 | GO:0015675 | nickel cation transport(GO:0015675) |
| 0.2 | 0.6 | GO:2000686 | regulation of rubidium ion transmembrane transporter activity(GO:2000686) |
| 0.2 | 2.8 | GO:0033623 | regulation of integrin activation(GO:0033623) |
| 0.2 | 1.1 | GO:0006123 | mitochondrial electron transport, cytochrome c to oxygen(GO:0006123) |
| 0.2 | 0.9 | GO:0032485 | regulation of Ral protein signal transduction(GO:0032485) |
| 0.2 | 1.5 | GO:0031424 | keratinization(GO:0031424) |
| 0.2 | 2.4 | GO:0035493 | SNARE complex assembly(GO:0035493) |
| 0.1 | 0.4 | GO:0060785 | regulation of apoptosis involved in tissue homeostasis(GO:0060785) |
| 0.1 | 0.7 | GO:0010668 | ectodermal cell differentiation(GO:0010668) |
| 0.1 | 1.0 | GO:1900029 | positive regulation of ruffle assembly(GO:1900029) |
| 0.1 | 0.4 | GO:1904956 | regulation of endodermal cell fate specification(GO:0042663) motor learning(GO:0061743) regulation of midbrain dopaminergic neuron differentiation(GO:1904956) |
| 0.1 | 0.6 | GO:2000774 | positive regulation of cellular senescence(GO:2000774) |
| 0.1 | 0.3 | GO:0097212 | lysosomal membrane organization(GO:0097212) |
| 0.1 | 1.4 | GO:0006268 | DNA unwinding involved in DNA replication(GO:0006268) |
| 0.1 | 3.6 | GO:0031146 | SCF-dependent proteasomal ubiquitin-dependent protein catabolic process(GO:0031146) |
| 0.1 | 0.9 | GO:0090050 | positive regulation of cell migration involved in sprouting angiogenesis(GO:0090050) negative regulation of NIK/NF-kappaB signaling(GO:1901223) |
| 0.1 | 0.6 | GO:0002591 | positive regulation of antigen processing and presentation of peptide antigen via MHC class I(GO:0002591) |
| 0.1 | 0.6 | GO:0071361 | cellular response to ethanol(GO:0071361) |
| 0.1 | 0.6 | GO:0045200 | establishment or maintenance of neuroblast polarity(GO:0045196) establishment of neuroblast polarity(GO:0045200) |
| 0.1 | 0.5 | GO:0016127 | cholesterol catabolic process(GO:0006707) sterol catabolic process(GO:0016127) |
| 0.1 | 0.5 | GO:0030263 | apoptotic chromosome condensation(GO:0030263) |
| 0.1 | 0.5 | GO:0032488 | Cdc42 protein signal transduction(GO:0032488) |
| 0.1 | 0.4 | GO:1900748 | positive regulation of vascular endothelial growth factor signaling pathway(GO:1900748) |
| 0.1 | 0.2 | GO:0046341 | CDP-diacylglycerol metabolic process(GO:0046341) |
| 0.1 | 3.6 | GO:0071277 | cellular response to calcium ion(GO:0071277) |
| 0.1 | 1.1 | GO:0033327 | Leydig cell differentiation(GO:0033327) |
| 0.1 | 0.5 | GO:0003062 | regulation of heart rate by chemical signal(GO:0003062) |
| 0.1 | 0.5 | GO:0070995 | NADPH oxidation(GO:0070995) |
| 0.1 | 0.3 | GO:0072321 | chaperone-mediated protein transport(GO:0072321) |
| 0.1 | 1.5 | GO:0032757 | positive regulation of interleukin-8 production(GO:0032757) |
| 0.1 | 0.1 | GO:0014877 | response to inactivity(GO:0014854) response to muscle inactivity(GO:0014870) response to muscle inactivity involved in regulation of muscle adaptation(GO:0014877) response to denervation involved in regulation of muscle adaptation(GO:0014894) |
| 0.1 | 2.1 | GO:0097009 | energy homeostasis(GO:0097009) |
| 0.0 | 0.5 | GO:1901621 | negative regulation of smoothened signaling pathway involved in dorsal/ventral neural tube patterning(GO:1901621) |
| 0.0 | 0.1 | GO:1901896 | Purkinje myocyte to ventricular cardiac muscle cell signaling(GO:0086029) Purkinje myocyte to ventricular cardiac muscle cell communication(GO:0086068) positive regulation of calcium-transporting ATPase activity(GO:1901896) |
| 0.0 | 0.4 | GO:0090244 | Wnt signaling pathway involved in somitogenesis(GO:0090244) |
| 0.0 | 0.3 | GO:0032790 | ribosome disassembly(GO:0032790) |
| 0.0 | 0.2 | GO:0042135 | neurotransmitter catabolic process(GO:0042135) |
| 0.0 | 0.5 | GO:0001711 | endodermal cell fate commitment(GO:0001711) |
| 0.0 | 0.5 | GO:0060055 | angiogenesis involved in wound healing(GO:0060055) |
| 0.0 | 0.2 | GO:0035752 | lysosomal lumen pH elevation(GO:0035752) |
| 0.0 | 3.0 | GO:0021766 | hippocampus development(GO:0021766) |
| 0.0 | 1.1 | GO:0060438 | trachea development(GO:0060438) |
| 0.0 | 0.1 | GO:0006533 | aspartate catabolic process(GO:0006533) D-amino acid catabolic process(GO:0019478) |
| 0.0 | 0.7 | GO:0035855 | megakaryocyte development(GO:0035855) |
| 0.0 | 0.2 | GO:0006390 | transcription from mitochondrial promoter(GO:0006390) |
| 0.0 | 0.5 | GO:0031167 | rRNA methylation(GO:0031167) |
| 0.0 | 0.4 | GO:0000291 | nuclear-transcribed mRNA catabolic process, exonucleolytic(GO:0000291) |
| 0.0 | 1.8 | GO:0010508 | positive regulation of autophagy(GO:0010508) |
| 0.0 | 1.9 | GO:0030168 | platelet activation(GO:0030168) |
| 0.0 | 0.2 | GO:0006104 | succinyl-CoA metabolic process(GO:0006104) |
| 0.0 | 0.4 | GO:0016558 | protein import into peroxisome matrix(GO:0016558) |
| 0.0 | 0.1 | GO:0015868 | purine nucleotide transport(GO:0015865) purine ribonucleotide transport(GO:0015868) |
| 0.0 | 0.6 | GO:0002474 | antigen processing and presentation of peptide antigen via MHC class I(GO:0002474) |
| 0.0 | 0.4 | GO:0006656 | phosphatidylcholine biosynthetic process(GO:0006656) |
| 0.0 | 0.3 | GO:0046513 | ceramide biosynthetic process(GO:0046513) |
| 0.0 | 2.0 | GO:0008033 | tRNA processing(GO:0008033) |
| 0.0 | 0.1 | GO:0001907 | killing by symbiont of host cells(GO:0001907) induction of programmed cell death(GO:0012502) disruption by symbiont of host cell(GO:0044004) positive regulation of apoptotic process in other organism(GO:0044533) negative regulation of cytolysis(GO:0045918) positive regulation by symbiont of host programmed cell death(GO:0052042) positive regulation by symbiont of host apoptotic process(GO:0052151) positive regulation by organism of programmed cell death in other organism involved in symbiotic interaction(GO:0052330) positive regulation by organism of apoptotic process in other organism involved in symbiotic interaction(GO:0052501) positive regulation of apoptotic process by virus(GO:0060139) |
| 0.0 | 0.1 | GO:0009249 | protein lipoylation(GO:0009249) |
| 0.0 | 0.3 | GO:0006515 | misfolded or incompletely synthesized protein catabolic process(GO:0006515) |
| 0.0 | 0.8 | GO:0042475 | odontogenesis of dentin-containing tooth(GO:0042475) |
| 0.0 | 0.3 | GO:0071260 | cellular response to mechanical stimulus(GO:0071260) |
| 0.0 | 0.3 | GO:0000413 | protein peptidyl-prolyl isomerization(GO:0000413) |
| 0.0 | 0.1 | GO:0030968 | endoplasmic reticulum unfolded protein response(GO:0030968) cellular response to unfolded protein(GO:0034620) cellular response to topologically incorrect protein(GO:0035967) |
| 0.0 | 0.8 | GO:0046888 | negative regulation of hormone secretion(GO:0046888) |
| 0.0 | 1.1 | GO:0010811 | positive regulation of cell-substrate adhesion(GO:0010811) |
| 0.0 | 0.1 | GO:0032482 | Rab protein signal transduction(GO:0032482) |
Gene overrepresentation in cellular_component category:
| Log-likelihood per target | Total log-likelihood | Term | Description |
|---|---|---|---|
| 1.6 | 4.9 | GO:0031983 | vesicle lumen(GO:0031983) |
| 0.5 | 2.4 | GO:0070820 | tertiary granule(GO:0070820) |
| 0.4 | 1.6 | GO:0061702 | inflammasome complex(GO:0061702) |
| 0.4 | 1.5 | GO:0001533 | cornified envelope(GO:0001533) |
| 0.3 | 4.5 | GO:0043203 | axon hillock(GO:0043203) |
| 0.3 | 1.5 | GO:0033093 | Weibel-Palade body(GO:0033093) |
| 0.3 | 0.9 | GO:0036387 | nuclear pre-replicative complex(GO:0005656) pre-replicative complex(GO:0036387) |
| 0.3 | 1.5 | GO:0044294 | dendritic growth cone(GO:0044294) |
| 0.2 | 7.7 | GO:0032590 | dendrite membrane(GO:0032590) |
| 0.2 | 1.4 | GO:0097197 | tetraspanin-enriched microdomain(GO:0097197) |
| 0.2 | 1.1 | GO:0033503 | HULC complex(GO:0033503) |
| 0.1 | 0.4 | GO:0045160 | myosin I complex(GO:0045160) |
| 0.1 | 0.4 | GO:1990415 | Pex17p-Pex14p docking complex(GO:1990415) peroxisomal importomer complex(GO:1990429) |
| 0.1 | 1.3 | GO:0030056 | hemidesmosome(GO:0030056) |
| 0.1 | 1.4 | GO:0005662 | DNA replication factor A complex(GO:0005662) |
| 0.1 | 0.3 | GO:0042719 | mitochondrial intermembrane space protein transporter complex(GO:0042719) |
| 0.1 | 0.6 | GO:0005751 | mitochondrial respiratory chain complex IV(GO:0005751) |
| 0.1 | 0.5 | GO:0016593 | Cdc73/Paf1 complex(GO:0016593) |
| 0.1 | 0.3 | GO:0017059 | serine C-palmitoyltransferase complex(GO:0017059) endoplasmic reticulum palmitoyltransferase complex(GO:0031211) |
| 0.1 | 10.2 | GO:0008021 | synaptic vesicle(GO:0008021) |
| 0.0 | 5.5 | GO:0031225 | anchored component of membrane(GO:0031225) |
| 0.0 | 0.5 | GO:0005952 | cAMP-dependent protein kinase complex(GO:0005952) |
| 0.0 | 0.6 | GO:0044447 | axoneme part(GO:0044447) |
| 0.0 | 0.8 | GO:0033017 | sarcoplasmic reticulum membrane(GO:0033017) |
| 0.0 | 0.2 | GO:0042582 | primary lysosome(GO:0005766) azurophil granule(GO:0042582) |
| 0.0 | 0.6 | GO:0005665 | DNA-directed RNA polymerase II, core complex(GO:0005665) |
| 0.0 | 0.1 | GO:0070044 | synaptobrevin 2-SNAP-25-syntaxin-1a complex(GO:0070044) |
| 0.0 | 0.4 | GO:0042612 | MHC class I protein complex(GO:0042612) |
| 0.0 | 1.8 | GO:0019005 | SCF ubiquitin ligase complex(GO:0019005) |
| 0.0 | 0.1 | GO:0005871 | kinesin complex(GO:0005871) |
| 0.0 | 2.0 | GO:0032587 | ruffle membrane(GO:0032587) |
| 0.0 | 1.3 | GO:0030173 | integral component of Golgi membrane(GO:0030173) |
| 0.0 | 0.4 | GO:0030877 | beta-catenin destruction complex(GO:0030877) |
| 0.0 | 0.2 | GO:0045252 | oxoglutarate dehydrogenase complex(GO:0045252) |
| 0.0 | 1.8 | GO:0001725 | stress fiber(GO:0001725) contractile actin filament bundle(GO:0097517) |
| 0.0 | 0.2 | GO:0008278 | cohesin complex(GO:0008278) |
| 0.0 | 0.4 | GO:0005782 | peroxisomal matrix(GO:0005782) microbody lumen(GO:0031907) |
| 0.0 | 3.6 | GO:0005802 | trans-Golgi network(GO:0005802) |
| 0.0 | 1.2 | GO:0022625 | cytosolic large ribosomal subunit(GO:0022625) |
| 0.0 | 1.1 | GO:0005581 | collagen trimer(GO:0005581) |
| 0.0 | 0.1 | GO:0005786 | signal recognition particle, endoplasmic reticulum targeting(GO:0005786) signal recognition particle(GO:0048500) |
| 0.0 | 0.3 | GO:0001772 | immunological synapse(GO:0001772) |
| 0.0 | 0.3 | GO:0000780 | condensed nuclear chromosome, centromeric region(GO:0000780) |
| 0.0 | 0.1 | GO:0000124 | SAGA complex(GO:0000124) |
| 0.0 | 0.1 | GO:0005922 | connexon complex(GO:0005922) |
Gene overrepresentation in molecular_function category:
| Log-likelihood per target | Total log-likelihood | Term | Description |
|---|---|---|---|
| 1.6 | 4.9 | GO:0005006 | epidermal growth factor-activated receptor activity(GO:0005006) |
| 1.3 | 3.9 | GO:0031403 | lithium ion binding(GO:0031403) |
| 1.3 | 6.3 | GO:0005222 | intracellular cAMP activated cation channel activity(GO:0005222) |
| 1.1 | 4.5 | GO:0004993 | G-protein coupled serotonin receptor activity(GO:0004993) serotonin binding(GO:0051378) serotonin receptor activity(GO:0099589) |
| 1.0 | 10.5 | GO:0022841 | potassium ion leak channel activity(GO:0022841) |
| 0.7 | 2.1 | GO:0031779 | melanocortin receptor binding(GO:0031779) type 3 melanocortin receptor binding(GO:0031781) type 4 melanocortin receptor binding(GO:0031782) |
| 0.6 | 7.1 | GO:0038191 | neuropilin binding(GO:0038191) |
| 0.4 | 3.6 | GO:0001025 | RNA polymerase III transcription factor binding(GO:0001025) |
| 0.4 | 1.3 | GO:0071633 | dihydroceramidase activity(GO:0071633) |
| 0.4 | 1.8 | GO:0004092 | carnitine O-acetyltransferase activity(GO:0004092) |
| 0.4 | 1.8 | GO:0015186 | L-asparagine transmembrane transporter activity(GO:0015182) L-glutamine transmembrane transporter activity(GO:0015186) |
| 0.3 | 2.7 | GO:0038036 | sphingosine-1-phosphate receptor activity(GO:0038036) |
| 0.3 | 1.4 | GO:0032422 | purine-rich negative regulatory element binding(GO:0032422) |
| 0.3 | 1.5 | GO:0005113 | patched binding(GO:0005113) |
| 0.3 | 1.8 | GO:0015099 | nickel cation transmembrane transporter activity(GO:0015099) |
| 0.3 | 1.5 | GO:0016936 | galactoside binding(GO:0016936) |
| 0.2 | 1.7 | GO:0015189 | L-ornithine transmembrane transporter activity(GO:0000064) arginine transmembrane transporter activity(GO:0015181) L-lysine transmembrane transporter activity(GO:0015189) |
| 0.2 | 0.6 | GO:0005220 | inositol 1,4,5-trisphosphate-sensitive calcium-release channel activity(GO:0005220) |
| 0.2 | 2.0 | GO:0004526 | ribonuclease P activity(GO:0004526) |
| 0.2 | 1.5 | GO:0019865 | immunoglobulin binding(GO:0019865) |
| 0.2 | 3.0 | GO:0005540 | hyaluronic acid binding(GO:0005540) |
| 0.1 | 0.4 | GO:0072541 | peroxynitrite reductase activity(GO:0072541) |
| 0.1 | 1.4 | GO:0042500 | aspartic endopeptidase activity, intramembrane cleaving(GO:0042500) |
| 0.1 | 1.4 | GO:0016920 | pyroglutamyl-peptidase activity(GO:0016920) |
| 0.1 | 2.2 | GO:0031005 | filamin binding(GO:0031005) |
| 0.1 | 5.6 | GO:0005504 | fatty acid binding(GO:0005504) |
| 0.1 | 0.4 | GO:0048019 | receptor antagonist activity(GO:0048019) |
| 0.1 | 0.6 | GO:0015440 | peptide-transporting ATPase activity(GO:0015440) |
| 0.1 | 0.2 | GO:0008525 | phosphatidylcholine transporter activity(GO:0008525) |
| 0.1 | 0.4 | GO:0004307 | ethanolaminephosphotransferase activity(GO:0004307) |
| 0.1 | 0.9 | GO:0003688 | DNA replication origin binding(GO:0003688) |
| 0.1 | 0.3 | GO:0004758 | serine C-palmitoyltransferase activity(GO:0004758) |
| 0.1 | 0.5 | GO:0004499 | N,N-dimethylaniline monooxygenase activity(GO:0004499) |
| 0.1 | 0.5 | GO:0004691 | cAMP-dependent protein kinase activity(GO:0004691) |
| 0.1 | 0.5 | GO:0003854 | 3-beta-hydroxy-delta5-steroid dehydrogenase activity(GO:0003854) |
| 0.1 | 1.3 | GO:0042608 | T cell receptor binding(GO:0042608) |
| 0.1 | 3.0 | GO:0050699 | WW domain binding(GO:0050699) |
| 0.1 | 0.5 | GO:0019784 | NEDD8-specific protease activity(GO:0019784) |
| 0.1 | 0.2 | GO:0004605 | phosphatidate cytidylyltransferase activity(GO:0004605) |
| 0.1 | 1.3 | GO:0008307 | structural constituent of muscle(GO:0008307) |
| 0.1 | 0.5 | GO:0050815 | phosphoserine binding(GO:0050815) |
| 0.1 | 2.4 | GO:0005484 | SNAP receptor activity(GO:0005484) |
| 0.1 | 0.4 | GO:0070991 | medium-chain-acyl-CoA dehydrogenase activity(GO:0070991) |
| 0.0 | 0.9 | GO:0031078 | histone deacetylase activity (H3-K14 specific)(GO:0031078) NAD-dependent histone deacetylase activity (H3-K14 specific)(GO:0032041) |
| 0.0 | 0.1 | GO:0005219 | ryanodine-sensitive calcium-release channel activity(GO:0005219) calcium-induced calcium release activity(GO:0048763) |
| 0.0 | 1.1 | GO:0043325 | phosphatidylinositol-3,4-bisphosphate binding(GO:0043325) |
| 0.0 | 1.5 | GO:0001540 | beta-amyloid binding(GO:0001540) |
| 0.0 | 0.2 | GO:0034602 | oxoglutarate dehydrogenase (NAD+) activity(GO:0034602) |
| 0.0 | 1.3 | GO:0015485 | cholesterol binding(GO:0015485) |
| 0.0 | 0.1 | GO:1990380 | Lys48-specific deubiquitinase activity(GO:1990380) |
| 0.0 | 0.3 | GO:0005068 | transmembrane receptor protein tyrosine kinase adaptor activity(GO:0005068) |
| 0.0 | 0.6 | GO:0016676 | cytochrome-c oxidase activity(GO:0004129) heme-copper terminal oxidase activity(GO:0015002) oxidoreductase activity, acting on a heme group of donors, oxygen as acceptor(GO:0016676) |
| 0.0 | 0.1 | GO:0003884 | D-amino-acid oxidase activity(GO:0003884) aspartate oxidase activity(GO:0015922) |
| 0.0 | 0.4 | GO:0030898 | actin-dependent ATPase activity(GO:0030898) |
| 0.0 | 0.2 | GO:0008429 | phosphatidylethanolamine binding(GO:0008429) |
| 0.0 | 0.2 | GO:0043495 | protein anchor(GO:0043495) |
| 0.0 | 1.1 | GO:0061631 | ubiquitin conjugating enzyme activity(GO:0061631) |
| 0.0 | 1.1 | GO:0005246 | calcium channel regulator activity(GO:0005246) |
| 0.0 | 0.4 | GO:0070016 | armadillo repeat domain binding(GO:0070016) |
| 0.0 | 0.1 | GO:0005047 | signal recognition particle binding(GO:0005047) endoplasmic reticulum signal peptide binding(GO:0030942) |
| 0.0 | 1.5 | GO:0005200 | structural constituent of cytoskeleton(GO:0005200) |
| 0.0 | 0.2 | GO:0001055 | RNA polymerase II activity(GO:0001055) |
| 0.0 | 1.9 | GO:0005178 | integrin binding(GO:0005178) |
| 0.0 | 0.8 | GO:0004864 | protein phosphatase inhibitor activity(GO:0004864) |
| 0.0 | 5.5 | GO:0001077 | transcriptional activator activity, RNA polymerase II core promoter proximal region sequence-specific binding(GO:0001077) |
| 0.0 | 0.6 | GO:0017080 | sodium channel regulator activity(GO:0017080) |
| 0.0 | 0.1 | GO:0005483 | soluble NSF attachment protein activity(GO:0005483) |
| 0.0 | 0.5 | GO:0008138 | protein tyrosine/serine/threonine phosphatase activity(GO:0008138) |
| 0.0 | 0.5 | GO:0052771 | coenzyme F390-A hydrolase activity(GO:0052770) coenzyme F390-G hydrolase activity(GO:0052771) |
| 0.0 | 0.1 | GO:0005243 | gap junction channel activity(GO:0005243) |
| 0.0 | 0.6 | GO:0035496 | UDP-glucose:glycoprotein glucosyltransferase activity(GO:0003980) O antigen polymerase activity(GO:0008755) lipopolysaccharide-1,6-galactosyltransferase activity(GO:0008921) cellulose synthase activity(GO:0016759) 9-phenanthrol UDP-glucuronosyltransferase activity(GO:0018715) 1-phenanthrol glycosyltransferase activity(GO:0018716) 9-phenanthrol glycosyltransferase activity(GO:0018717) 1,2-dihydroxy-phenanthrene glycosyltransferase activity(GO:0018718) phenanthrol glycosyltransferase activity(GO:0019112) alpha-1,2-galactosyltransferase activity(GO:0031278) dolichyl pyrophosphate Man7GlcNAc2 alpha-1,3-glucosyltransferase activity(GO:0033556) endogalactosaminidase activity(GO:0033931) lipopolysaccharide-1,5-galactosyltransferase activity(GO:0035496) dolichyl pyrophosphate Glc1Man9GlcNAc2 alpha-1,3-glucosyltransferase activity(GO:0042283) inositol phosphoceramide synthase activity(GO:0045140) alpha-(1->3)-fucosyltransferase activity(GO:0046920) indole-3-butyrate beta-glucosyltransferase activity(GO:0052638) salicylic acid glucosyltransferase (ester-forming) activity(GO:0052639) salicylic acid glucosyltransferase (glucoside-forming) activity(GO:0052640) benzoic acid glucosyltransferase activity(GO:0052641) chondroitin hydrolase activity(GO:0052757) dolichyl-pyrophosphate Man7GlcNAc2 alpha-1,6-mannosyltransferase activity(GO:0052824) cytokinin 9-beta-glucosyltransferase activity(GO:0080062) |