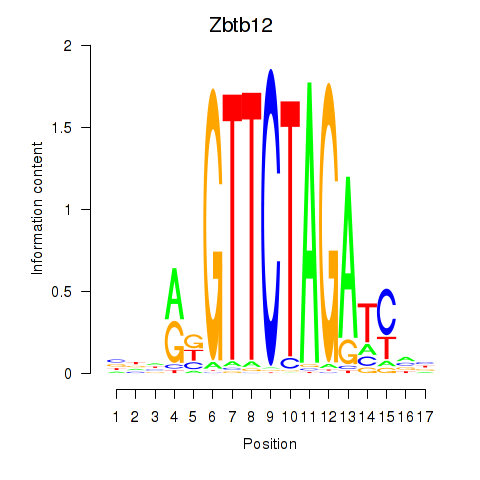
Motif ID: Zbtb12
Z-value: 0.351
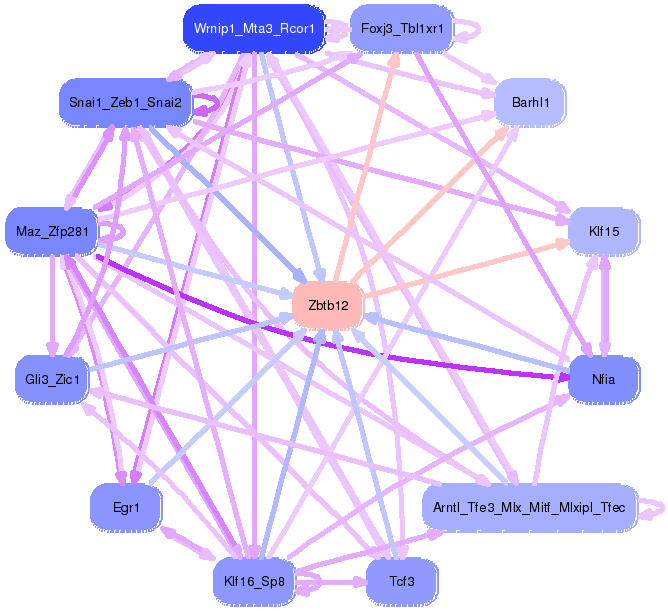
Transcription factors associated with Zbtb12:
| Gene Symbol | Entrez ID | Gene Name |
|---|---|---|
| Zbtb12 | ENSMUSG00000049823.8 | Zbtb12 |
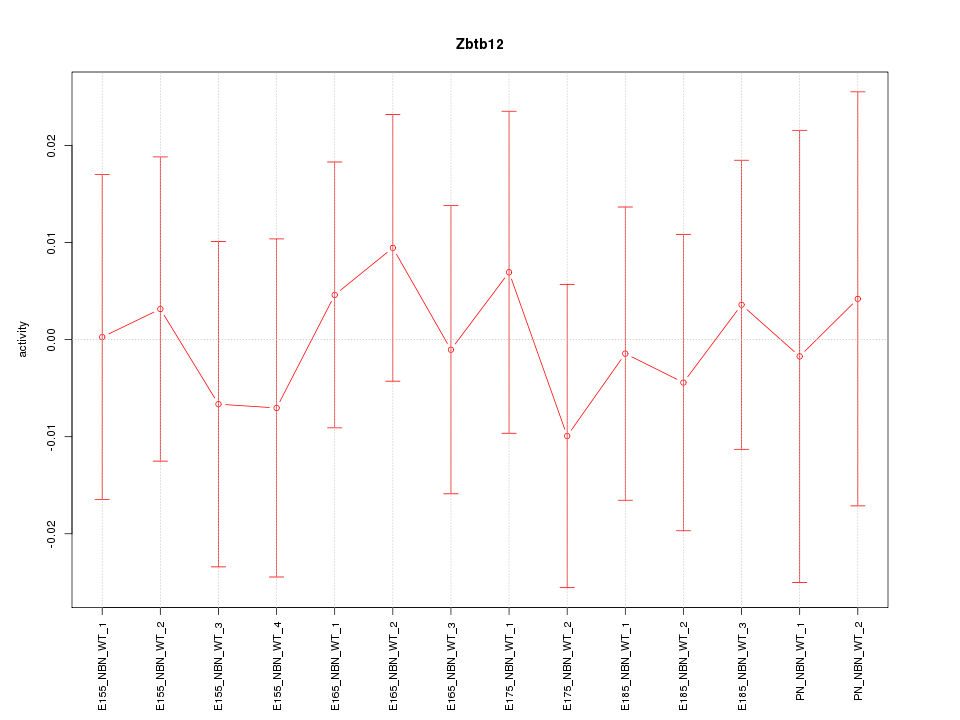
Activity-expression correlation:
| Gene Symbol | Promoter | Pearson corr. coef. | P-value | Plot |
|---|---|---|---|---|
| Zbtb12 | mm10_v2_chr17_+_34894515_34894573 | 0.33 | 2.5e-01 | Click! |


Top targets:
Gene overrepresentation in biological_process category:
| Log-likelihood per target | Total log-likelihood | Term | Description |
|---|---|---|---|
| 0.0 | 0.1 | GO:1900275 | negative regulation of phospholipase C activity(GO:1900275) |
| 0.0 | 0.1 | GO:2001187 | positive regulation of CD8-positive, alpha-beta T cell activation(GO:2001187) |
| 0.0 | 0.1 | GO:0014826 | vein smooth muscle contraction(GO:0014826) |
| 0.0 | 0.2 | GO:0006686 | sphingomyelin biosynthetic process(GO:0006686) |
| 0.0 | 0.1 | GO:0010248 | B cell negative selection(GO:0002352) establishment or maintenance of transmembrane electrochemical gradient(GO:0010248) |
| 0.0 | 0.1 | GO:1900194 | negative regulation of oocyte maturation(GO:1900194) |
| 0.0 | 0.1 | GO:0033601 | positive regulation of mammary gland epithelial cell proliferation(GO:0033601) |
| 0.0 | 0.0 | GO:0009174 | UMP biosynthetic process(GO:0006222) pyrimidine ribonucleoside monophosphate metabolic process(GO:0009173) pyrimidine ribonucleoside monophosphate biosynthetic process(GO:0009174) UMP metabolic process(GO:0046049) |
| 0.0 | 0.0 | GO:0046341 | CDP-diacylglycerol metabolic process(GO:0046341) |
Gene overrepresentation in cellular_component category:
| Log-likelihood per target | Total log-likelihood | Term | Description |
|---|---|---|---|
| 0.1 | 0.3 | GO:0031230 | intrinsic component of cell outer membrane(GO:0031230) integral component of cell outer membrane(GO:0045203) |
| 0.0 | 0.1 | GO:1990131 | EGO complex(GO:0034448) Gtr1-Gtr2 GTPase complex(GO:1990131) |
Gene overrepresentation in molecular_function category:
| Log-likelihood per target | Total log-likelihood | Term | Description |
|---|---|---|---|
| 0.0 | 0.2 | GO:0033188 | sphingomyelin synthase activity(GO:0033188) ceramide cholinephosphotransferase activity(GO:0047493) |
| 0.0 | 0.1 | GO:0004962 | endothelin receptor activity(GO:0004962) |
| 0.0 | 0.1 | GO:0032027 | myosin light chain binding(GO:0032027) |
| 0.0 | 0.1 | GO:2001069 | glycogen binding(GO:2001069) |
| 0.0 | 0.1 | GO:0015125 | bile acid transmembrane transporter activity(GO:0015125) |
| 0.0 | 0.2 | GO:0008430 | selenium binding(GO:0008430) |
| 0.0 | 0.1 | GO:0070097 | delta-catenin binding(GO:0070097) |