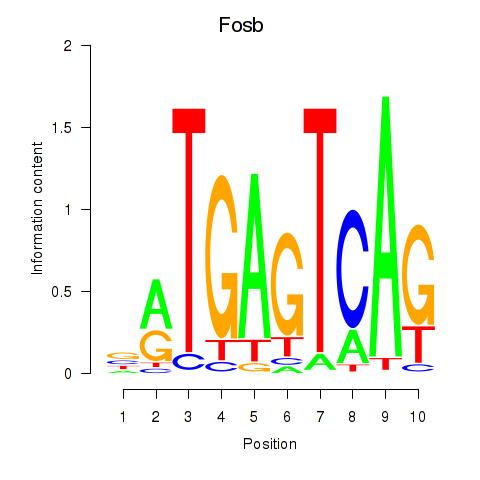
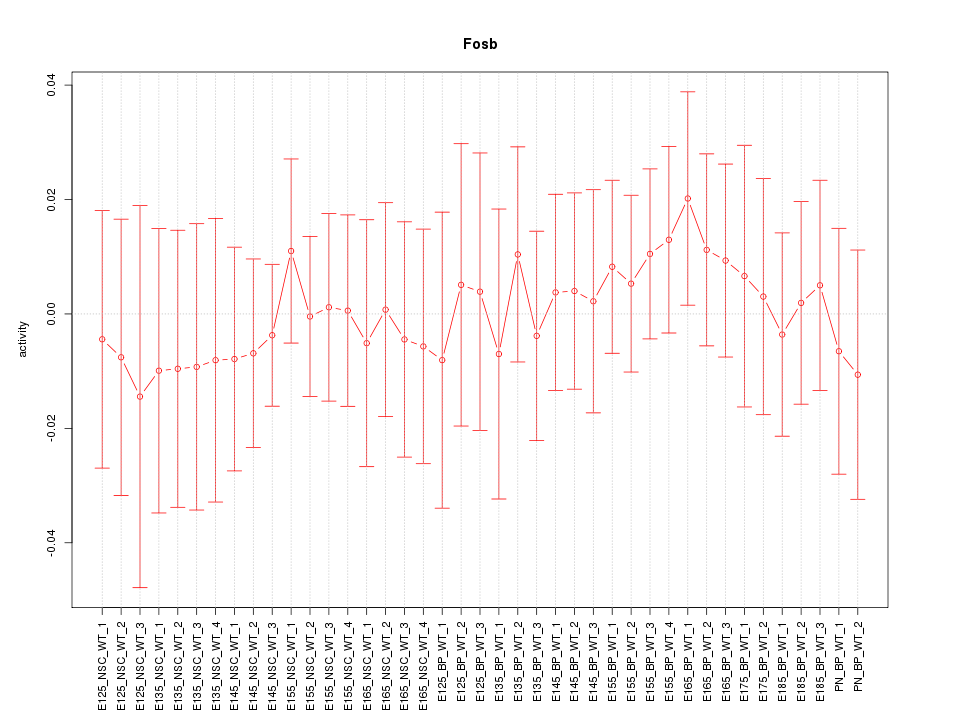
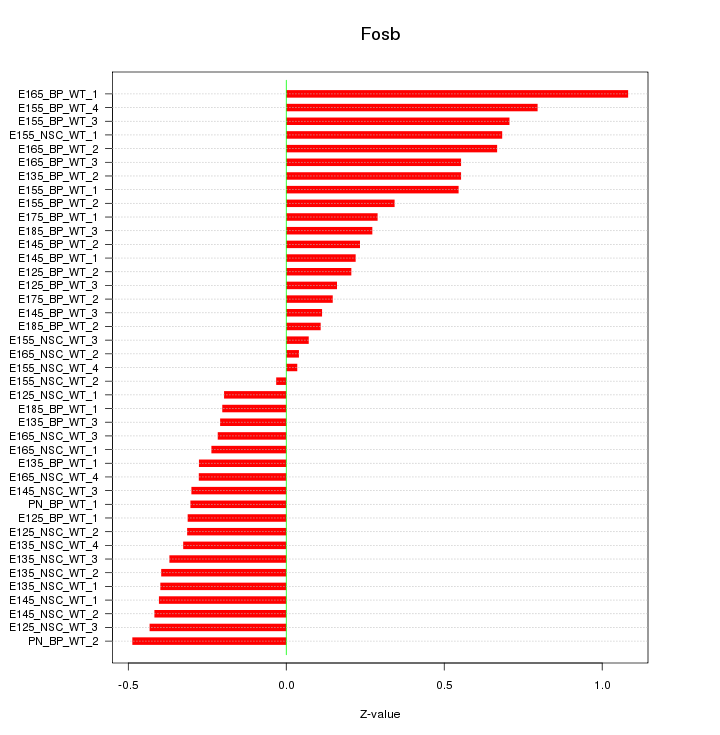
Motif ID: Fosb
Z-value: 0.404
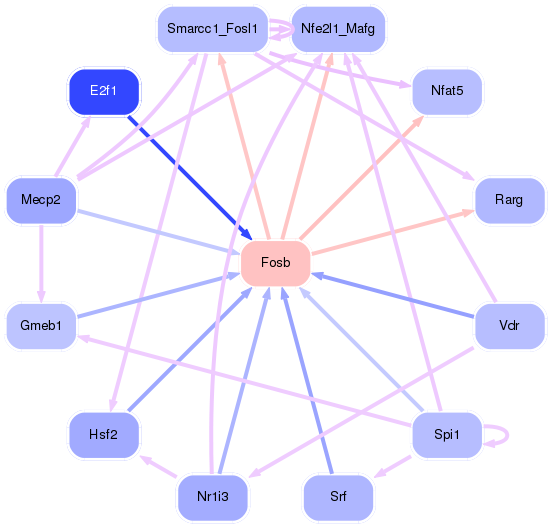
Transcription factors associated with Fosb:
| Gene Symbol | Entrez ID | Gene Name |
|---|---|---|
| Fosb | ENSMUSG00000003545.2 | Fosb |
Activity-expression correlation:
| Gene Symbol | Promoter | Pearson corr. coef. | P-value | Plot |
|---|---|---|---|---|
| Fosb | mm10_v2_chr7_-_19310035_19310050 | -0.50 | 9.5e-04 | Click! |

Top targets:
Gene overrepresentation in biological_process category:
| Log-likelihood per target | Total log-likelihood | Term | Description |
|---|---|---|---|
| 0.2 | 1.0 | GO:0035937 | estrogen secretion(GO:0035937) estradiol secretion(GO:0035938) regulation of estrogen secretion(GO:2000861) regulation of estradiol secretion(GO:2000864) |
| 0.2 | 1.0 | GO:0003430 | growth plate cartilage chondrocyte growth(GO:0003430) |
| 0.2 | 1.6 | GO:0070494 | regulation of thrombin receptor signaling pathway(GO:0070494) negative regulation of thrombin receptor signaling pathway(GO:0070495) |
| 0.2 | 0.6 | GO:0002159 | desmosome assembly(GO:0002159) |
| 0.2 | 1.0 | GO:0048840 | otolith development(GO:0048840) |
| 0.1 | 0.7 | GO:1903056 | positive regulation of lens fiber cell differentiation(GO:1902748) regulation of melanosome organization(GO:1903056) |
| 0.1 | 0.8 | GO:1903847 | regulation of aorta morphogenesis(GO:1903847) positive regulation of aorta morphogenesis(GO:1903849) |
| 0.1 | 0.9 | GO:0090343 | positive regulation of cell aging(GO:0090343) |
| 0.1 | 0.5 | GO:0007296 | vitellogenesis(GO:0007296) |
| 0.1 | 0.3 | GO:0090472 | dibasic protein processing(GO:0090472) |
| 0.1 | 0.9 | GO:0090110 | cargo loading into COPII-coated vesicle(GO:0090110) |
| 0.1 | 0.9 | GO:1902004 | positive regulation of beta-amyloid formation(GO:1902004) |
| 0.1 | 0.4 | GO:0034773 | histone H4-K20 trimethylation(GO:0034773) establishment of Sertoli cell barrier(GO:0097368) |
| 0.1 | 0.2 | GO:0038128 | ERBB2 signaling pathway(GO:0038128) |
| 0.0 | 1.1 | GO:0070884 | regulation of calcineurin-NFAT signaling cascade(GO:0070884) |
| 0.0 | 0.2 | GO:0032489 | regulation of Cdc42 protein signal transduction(GO:0032489) |
| 0.0 | 0.4 | GO:0061635 | regulation of protein complex stability(GO:0061635) |
| 0.0 | 1.8 | GO:1900026 | positive regulation of substrate adhesion-dependent cell spreading(GO:1900026) |
| 0.0 | 0.2 | GO:2001204 | regulation of osteoclast development(GO:2001204) |
| 0.0 | 1.0 | GO:2000369 | regulation of clathrin-mediated endocytosis(GO:2000369) |
| 0.0 | 0.4 | GO:0043252 | sodium-independent organic anion transport(GO:0043252) |
| 0.0 | 0.3 | GO:0061302 | smooth muscle cell-matrix adhesion(GO:0061302) |
| 0.0 | 0.2 | GO:0006686 | sphingomyelin biosynthetic process(GO:0006686) |
| 0.0 | 0.2 | GO:0015862 | uridine transport(GO:0015862) |
| 0.0 | 0.8 | GO:0021952 | central nervous system projection neuron axonogenesis(GO:0021952) |
| 0.0 | 0.5 | GO:0033198 | response to ATP(GO:0033198) |
| 0.0 | 0.1 | GO:0030043 | actin filament fragmentation(GO:0030043) |
| 0.0 | 0.7 | GO:0035335 | peptidyl-tyrosine dephosphorylation(GO:0035335) |
| 0.0 | 0.4 | GO:0072337 | modified amino acid transport(GO:0072337) |
| 0.0 | 0.1 | GO:0042760 | very long-chain fatty acid catabolic process(GO:0042760) |
| 0.0 | 0.1 | GO:1900122 | positive regulation of receptor binding(GO:1900122) |
| 0.0 | 0.0 | GO:1903028 | regulation of opsonization(GO:1903027) positive regulation of opsonization(GO:1903028) |
| 0.0 | 0.6 | GO:0072583 | clathrin-mediated endocytosis(GO:0072583) |
| 0.0 | 0.5 | GO:0060325 | face morphogenesis(GO:0060325) |
Gene overrepresentation in cellular_component category:
| Log-likelihood per target | Total log-likelihood | Term | Description |
|---|---|---|---|
| 0.1 | 0.4 | GO:0044753 | amphisome(GO:0044753) |
| 0.1 | 1.8 | GO:0042581 | specific granule(GO:0042581) |
| 0.1 | 1.0 | GO:0071439 | clathrin complex(GO:0071439) |
| 0.1 | 0.6 | GO:0030130 | clathrin coat of trans-Golgi network vesicle(GO:0030130) |
| 0.1 | 0.9 | GO:0030127 | COPII vesicle coat(GO:0030127) |
| 0.1 | 0.4 | GO:0061689 | tricellular tight junction(GO:0061689) |
| 0.1 | 0.6 | GO:0071664 | catenin-TCF7L2 complex(GO:0071664) |
| 0.1 | 0.4 | GO:0005638 | lamin filament(GO:0005638) |
| 0.1 | 0.3 | GO:0012510 | trans-Golgi network transport vesicle membrane(GO:0012510) |
| 0.1 | 0.2 | GO:0097447 | dendritic tree(GO:0097447) |
| 0.0 | 1.0 | GO:0098839 | postsynaptic density membrane(GO:0098839) postsynaptic specialization membrane(GO:0099634) |
| 0.0 | 0.5 | GO:0031229 | integral component of nuclear inner membrane(GO:0005639) intrinsic component of nuclear inner membrane(GO:0031229) |
| 0.0 | 0.9 | GO:0046658 | anchored component of plasma membrane(GO:0046658) |
| 0.0 | 2.2 | GO:0042734 | presynaptic membrane(GO:0042734) |
| 0.0 | 0.2 | GO:0000015 | phosphopyruvate hydratase complex(GO:0000015) |
| 0.0 | 0.3 | GO:0045095 | keratin filament(GO:0045095) |
| 0.0 | 1.6 | GO:0009925 | basal plasma membrane(GO:0009925) |
| 0.0 | 0.2 | GO:0000138 | Golgi trans cisterna(GO:0000138) |
Gene overrepresentation in molecular_function category:
| Log-likelihood per target | Total log-likelihood | Term | Description |
|---|---|---|---|
| 0.4 | 1.6 | GO:0005008 | hepatocyte growth factor-activated receptor activity(GO:0005008) |
| 0.2 | 1.0 | GO:0034647 | histone demethylase activity (H3-trimethyl-K4 specific)(GO:0034647) |
| 0.1 | 0.4 | GO:0015220 | choline transmembrane transporter activity(GO:0015220) |
| 0.1 | 0.5 | GO:0035381 | extracellular ATP-gated cation channel activity(GO:0004931) ATP-gated ion channel activity(GO:0035381) |
| 0.1 | 0.3 | GO:0008853 | exodeoxyribonuclease III activity(GO:0008853) |
| 0.1 | 0.3 | GO:1990254 | keratin filament binding(GO:1990254) |
| 0.1 | 1.0 | GO:0035612 | AP-2 adaptor complex binding(GO:0035612) |
| 0.1 | 1.0 | GO:0005388 | calcium-transporting ATPase activity(GO:0005388) |
| 0.1 | 0.6 | GO:0032050 | clathrin heavy chain binding(GO:0032050) |
| 0.0 | 1.0 | GO:0003708 | retinoic acid receptor activity(GO:0003708) |
| 0.0 | 0.6 | GO:0045294 | alpha-catenin binding(GO:0045294) |
| 0.0 | 0.7 | GO:0017017 | MAP kinase tyrosine/serine/threonine phosphatase activity(GO:0017017) |
| 0.0 | 0.1 | GO:0017099 | very-long-chain-acyl-CoA dehydrogenase activity(GO:0017099) |
| 0.0 | 0.2 | GO:0033188 | sphingomyelin synthase activity(GO:0033188) ceramide cholinephosphotransferase activity(GO:0047493) |
| 0.0 | 0.3 | GO:0038062 | protein tyrosine kinase collagen receptor activity(GO:0038062) |
| 0.0 | 0.4 | GO:0015347 | sodium-independent organic anion transmembrane transporter activity(GO:0015347) |
| 0.0 | 0.2 | GO:0004634 | phosphopyruvate hydratase activity(GO:0004634) |
| 0.0 | 0.3 | GO:0048406 | nerve growth factor binding(GO:0048406) |
| 0.0 | 0.3 | GO:0005225 | volume-sensitive anion channel activity(GO:0005225) |
| 0.0 | 0.7 | GO:0070412 | R-SMAD binding(GO:0070412) |
| 0.0 | 0.3 | GO:0005540 | hyaluronic acid binding(GO:0005540) |
| 0.0 | 0.4 | GO:0070530 | K63-linked polyubiquitin binding(GO:0070530) |
| 0.0 | 0.8 | GO:0046875 | ephrin receptor binding(GO:0046875) |
| 0.0 | 0.4 | GO:0008157 | protein phosphatase 1 binding(GO:0008157) |
| 0.0 | 0.7 | GO:0005547 | phosphatidylinositol-3,4,5-trisphosphate binding(GO:0005547) |
| 0.0 | 0.3 | GO:0031489 | myosin V binding(GO:0031489) |
| 0.0 | 0.8 | GO:0048365 | Rac GTPase binding(GO:0048365) |
| 0.0 | 0.2 | GO:0030215 | semaphorin receptor binding(GO:0030215) |
Gene overrepresentation in C2:CP category:
| Log-likelihood per target | Total log-likelihood | Term | Description |
|---|---|---|---|
| 0.1 | 2.2 | PID_ARF6_PATHWAY | Arf6 signaling events |
| 0.0 | 1.1 | ST_WNT_CA2_CYCLIC_GMP_PATHWAY | Wnt/Ca2+/cyclic GMP signaling. |
| 0.0 | 0.9 | NABA_BASEMENT_MEMBRANES | Genes encoding structural components of basement membranes |
| 0.0 | 1.0 | PID_RXR_VDR_PATHWAY | RXR and RAR heterodimerization with other nuclear receptor |
| 0.0 | 0.8 | PID_EPHRINB_REV_PATHWAY | Ephrin B reverse signaling |
| 0.0 | 0.6 | PID_ARF_3PATHWAY | Arf1 pathway |
| 0.0 | 0.8 | SIG_REGULATION_OF_THE_ACTIN_CYTOSKELETON_BY_RHO_GTPASES | Genes related to regulation of the actin cytoskeleton |
| 0.0 | 0.6 | PID_NCADHERIN_PATHWAY | N-cadherin signaling events |
| 0.0 | 0.6 | PID_FRA_PATHWAY | Validated transcriptional targets of AP1 family members Fra1 and Fra2 |
| 0.0 | 0.8 | PID_AP1_PATHWAY | AP-1 transcription factor network |
| 0.0 | 0.4 | PID_IL1_PATHWAY | IL1-mediated signaling events |
Gene overrepresentation in C2:CP:REACTOME category:
| Log-likelihood per target | Total log-likelihood | Term | Description |
|---|---|---|---|
| 0.1 | 1.0 | REACTOME_PLATELET_CALCIUM_HOMEOSTASIS | Genes involved in Platelet calcium homeostasis |
| 0.1 | 0.8 | REACTOME_ACTIVATION_OF_RAC | Genes involved in Activation of Rac |
| 0.0 | 0.9 | REACTOME_ANTIGEN_PRESENTATION_FOLDING_ASSEMBLY_AND_PEPTIDE_LOADING_OF_CLASS_I_MHC | Genes involved in Antigen Presentation: Folding, assembly and peptide loading of class I MHC |
| 0.0 | 1.6 | REACTOME_SEMA4D_IN_SEMAPHORIN_SIGNALING | Genes involved in Sema4D in semaphorin signaling |
| 0.0 | 0.6 | REACTOME_GAP_JUNCTION_DEGRADATION | Genes involved in Gap junction degradation |
| 0.0 | 0.4 | REACTOME_NFKB_IS_ACTIVATED_AND_SIGNALS_SURVIVAL | Genes involved in NF-kB is activated and signals survival |
| 0.0 | 0.3 | REACTOME_GAMMA_CARBOXYLATION_TRANSPORT_AND_AMINO_TERMINAL_CLEAVAGE_OF_PROTEINS | Genes involved in Gamma-carboxylation, transport, and amino-terminal cleavage of proteins |
| 0.0 | 0.3 | REACTOME_HOMOLOGOUS_RECOMBINATION_REPAIR_OF_REPLICATION_INDEPENDENT_DOUBLE_STRAND_BREAKS | Genes involved in Homologous recombination repair of replication-independent double-strand breaks |
| 0.0 | 0.6 | REACTOME_ADHERENS_JUNCTIONS_INTERACTIONS | Genes involved in Adherens junctions interactions |
| 0.0 | 0.2 | REACTOME_SIGNAL_REGULATORY_PROTEIN_SIRP_FAMILY_INTERACTIONS | Genes involved in Signal regulatory protein (SIRP) family interactions |
| 0.0 | 1.0 | REACTOME_NUCLEAR_RECEPTOR_TRANSCRIPTION_PATHWAY | Genes involved in Nuclear Receptor transcription pathway |
| 0.0 | 0.6 | REACTOME_ACTIVATION_OF_CHAPERONE_GENES_BY_XBP1S | Genes involved in Activation of Chaperone Genes by XBP1(S) |
| 0.0 | 0.2 | REACTOME_SIGNALLING_TO_P38_VIA_RIT_AND_RIN | Genes involved in Signalling to p38 via RIT and RIN |