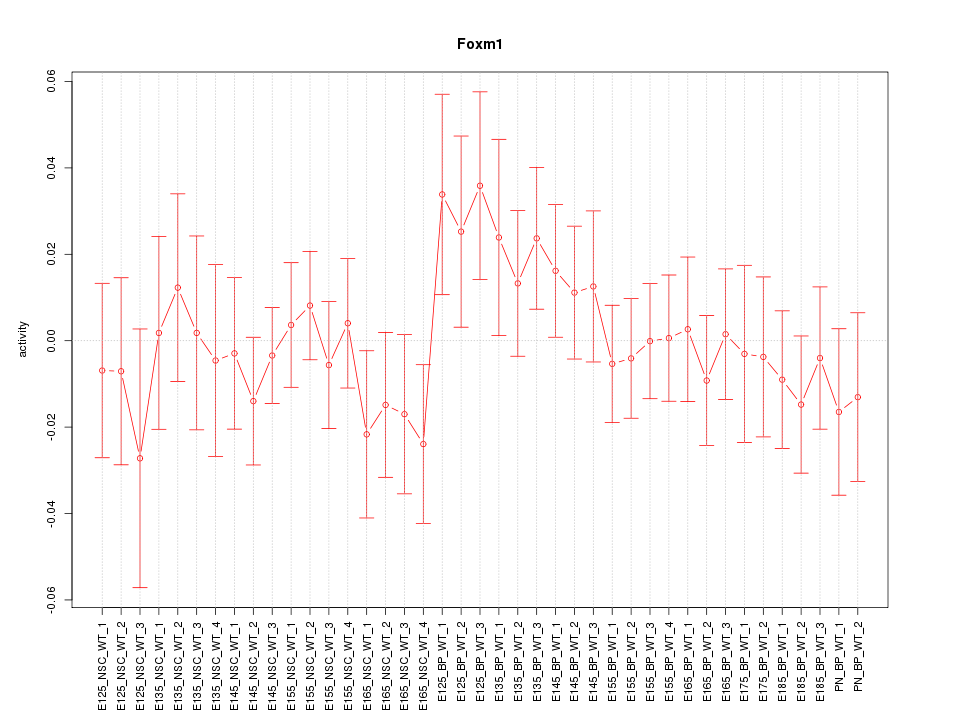
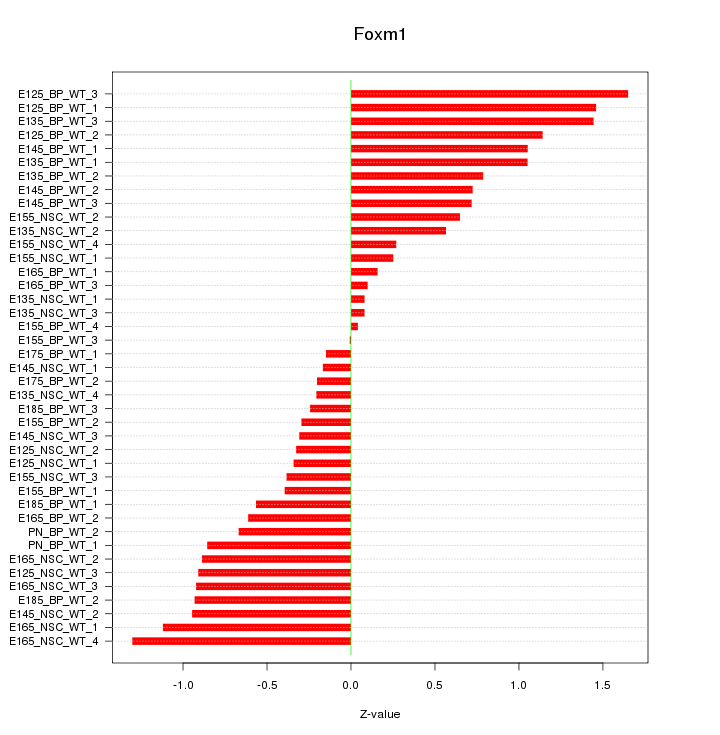
Motif ID: Foxm1
Z-value: 0.749

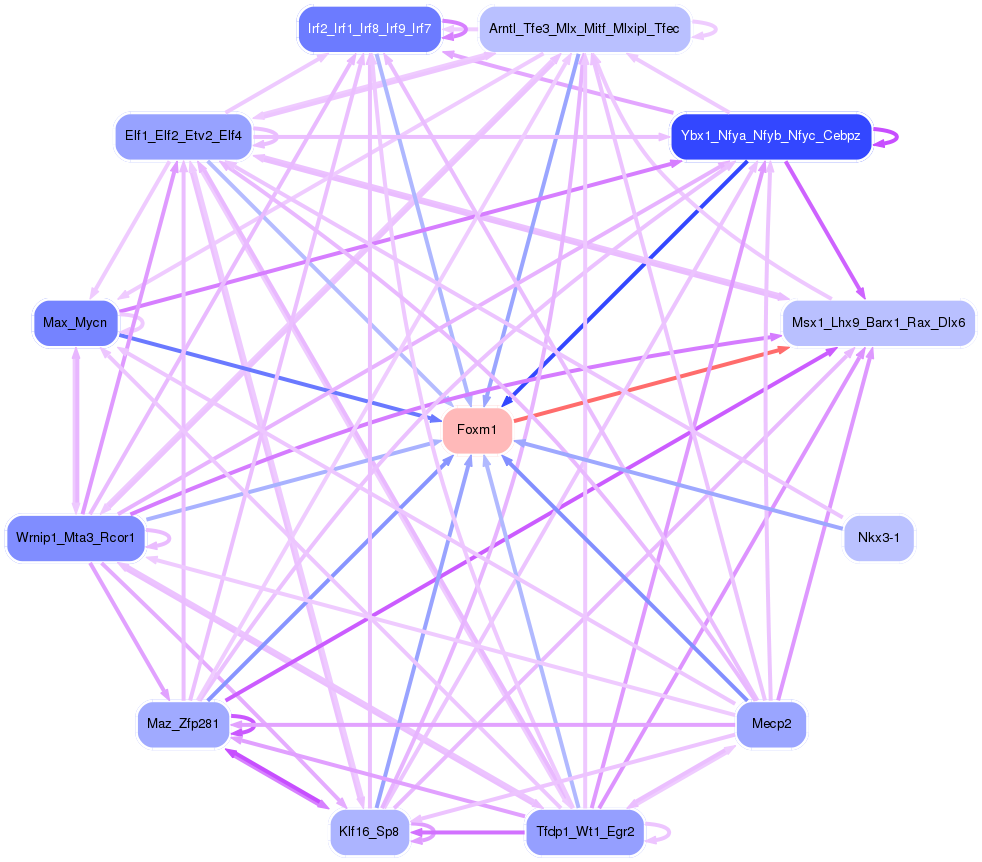
Transcription factors associated with Foxm1:
| Gene Symbol | Entrez ID | Gene Name |
|---|---|---|
| Foxm1 | ENSMUSG00000001517.8 | Foxm1 |
Activity-expression correlation:
| Gene Symbol | Promoter | Pearson corr. coef. | P-value | Plot |
|---|---|---|---|---|
| Foxm1 | mm10_v2_chr6_+_128362919_128363058 | 0.09 | 5.7e-01 | Click! |

Top targets:
Gene overrepresentation in biological_process category:
| Log-likelihood per target | Total log-likelihood | Term | Description |
|---|---|---|---|
| 1.0 | 5.0 | GO:0035262 | gonad morphogenesis(GO:0035262) |
| 0.7 | 3.4 | GO:0048245 | eosinophil chemotaxis(GO:0048245) |
| 0.4 | 1.6 | GO:0061055 | myotome development(GO:0061055) |
| 0.4 | 1.8 | GO:0060467 | negative regulation of fertilization(GO:0060467) |
| 0.3 | 0.9 | GO:0002423 | natural killer cell mediated cytotoxicity directed against tumor cell target(GO:0002420) natural killer cell mediated immune response to tumor cell(GO:0002423) regulation of natural killer cell mediated immune response to tumor cell(GO:0002855) regulation of natural killer cell mediated cytotoxicity directed against tumor cell target(GO:0002858) susceptibility to natural killer cell mediated cytotoxicity(GO:0042271) |
| 0.3 | 2.1 | GO:0070474 | positive regulation of uterine smooth muscle contraction(GO:0070474) |
| 0.2 | 0.7 | GO:0071707 | immunoglobulin heavy chain V-D-J recombination(GO:0071707) |
| 0.2 | 3.5 | GO:0035970 | peptidyl-threonine dephosphorylation(GO:0035970) |
| 0.2 | 0.6 | GO:0045763 | negative regulation of cellular amino acid metabolic process(GO:0045763) |
| 0.2 | 2.6 | GO:0035881 | amacrine cell differentiation(GO:0035881) |
| 0.2 | 1.8 | GO:0071420 | cellular response to histamine(GO:0071420) |
| 0.2 | 1.1 | GO:0090272 | negative regulation of fibroblast growth factor production(GO:0090272) |
| 0.2 | 0.7 | GO:0046898 | response to cycloheximide(GO:0046898) |
| 0.2 | 1.0 | GO:0000733 | DNA strand renaturation(GO:0000733) |
| 0.1 | 0.9 | GO:0007258 | JUN phosphorylation(GO:0007258) |
| 0.1 | 0.4 | GO:1902396 | protein localization to bicellular tight junction(GO:1902396) |
| 0.1 | 0.8 | GO:0051694 | pointed-end actin filament capping(GO:0051694) |
| 0.1 | 0.5 | GO:0002188 | translation reinitiation(GO:0002188) |
| 0.1 | 0.6 | GO:1903756 | regulation of transcription from RNA polymerase II promoter by histone modification(GO:1903756) negative regulation of transcription from RNA polymerase II promoter by histone modification(GO:1903758) |
| 0.1 | 0.6 | GO:0007603 | phototransduction, visible light(GO:0007603) |
| 0.1 | 1.4 | GO:0019886 | antigen processing and presentation of exogenous peptide antigen via MHC class II(GO:0019886) |
| 0.1 | 0.6 | GO:0052695 | cellular glucuronidation(GO:0052695) |
| 0.1 | 1.1 | GO:0048386 | positive regulation of retinoic acid receptor signaling pathway(GO:0048386) |
| 0.1 | 1.1 | GO:0006824 | cobalt ion transport(GO:0006824) |
| 0.1 | 0.6 | GO:0000414 | regulation of histone H3-K36 methylation(GO:0000414) |
| 0.1 | 0.7 | GO:0006682 | galactosylceramide biosynthetic process(GO:0006682) galactolipid biosynthetic process(GO:0019375) |
| 0.1 | 6.3 | GO:0010923 | negative regulation of phosphatase activity(GO:0010923) |
| 0.1 | 0.3 | GO:0090235 | regulation of metaphase plate congression(GO:0090235) |
| 0.1 | 0.3 | GO:0090309 | positive regulation of methylation-dependent chromatin silencing(GO:0090309) |
| 0.1 | 0.6 | GO:0006123 | mitochondrial electron transport, cytochrome c to oxygen(GO:0006123) |
| 0.1 | 1.0 | GO:0036295 | cellular response to increased oxygen levels(GO:0036295) |
| 0.1 | 0.5 | GO:1902416 | positive regulation of mRNA binding(GO:1902416) |
| 0.0 | 0.5 | GO:0051967 | negative regulation of synaptic transmission, glutamatergic(GO:0051967) |
| 0.0 | 0.9 | GO:0014823 | response to activity(GO:0014823) |
| 0.0 | 0.6 | GO:0007202 | activation of phospholipase C activity(GO:0007202) positive regulation of execution phase of apoptosis(GO:1900119) |
| 0.0 | 0.2 | GO:0051012 | microtubule sliding(GO:0051012) |
| 0.0 | 0.5 | GO:1900383 | regulation of synaptic plasticity by receptor localization to synapse(GO:1900383) |
| 0.0 | 0.7 | GO:0051573 | negative regulation of histone H3-K9 methylation(GO:0051573) |
| 0.0 | 0.1 | GO:0032289 | central nervous system myelin formation(GO:0032289) |
| 0.0 | 0.1 | GO:1903546 | protein localization to photoreceptor outer segment(GO:1903546) |
| 0.0 | 0.3 | GO:0070475 | rRNA base methylation(GO:0070475) |
| 0.0 | 0.2 | GO:0033632 | regulation of cell-cell adhesion mediated by integrin(GO:0033632) |
| 0.0 | 0.5 | GO:0010566 | regulation of ketone biosynthetic process(GO:0010566) |
| 0.0 | 4.9 | GO:0050731 | positive regulation of peptidyl-tyrosine phosphorylation(GO:0050731) |
| 0.0 | 0.9 | GO:0050873 | brown fat cell differentiation(GO:0050873) |
| 0.0 | 0.2 | GO:0035093 | spermatogenesis, exchange of chromosomal proteins(GO:0035093) |
| 0.0 | 2.5 | GO:0051965 | positive regulation of synapse assembly(GO:0051965) |
| 0.0 | 0.2 | GO:1901837 | negative regulation of transcription of nuclear large rRNA transcript from RNA polymerase I promoter(GO:1901837) |
| 0.0 | 0.2 | GO:0032782 | bile acid secretion(GO:0032782) |
| 0.0 | 3.3 | GO:0008286 | insulin receptor signaling pathway(GO:0008286) |
| 0.0 | 1.2 | GO:0006801 | superoxide metabolic process(GO:0006801) |
| 0.0 | 0.1 | GO:0017183 | peptidyl-diphthamide metabolic process(GO:0017182) peptidyl-diphthamide biosynthetic process from peptidyl-histidine(GO:0017183) |
| 0.0 | 0.5 | GO:0097094 | craniofacial suture morphogenesis(GO:0097094) |
| 0.0 | 0.1 | GO:0031022 | nuclear migration along microfilament(GO:0031022) |
| 0.0 | 0.9 | GO:0042551 | neuron maturation(GO:0042551) |
| 0.0 | 0.1 | GO:0007158 | neuron cell-cell adhesion(GO:0007158) |
| 0.0 | 0.6 | GO:0048791 | calcium ion-regulated exocytosis of neurotransmitter(GO:0048791) |
| 0.0 | 0.2 | GO:0042407 | cristae formation(GO:0042407) |
| 0.0 | 0.7 | GO:0031122 | cytoplasmic microtubule organization(GO:0031122) |
| 0.0 | 0.8 | GO:0016574 | histone ubiquitination(GO:0016574) |
| 0.0 | 0.4 | GO:1903146 | regulation of mitophagy(GO:1903146) |
Gene overrepresentation in cellular_component category:
| Log-likelihood per target | Total log-likelihood | Term | Description |
|---|---|---|---|
| 0.3 | 1.6 | GO:0033116 | endoplasmic reticulum-Golgi intermediate compartment membrane(GO:0033116) |
| 0.2 | 3.4 | GO:0031045 | dense core granule(GO:0031045) |
| 0.2 | 1.4 | GO:0042613 | MHC class II protein complex(GO:0042613) |
| 0.1 | 1.8 | GO:1902711 | GABA-A receptor complex(GO:1902711) |
| 0.1 | 0.8 | GO:0001739 | sex chromatin(GO:0001739) |
| 0.1 | 0.5 | GO:0032983 | kainate selective glutamate receptor complex(GO:0032983) |
| 0.1 | 1.1 | GO:0072546 | ER membrane protein complex(GO:0072546) |
| 0.1 | 0.7 | GO:0097136 | Bcl-2 family protein complex(GO:0097136) |
| 0.1 | 1.0 | GO:0016471 | vacuolar proton-transporting V-type ATPase complex(GO:0016471) |
| 0.1 | 1.1 | GO:0097470 | ribbon synapse(GO:0097470) |
| 0.1 | 2.1 | GO:0032590 | dendrite membrane(GO:0032590) |
| 0.1 | 0.5 | GO:0071541 | eukaryotic translation initiation factor 3 complex, eIF3m(GO:0071541) |
| 0.1 | 0.3 | GO:0001652 | granular component(GO:0001652) |
| 0.1 | 0.7 | GO:0043231 | intracellular membrane-bounded organelle(GO:0043231) |
| 0.1 | 0.6 | GO:0042622 | photoreceptor outer segment membrane(GO:0042622) |
| 0.0 | 6.1 | GO:0031225 | anchored component of membrane(GO:0031225) |
| 0.0 | 0.6 | GO:0005751 | mitochondrial respiratory chain complex IV(GO:0005751) |
| 0.0 | 0.7 | GO:0016580 | Sin3 complex(GO:0016580) |
| 0.0 | 0.8 | GO:0005865 | striated muscle thin filament(GO:0005865) |
| 0.0 | 0.2 | GO:0061617 | MICOS complex(GO:0061617) |
| 0.0 | 0.4 | GO:0031143 | pseudopodium(GO:0031143) |
| 0.0 | 0.4 | GO:0033655 | host cell cytoplasm(GO:0030430) host cell cytoplasm part(GO:0033655) |
| 0.0 | 0.9 | GO:0005913 | cell-cell adherens junction(GO:0005913) |
| 0.0 | 2.2 | GO:0001669 | acrosomal vesicle(GO:0001669) |
| 0.0 | 0.7 | GO:0034451 | centriolar satellite(GO:0034451) |
| 0.0 | 0.5 | GO:0005666 | DNA-directed RNA polymerase III complex(GO:0005666) |
| 0.0 | 0.1 | GO:0071817 | MMXD complex(GO:0071817) |
| 0.0 | 0.7 | GO:0000795 | synaptonemal complex(GO:0000795) |
| 0.0 | 0.3 | GO:0031932 | TORC2 complex(GO:0031932) |
| 0.0 | 0.2 | GO:0071598 | neuronal ribonucleoprotein granule(GO:0071598) |
| 0.0 | 0.1 | GO:0005787 | signal peptidase complex(GO:0005787) |
| 0.0 | 0.3 | GO:0030914 | STAGA complex(GO:0030914) |
| 0.0 | 1.1 | GO:0019005 | SCF ubiquitin ligase complex(GO:0019005) |
| 0.0 | 0.9 | GO:0005844 | polysome(GO:0005844) |
| 0.0 | 0.6 | GO:0016235 | aggresome(GO:0016235) |
| 0.0 | 0.5 | GO:0022627 | cytosolic small ribosomal subunit(GO:0022627) |
Gene overrepresentation in molecular_function category:
| Log-likelihood per target | Total log-likelihood | Term | Description |
|---|---|---|---|
| 1.2 | 3.5 | GO:0008330 | protein tyrosine/threonine phosphatase activity(GO:0008330) |
| 0.2 | 0.9 | GO:0016909 | JUN kinase activity(GO:0004705) SAP kinase activity(GO:0016909) |
| 0.2 | 0.7 | GO:0047275 | glucosaminylgalactosylglucosylceramide beta-galactosyltransferase activity(GO:0047275) |
| 0.2 | 1.0 | GO:0009378 | four-way junction helicase activity(GO:0009378) |
| 0.2 | 3.4 | GO:0042056 | chemoattractant activity(GO:0042056) |
| 0.1 | 1.1 | GO:0016618 | hydroxypyruvate reductase activity(GO:0016618) glyoxylate reductase (NADP) activity(GO:0030267) |
| 0.1 | 1.1 | GO:0015087 | cobalt ion transmembrane transporter activity(GO:0015087) |
| 0.1 | 0.3 | GO:0008988 | rRNA (adenine-N6-)-methyltransferase activity(GO:0008988) U6 snRNA 3'-end binding(GO:0030629) |
| 0.1 | 0.8 | GO:0008395 | steroid hydroxylase activity(GO:0008395) |
| 0.1 | 2.1 | GO:0008188 | neuropeptide receptor activity(GO:0008188) |
| 0.1 | 0.6 | GO:0046975 | histone methyltransferase activity (H3-K36 specific)(GO:0046975) |
| 0.1 | 1.8 | GO:0004890 | GABA-A receptor activity(GO:0004890) |
| 0.1 | 0.9 | GO:0015217 | ATP transmembrane transporter activity(GO:0005347) ADP transmembrane transporter activity(GO:0015217) |
| 0.1 | 0.8 | GO:0005523 | tropomyosin binding(GO:0005523) |
| 0.1 | 1.0 | GO:0008553 | hydrogen-exporting ATPase activity, phosphorylative mechanism(GO:0008553) |
| 0.1 | 0.5 | GO:0015277 | kainate selective glutamate receptor activity(GO:0015277) |
| 0.1 | 0.7 | GO:0051434 | BH3 domain binding(GO:0051434) |
| 0.1 | 0.9 | GO:0001618 | virus receptor activity(GO:0001618) |
| 0.1 | 3.3 | GO:0005158 | insulin receptor binding(GO:0005158) |
| 0.1 | 0.6 | GO:0047391 | alkylglycerophosphoethanolamine phosphodiesterase activity(GO:0047391) |
| 0.1 | 1.1 | GO:0001848 | complement binding(GO:0001848) |
| 0.0 | 0.2 | GO:0015254 | glycerol channel activity(GO:0015254) |
| 0.0 | 0.3 | GO:0070180 | large ribosomal subunit rRNA binding(GO:0070180) |
| 0.0 | 1.8 | GO:0004867 | serine-type endopeptidase inhibitor activity(GO:0004867) |
| 0.0 | 0.6 | GO:0015020 | glucuronosyltransferase activity(GO:0015020) |
| 0.0 | 0.7 | GO:0031489 | myosin V binding(GO:0031489) |
| 0.0 | 0.5 | GO:0070403 | NAD+ binding(GO:0070403) |
| 0.0 | 0.4 | GO:0005537 | mannose binding(GO:0005537) |
| 0.0 | 0.6 | GO:0070577 | lysine-acetylated histone binding(GO:0070577) |
| 0.0 | 0.7 | GO:0003887 | DNA-directed DNA polymerase activity(GO:0003887) |
| 0.0 | 0.5 | GO:0001056 | RNA polymerase III activity(GO:0001056) |
| 0.0 | 0.6 | GO:0004129 | cytochrome-c oxidase activity(GO:0004129) heme-copper terminal oxidase activity(GO:0015002) oxidoreductase activity, acting on a heme group of donors, oxygen as acceptor(GO:0016676) |
| 0.0 | 0.6 | GO:0043274 | phospholipase binding(GO:0043274) |
| 0.0 | 0.1 | GO:0043139 | 5'-3' DNA helicase activity(GO:0043139) |
| 0.0 | 0.6 | GO:0050699 | WW domain binding(GO:0050699) |
| 0.0 | 1.0 | GO:0003743 | translation initiation factor activity(GO:0003743) |
| 0.0 | 0.1 | GO:0043515 | kinetochore binding(GO:0043515) |
| 0.0 | 0.6 | GO:0005544 | calcium-dependent phospholipid binding(GO:0005544) |
| 0.0 | 6.9 | GO:0001228 | transcriptional activator activity, RNA polymerase II transcription regulatory region sequence-specific binding(GO:0001228) |
| 0.0 | 0.4 | GO:0042974 | retinoic acid receptor binding(GO:0042974) |
Gene overrepresentation in C2:CP category:
| Log-likelihood per target | Total log-likelihood | Term | Description |
|---|---|---|---|
| 0.1 | 1.2 | PID_VEGF_VEGFR_PATHWAY | VEGF and VEGFR signaling network |
| 0.1 | 4.4 | ST_JNK_MAPK_PATHWAY | JNK MAPK Pathway |
| 0.1 | 4.9 | PID_RET_PATHWAY | Signaling events regulated by Ret tyrosine kinase |
| 0.1 | 0.6 | PID_RHODOPSIN_PATHWAY | Visual signal transduction: Rods |
| 0.0 | 3.3 | SIG_INSULIN_RECEPTOR_PATHWAY_IN_CARDIAC_MYOCYTES | Genes related to the insulin receptor pathway |
| 0.0 | 0.9 | PID_NECTIN_PATHWAY | Nectin adhesion pathway |
| 0.0 | 0.7 | SA_PROGRAMMED_CELL_DEATH | Programmed cell death, or apoptosis, eliminates damaged or unneeded cells. |
| 0.0 | 0.3 | PID_WNT_NONCANONICAL_PATHWAY | Noncanonical Wnt signaling pathway |
| 0.0 | 0.3 | PID_MYC_PATHWAY | C-MYC pathway |
Gene overrepresentation in C2:CP:REACTOME category:
| Log-likelihood per target | Total log-likelihood | Term | Description |
|---|---|---|---|
| 0.2 | 3.5 | REACTOME_ERKS_ARE_INACTIVATED | Genes involved in ERKs are inactivated |
| 0.1 | 0.8 | REACTOME_ENDOGENOUS_STEROLS | Genes involved in Endogenous sterols |
| 0.1 | 1.8 | REACTOME_GABA_A_RECEPTOR_ACTIVATION | Genes involved in GABA A receptor activation |
| 0.1 | 4.9 | REACTOME_NCAM1_INTERACTIONS | Genes involved in NCAM1 interactions |
| 0.1 | 1.2 | REACTOME_VEGF_LIGAND_RECEPTOR_INTERACTIONS | Genes involved in VEGF ligand-receptor interactions |
| 0.1 | 0.4 | REACTOME_OLFACTORY_SIGNALING_PATHWAY | Genes involved in Olfactory Signaling Pathway |
| 0.1 | 0.7 | REACTOME_BASE_FREE_SUGAR_PHOSPHATE_REMOVAL_VIA_THE_SINGLE_NUCLEOTIDE_REPLACEMENT_PATHWAY | Genes involved in Base-free sugar-phosphate removal via the single-nucleotide replacement pathway |
| 0.1 | 0.9 | REACTOME_ACTIVATION_OF_THE_AP1_FAMILY_OF_TRANSCRIPTION_FACTORS | Genes involved in Activation of the AP-1 family of transcription factors |
| 0.0 | 0.7 | REACTOME_INFLAMMASOMES | Genes involved in Inflammasomes |
| 0.0 | 1.0 | REACTOME_INSULIN_RECEPTOR_RECYCLING | Genes involved in Insulin receptor recycling |
| 0.0 | 0.9 | REACTOME_IMMUNOREGULATORY_INTERACTIONS_BETWEEN_A_LYMPHOID_AND_A_NON_LYMPHOID_CELL | Genes involved in Immunoregulatory interactions between a Lymphoid and a non-Lymphoid cell |
| 0.0 | 0.4 | REACTOME_GLUCURONIDATION | Genes involved in Glucuronidation |
| 0.0 | 0.5 | REACTOME_IONOTROPIC_ACTIVITY_OF_KAINATE_RECEPTORS | Genes involved in Ionotropic activity of Kainate Receptors |
| 0.0 | 0.5 | REACTOME_RNA_POL_III_CHAIN_ELONGATION | Genes involved in RNA Polymerase III Chain Elongation |
| 0.0 | 0.2 | REACTOME_PASSIVE_TRANSPORT_BY_AQUAPORINS | Genes involved in Passive Transport by Aquaporins |
| 0.0 | 0.4 | REACTOME_NEPHRIN_INTERACTIONS | Genes involved in Nephrin interactions |
| 0.0 | 1.8 | REACTOME_G_ALPHA_Q_SIGNALLING_EVENTS | Genes involved in G alpha (q) signalling events |