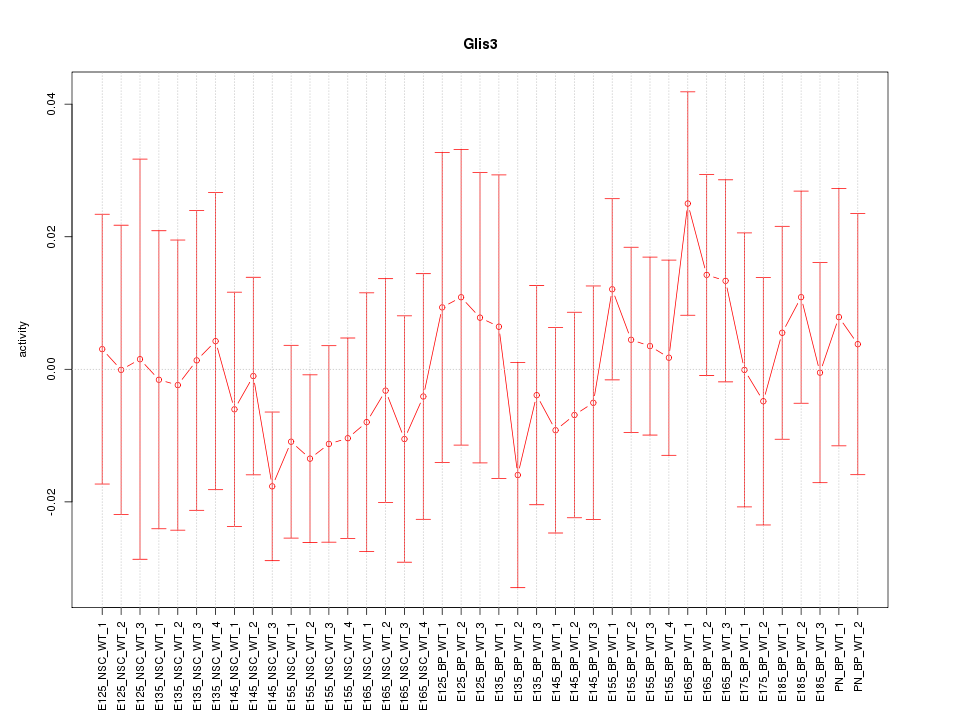
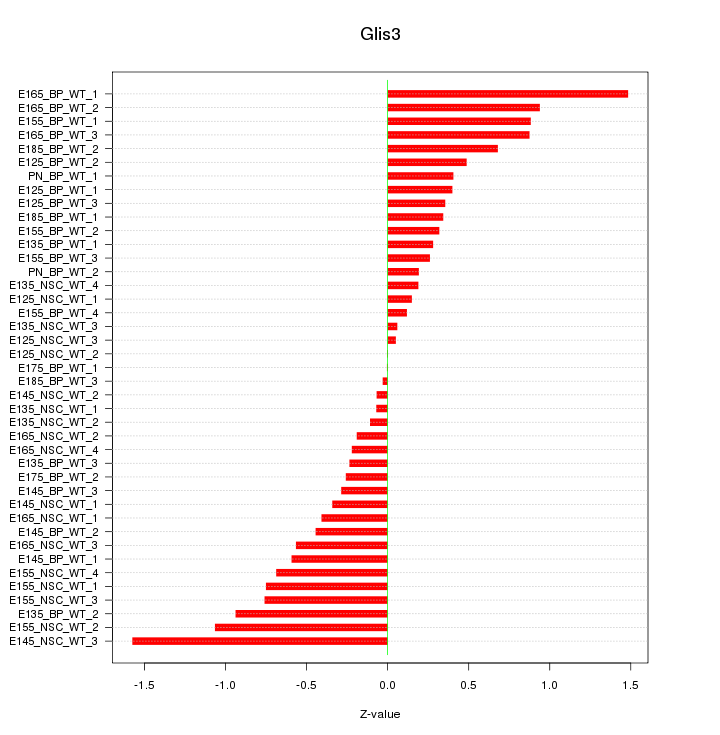
Motif ID: Glis3
Z-value: 0.581

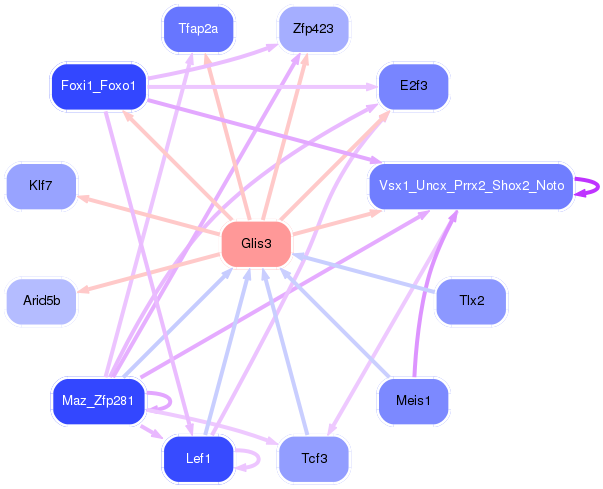
Transcription factors associated with Glis3:
| Gene Symbol | Entrez ID | Gene Name |
|---|---|---|
| Glis3 | ENSMUSG00000052942.7 | Glis3 |
| Glis3 | ENSMUSG00000091294.1 | Glis3 |
Activity-expression correlation:
| Gene Symbol | Promoter | Pearson corr. coef. | P-value | Plot |
|---|---|---|---|---|
| Glis3 | mm10_v2_chr19_-_28680077_28680122 | 0.14 | 3.8e-01 | Click! |

Top targets:
Gene overrepresentation in biological_process category:
| Log-likelihood per target | Total log-likelihood | Term | Description |
|---|---|---|---|
| 0.5 | 5.7 | GO:0042572 | retinol metabolic process(GO:0042572) |
| 0.5 | 3.4 | GO:0070494 | regulation of thrombin receptor signaling pathway(GO:0070494) negative regulation of thrombin receptor signaling pathway(GO:0070495) |
| 0.3 | 0.9 | GO:0070172 | oculomotor nerve development(GO:0021557) positive regulation of tooth mineralization(GO:0070172) |
| 0.2 | 0.8 | GO:0042414 | epinephrine metabolic process(GO:0042414) |
| 0.2 | 0.6 | GO:0032915 | positive regulation of transforming growth factor beta2 production(GO:0032915) |
| 0.1 | 0.4 | GO:0010845 | positive regulation of reciprocal meiotic recombination(GO:0010845) |
| 0.1 | 1.1 | GO:0038028 | insulin receptor signaling pathway via phosphatidylinositol 3-kinase(GO:0038028) |
| 0.1 | 0.2 | GO:1990869 | response to chemokine(GO:1990868) cellular response to chemokine(GO:1990869) |
| 0.1 | 0.6 | GO:0070345 | negative regulation of fat cell proliferation(GO:0070345) |
| 0.1 | 0.6 | GO:0032346 | positive regulation of aldosterone metabolic process(GO:0032346) positive regulation of aldosterone biosynthetic process(GO:0032349) |
| 0.1 | 0.4 | GO:0072675 | osteoclast fusion(GO:0072675) |
| 0.1 | 0.8 | GO:0010587 | miRNA catabolic process(GO:0010587) |
| 0.1 | 0.4 | GO:0021914 | negative regulation of smoothened signaling pathway involved in ventral spinal cord patterning(GO:0021914) |
| 0.1 | 0.8 | GO:0048672 | positive regulation of collateral sprouting(GO:0048672) |
| 0.1 | 0.5 | GO:0070814 | hydrogen sulfide biosynthetic process(GO:0070814) |
| 0.1 | 0.3 | GO:0046898 | response to cycloheximide(GO:0046898) |
| 0.1 | 0.5 | GO:0014043 | negative regulation of neuron maturation(GO:0014043) |
| 0.1 | 0.1 | GO:0072053 | renal inner medulla development(GO:0072053) renal outer medulla development(GO:0072054) |
| 0.1 | 0.2 | GO:1903265 | positive regulation of tumor necrosis factor-mediated signaling pathway(GO:1903265) |
| 0.1 | 0.2 | GO:1905072 | detection of oxygen(GO:0003032) positive regulation of vascular smooth muscle cell differentiation(GO:1905065) cardiac jelly development(GO:1905072) |
| 0.1 | 0.5 | GO:0060613 | fat pad development(GO:0060613) |
| 0.1 | 0.6 | GO:0019368 | fatty acid elongation, saturated fatty acid(GO:0019367) fatty acid elongation, unsaturated fatty acid(GO:0019368) fatty acid elongation, monounsaturated fatty acid(GO:0034625) fatty acid elongation, polyunsaturated fatty acid(GO:0034626) |
| 0.0 | 0.2 | GO:0030240 | skeletal muscle thin filament assembly(GO:0030240) |
| 0.0 | 0.9 | GO:0021521 | ventral spinal cord interneuron specification(GO:0021521) cell fate specification involved in pattern specification(GO:0060573) |
| 0.0 | 0.5 | GO:0048742 | regulation of skeletal muscle fiber development(GO:0048742) embryonic skeletal joint morphogenesis(GO:0060272) regulation of branching morphogenesis of a nerve(GO:2000172) |
| 0.0 | 0.3 | GO:0051151 | negative regulation of smooth muscle cell differentiation(GO:0051151) |
| 0.0 | 0.6 | GO:0051574 | positive regulation of histone H3-K9 methylation(GO:0051574) |
| 0.0 | 0.6 | GO:0070914 | UV-damage excision repair(GO:0070914) |
| 0.0 | 0.4 | GO:0071455 | response to hyperoxia(GO:0055093) cellular response to hyperoxia(GO:0071455) |
| 0.0 | 0.2 | GO:0060903 | positive regulation of meiosis I(GO:0060903) |
| 0.0 | 0.3 | GO:1900113 | negative regulation of histone H3-K9 trimethylation(GO:1900113) |
| 0.0 | 0.2 | GO:1905247 | positive regulation of aspartic-type endopeptidase activity involved in amyloid precursor protein catabolic process(GO:1902961) negative regulation of metalloendopeptidase activity(GO:1904684) positive regulation of aspartic-type peptidase activity(GO:1905247) |
| 0.0 | 0.2 | GO:0072718 | response to cisplatin(GO:0072718) |
| 0.0 | 0.1 | GO:0019230 | proprioception(GO:0019230) |
| 0.0 | 0.6 | GO:0033235 | positive regulation of protein sumoylation(GO:0033235) |
| 0.0 | 0.4 | GO:0045671 | negative regulation of osteoclast differentiation(GO:0045671) |
| 0.0 | 0.1 | GO:0051599 | response to hydrostatic pressure(GO:0051599) |
| 0.0 | 0.7 | GO:0016578 | histone deubiquitination(GO:0016578) |
| 0.0 | 0.5 | GO:0060746 | parental behavior(GO:0060746) |
| 0.0 | 0.7 | GO:0071384 | cellular response to corticosteroid stimulus(GO:0071384) cellular response to glucocorticoid stimulus(GO:0071385) |
| 0.0 | 0.3 | GO:0046498 | S-adenosylhomocysteine metabolic process(GO:0046498) |
| 0.0 | 0.5 | GO:0046856 | phosphatidylinositol dephosphorylation(GO:0046856) |
| 0.0 | 0.2 | GO:0032780 | negative regulation of ATPase activity(GO:0032780) |
| 0.0 | 0.4 | GO:2000001 | regulation of DNA damage checkpoint(GO:2000001) |
| 0.0 | 0.3 | GO:0014067 | negative regulation of phosphatidylinositol 3-kinase signaling(GO:0014067) |
| 0.0 | 0.1 | GO:0051305 | chromosome movement towards spindle pole(GO:0051305) |
| 0.0 | 0.2 | GO:2000766 | negative regulation of cytoplasmic translation(GO:2000766) |
| 0.0 | 0.1 | GO:0014029 | neural crest formation(GO:0014029) |
| 0.0 | 0.5 | GO:0030513 | positive regulation of BMP signaling pathway(GO:0030513) |
| 0.0 | 0.1 | GO:0048149 | behavioral response to ethanol(GO:0048149) |
| 0.0 | 0.3 | GO:2001224 | positive regulation of neuron migration(GO:2001224) |
| 0.0 | 0.1 | GO:0035115 | embryonic forelimb morphogenesis(GO:0035115) |
| 0.0 | 0.2 | GO:0018195 | peptidyl-arginine modification(GO:0018195) |
| 0.0 | 0.2 | GO:0035414 | negative regulation of catenin import into nucleus(GO:0035414) |
| 0.0 | 0.4 | GO:0010591 | regulation of lamellipodium assembly(GO:0010591) |
| 0.0 | 0.0 | GO:0035426 | extracellular matrix-cell signaling(GO:0035426) |
| 0.0 | 0.1 | GO:0006362 | transcription elongation from RNA polymerase I promoter(GO:0006362) |
Gene overrepresentation in cellular_component category:
| Log-likelihood per target | Total log-likelihood | Term | Description |
|---|---|---|---|
| 0.3 | 0.8 | GO:0045009 | melanosome membrane(GO:0033162) chitosome(GO:0045009) |
| 0.1 | 0.4 | GO:0033503 | HULC complex(GO:0033503) |
| 0.1 | 0.4 | GO:0032299 | ribonuclease H2 complex(GO:0032299) |
| 0.1 | 0.2 | GO:0070381 | endosome to plasma membrane transport vesicle(GO:0070381) |
| 0.0 | 3.5 | GO:0009925 | basal plasma membrane(GO:0009925) |
| 0.0 | 0.3 | GO:0031465 | Cul4B-RING E3 ubiquitin ligase complex(GO:0031465) |
| 0.0 | 0.7 | GO:0000124 | SAGA complex(GO:0000124) |
| 0.0 | 0.9 | GO:0080008 | Cul4-RING E3 ubiquitin ligase complex(GO:0080008) |
| 0.0 | 0.1 | GO:0031084 | BLOC-2 complex(GO:0031084) |
| 0.0 | 0.3 | GO:0031618 | nuclear pericentric heterochromatin(GO:0031618) |
| 0.0 | 0.3 | GO:0097136 | Bcl-2 family protein complex(GO:0097136) |
| 0.0 | 0.6 | GO:0035098 | ESC/E(Z) complex(GO:0035098) |
| 0.0 | 0.1 | GO:0072487 | MSL complex(GO:0072487) |
| 0.0 | 0.3 | GO:0031011 | Ino80 complex(GO:0031011) |
| 0.0 | 0.1 | GO:0033256 | I-kappaB/NF-kappaB complex(GO:0033256) |
| 0.0 | 0.3 | GO:0016581 | NuRD complex(GO:0016581) CHD-type complex(GO:0090545) |
| 0.0 | 0.6 | GO:0035861 | site of double-strand break(GO:0035861) |
| 0.0 | 0.7 | GO:0045271 | mitochondrial respiratory chain complex I(GO:0005747) NADH dehydrogenase complex(GO:0030964) respiratory chain complex I(GO:0045271) |
| 0.0 | 0.7 | GO:0097610 | cleavage furrow(GO:0032154) cell surface furrow(GO:0097610) |
| 0.0 | 0.2 | GO:0008250 | oligosaccharyltransferase complex(GO:0008250) |
| 0.0 | 0.6 | GO:0016605 | PML body(GO:0016605) |
| 0.0 | 0.8 | GO:0010494 | cytoplasmic stress granule(GO:0010494) |
Gene overrepresentation in molecular_function category:
| Log-likelihood per target | Total log-likelihood | Term | Description |
|---|---|---|---|
| 0.8 | 3.4 | GO:0005008 | hepatocyte growth factor-activated receptor activity(GO:0005008) |
| 0.8 | 5.7 | GO:0052650 | NADP-retinol dehydrogenase activity(GO:0052650) |
| 0.2 | 0.8 | GO:0035240 | dopamine binding(GO:0035240) |
| 0.1 | 0.8 | GO:0008494 | translation activator activity(GO:0008494) |
| 0.1 | 0.5 | GO:0052629 | phosphatidylinositol-3,5-bisphosphate 3-phosphatase activity(GO:0052629) |
| 0.1 | 0.8 | GO:0002151 | G-quadruplex RNA binding(GO:0002151) |
| 0.1 | 0.4 | GO:0045545 | syndecan binding(GO:0045545) |
| 0.1 | 0.3 | GO:0004719 | protein-L-isoaspartate (D-aspartate) O-methyltransferase activity(GO:0004719) |
| 0.1 | 0.6 | GO:0070700 | BMP receptor binding(GO:0070700) |
| 0.1 | 0.4 | GO:0004523 | RNA-DNA hybrid ribonuclease activity(GO:0004523) |
| 0.1 | 0.6 | GO:0009922 | fatty acid elongase activity(GO:0009922) 3-oxo-arachidoyl-CoA synthase activity(GO:0102336) 3-oxo-cerotoyl-CoA synthase activity(GO:0102337) 3-oxo-lignoceronyl-CoA synthase activity(GO:0102338) |
| 0.1 | 0.6 | GO:0008140 | cAMP response element binding protein binding(GO:0008140) |
| 0.0 | 0.6 | GO:0031386 | protein tag(GO:0031386) |
| 0.0 | 1.1 | GO:0043539 | insulin-like growth factor receptor binding(GO:0005159) protein serine/threonine kinase activator activity(GO:0043539) |
| 0.0 | 0.3 | GO:0051434 | BH3 domain binding(GO:0051434) |
| 0.0 | 0.2 | GO:0005534 | galactose binding(GO:0005534) |
| 0.0 | 0.1 | GO:1902379 | chemoattractant activity involved in axon guidance(GO:1902379) |
| 0.0 | 0.5 | GO:0032454 | histone demethylase activity (H3-K9 specific)(GO:0032454) |
| 0.0 | 0.7 | GO:0032452 | histone demethylase activity(GO:0032452) |
| 0.0 | 0.1 | GO:0048763 | calcium-induced calcium release activity(GO:0048763) |
| 0.0 | 0.8 | GO:0001103 | RNA polymerase II repressing transcription factor binding(GO:0001103) |
| 0.0 | 0.7 | GO:0050136 | NADH dehydrogenase (ubiquinone) activity(GO:0008137) NADH dehydrogenase (quinone) activity(GO:0050136) |
| 0.0 | 0.2 | GO:0004185 | serine-type carboxypeptidase activity(GO:0004185) |
| 0.0 | 0.5 | GO:0004129 | cytochrome-c oxidase activity(GO:0004129) heme-copper terminal oxidase activity(GO:0015002) oxidoreductase activity, acting on a heme group of donors, oxygen as acceptor(GO:0016676) |
| 0.0 | 0.2 | GO:0051022 | Rho GDP-dissociation inhibitor binding(GO:0051022) |
| 0.0 | 0.9 | GO:0001106 | RNA polymerase II transcription corepressor activity(GO:0001106) |
| 0.0 | 0.1 | GO:0001165 | RNA polymerase I upstream control element sequence-specific DNA binding(GO:0001165) |
| 0.0 | 0.2 | GO:0035615 | clathrin adaptor activity(GO:0035615) endocytic adaptor activity(GO:0098748) |
| 0.0 | 0.2 | GO:1990715 | mRNA CDS binding(GO:1990715) |
| 0.0 | 0.2 | GO:0070097 | delta-catenin binding(GO:0070097) |
| 0.0 | 0.2 | GO:0004576 | oligosaccharyl transferase activity(GO:0004576) dolichyl-diphosphooligosaccharide-protein glycotransferase activity(GO:0004579) |
| 0.0 | 0.3 | GO:0030215 | semaphorin receptor binding(GO:0030215) |
| 0.0 | 0.4 | GO:0001223 | transcription coactivator binding(GO:0001223) |
| 0.0 | 0.2 | GO:0098641 | cadherin binding involved in cell-cell adhesion(GO:0098641) |
| 0.0 | 0.7 | GO:0030374 | ligand-dependent nuclear receptor transcription coactivator activity(GO:0030374) |
| 0.0 | 0.0 | GO:2001069 | glycogen binding(GO:2001069) |
| 0.0 | 0.3 | GO:0043014 | alpha-tubulin binding(GO:0043014) |
| 0.0 | 0.2 | GO:0004697 | protein kinase C activity(GO:0004697) |
Gene overrepresentation in C2:CP category:
| Log-likelihood per target | Total log-likelihood | Term | Description |
|---|---|---|---|
| 0.1 | 6.2 | PID_TAP63_PATHWAY | Validated transcriptional targets of TAp63 isoforms |
| 0.1 | 3.3 | PID_ARF6_PATHWAY | Arf6 signaling events |
| 0.0 | 0.7 | PID_HDAC_CLASSIII_PATHWAY | Signaling events mediated by HDAC Class III |
| 0.0 | 1.7 | PID_ATF2_PATHWAY | ATF-2 transcription factor network |
| 0.0 | 0.2 | PID_THROMBIN_PAR4_PATHWAY | PAR4-mediated thrombin signaling events |
| 0.0 | 1.1 | PID_AJDISS_2PATHWAY | Posttranslational regulation of adherens junction stability and dissassembly |
| 0.0 | 1.0 | PID_BMP_PATHWAY | BMP receptor signaling |
| 0.0 | 0.5 | PID_WNT_SIGNALING_PATHWAY | Wnt signaling network |
| 0.0 | 0.9 | PID_CASPASE_PATHWAY | Caspase cascade in apoptosis |
Gene overrepresentation in C2:CP:REACTOME category:
| Log-likelihood per target | Total log-likelihood | Term | Description |
|---|---|---|---|
| 0.1 | 3.5 | REACTOME_SEMA4D_IN_SEMAPHORIN_SIGNALING | Genes involved in Sema4D in semaphorin signaling |
| 0.1 | 0.8 | REACTOME_AMINE_DERIVED_HORMONES | Genes involved in Amine-derived hormones |
| 0.1 | 1.1 | REACTOME_REGULATION_OF_INSULIN_LIKE_GROWTH_FACTOR_IGF_ACTIVITY_BY_INSULIN_LIKE_GROWTH_FACTOR_BINDING_PROTEINS_IGFBPS | Genes involved in Regulation of Insulin-like Growth Factor (IGF) Activity by Insulin-like Growth Factor Binding Proteins (IGFBPs) |
| 0.0 | 0.5 | REACTOME_CDC6_ASSOCIATION_WITH_THE_ORC_ORIGIN_COMPLEX | Genes involved in CDC6 association with the ORC:origin complex |
| 0.0 | 0.6 | REACTOME_ACTIVATION_OF_THE_AP1_FAMILY_OF_TRANSCRIPTION_FACTORS | Genes involved in Activation of the AP-1 family of transcription factors |
| 0.0 | 0.8 | REACTOME_DEADENYLATION_OF_MRNA | Genes involved in Deadenylation of mRNA |
| 0.0 | 0.6 | REACTOME_SYNTHESIS_OF_VERY_LONG_CHAIN_FATTY_ACYL_COAS | Genes involved in Synthesis of very long-chain fatty acyl-CoAs |
| 0.0 | 0.3 | REACTOME_INFLAMMASOMES | Genes involved in Inflammasomes |
| 0.0 | 0.4 | REACTOME_REGULATION_OF_GENE_EXPRESSION_IN_BETA_CELLS | Genes involved in Regulation of gene expression in beta cells |
| 0.0 | 0.5 | REACTOME_SMAD2_SMAD3_SMAD4_HETEROTRIMER_REGULATES_TRANSCRIPTION | Genes involved in SMAD2/SMAD3:SMAD4 heterotrimer regulates transcription |
| 0.0 | 0.3 | REACTOME_OTHER_SEMAPHORIN_INTERACTIONS | Genes involved in Other semaphorin interactions |