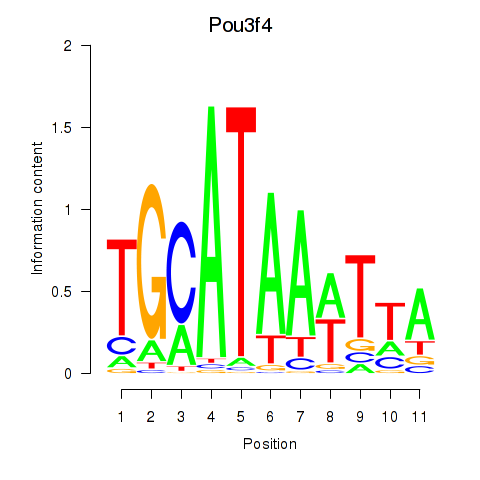
Motif ID: Pou3f4
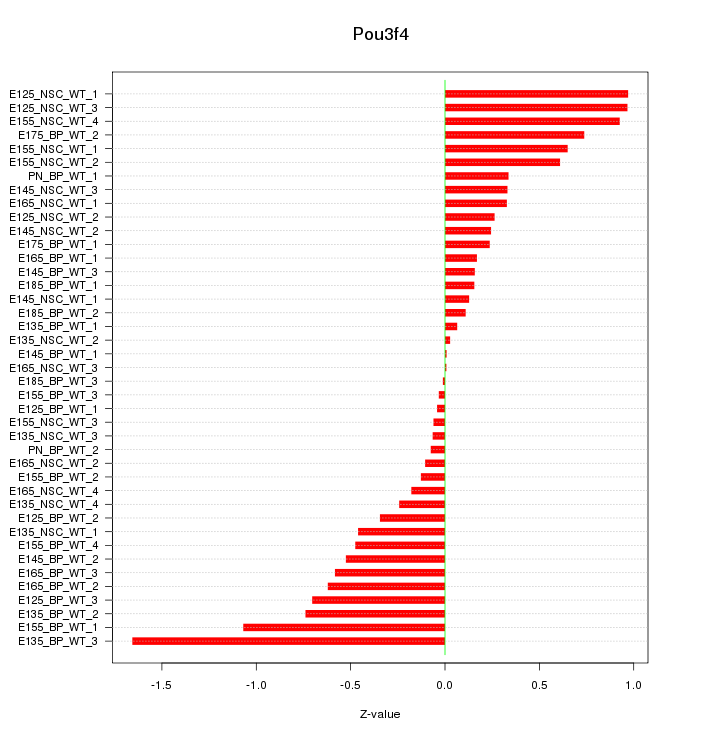
Z-value: 0.526
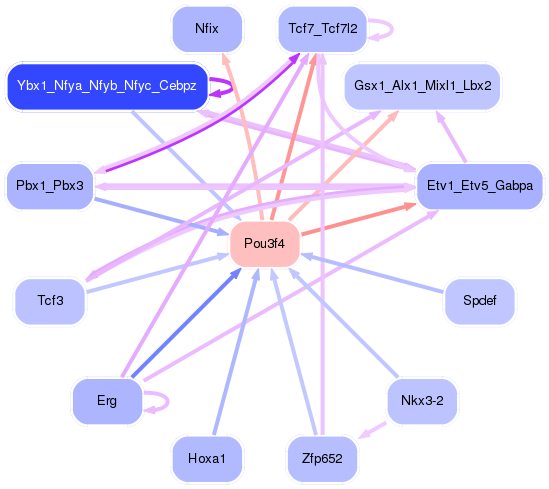
Transcription factors associated with Pou3f4:
| Gene Symbol | Entrez ID | Gene Name |
|---|---|---|
| Pou3f4 | ENSMUSG00000056854.3 | Pou3f4 |
Activity-expression correlation:
| Gene Symbol | Promoter | Pearson corr. coef. | P-value | Plot |
|---|---|---|---|---|
| Pou3f4 | mm10_v2_chrX_+_110814390_110814413 | -0.15 | 3.6e-01 | Click! |


Top targets:
Gene overrepresentation in biological_process category:
| Log-likelihood per target | Total log-likelihood | Term | Description |
|---|---|---|---|
| 0.8 | 4.2 | GO:0048133 | germ-line stem cell division(GO:0042078) male germ-line stem cell asymmetric division(GO:0048133) germline stem cell asymmetric division(GO:0098728) |
| 0.8 | 1.5 | GO:0072235 | distal convoluted tubule development(GO:0072025) metanephric distal convoluted tubule development(GO:0072221) metanephric distal tubule development(GO:0072235) |
| 0.7 | 5.9 | GO:0048625 | myoblast fate commitment(GO:0048625) |
| 0.6 | 4.0 | GO:0072257 | metanephric nephron tubule epithelial cell differentiation(GO:0072257) regulation of metanephric nephron tubule epithelial cell differentiation(GO:0072307) |
| 0.4 | 1.7 | GO:0010986 | positive regulation of lipoprotein particle clearance(GO:0010986) |
| 0.4 | 1.1 | GO:1904395 | positive regulation of skeletal muscle acetylcholine-gated channel clustering(GO:1904395) |
| 0.2 | 0.6 | GO:1903244 | positive regulation of cardiac muscle adaptation(GO:0010615) positive regulation of cardiac muscle hypertrophy in response to stress(GO:1903244) regulation of connective tissue replacement(GO:1905203) |
| 0.2 | 0.9 | GO:2000525 | regulation of T cell costimulation(GO:2000523) positive regulation of T cell costimulation(GO:2000525) |
| 0.2 | 0.8 | GO:0061010 | gall bladder development(GO:0061010) |
| 0.2 | 0.5 | GO:0002030 | inhibitory G-protein coupled receptor phosphorylation(GO:0002030) |
| 0.1 | 0.4 | GO:1900141 | regulation of oligodendrocyte apoptotic process(GO:1900141) negative regulation of oligodendrocyte apoptotic process(GO:1900142) |
| 0.1 | 0.4 | GO:0006030 | chitin metabolic process(GO:0006030) chitin catabolic process(GO:0006032) |
| 0.1 | 0.8 | GO:0070494 | regulation of thrombin receptor signaling pathway(GO:0070494) negative regulation of thrombin receptor signaling pathway(GO:0070495) |
| 0.1 | 0.6 | GO:0015842 | aminergic neurotransmitter loading into synaptic vesicle(GO:0015842) |
| 0.1 | 1.1 | GO:0014807 | regulation of somitogenesis(GO:0014807) |
| 0.1 | 0.7 | GO:0040031 | snRNA modification(GO:0040031) |
| 0.1 | 1.6 | GO:2000251 | positive regulation of actin cytoskeleton reorganization(GO:2000251) |
| 0.1 | 0.8 | GO:0021984 | adenohypophysis development(GO:0021984) |
| 0.1 | 0.4 | GO:0061743 | motor learning(GO:0061743) |
| 0.1 | 0.2 | GO:1901420 | negative regulation of response to alcohol(GO:1901420) |
| 0.0 | 0.4 | GO:0006003 | fructose 2,6-bisphosphate metabolic process(GO:0006003) |
| 0.0 | 0.2 | GO:0070171 | negative regulation of tooth mineralization(GO:0070171) |
| 0.0 | 1.1 | GO:0000028 | ribosomal small subunit assembly(GO:0000028) |
| 0.0 | 0.1 | GO:1902938 | regulation of intracellular calcium activated chloride channel activity(GO:1902938) |
| 0.0 | 0.4 | GO:0035095 | behavioral response to nicotine(GO:0035095) |
| 0.0 | 0.2 | GO:0044314 | protein K27-linked ubiquitination(GO:0044314) |
| 0.0 | 0.1 | GO:0051940 | regulation of dopamine uptake involved in synaptic transmission(GO:0051584) regulation of catecholamine uptake involved in synaptic transmission(GO:0051940) |
| 0.0 | 0.5 | GO:1902004 | positive regulation of beta-amyloid formation(GO:1902004) |
| 0.0 | 0.7 | GO:0051482 | positive regulation of cytosolic calcium ion concentration involved in phospholipase C-activating G-protein coupled signaling pathway(GO:0051482) |
| 0.0 | 0.5 | GO:0072520 | seminiferous tubule development(GO:0072520) |
| 0.0 | 0.3 | GO:0019800 | peptide cross-linking via chondroitin 4-sulfate glycosaminoglycan(GO:0019800) |
| 0.0 | 0.1 | GO:0086046 | membrane depolarization during SA node cell action potential(GO:0086046) |
| 0.0 | 0.4 | GO:1990403 | embryonic brain development(GO:1990403) |
| 0.0 | 0.4 | GO:0015937 | coenzyme A biosynthetic process(GO:0015937) |
| 0.0 | 0.5 | GO:0001553 | luteinization(GO:0001553) |
| 0.0 | 0.3 | GO:0045109 | intermediate filament organization(GO:0045109) |
| 0.0 | 0.2 | GO:0030382 | sperm mitochondrion organization(GO:0030382) |
| 0.0 | 0.3 | GO:0034244 | negative regulation of transcription elongation from RNA polymerase II promoter(GO:0034244) |
| 0.0 | 0.5 | GO:0099517 | anterograde synaptic vesicle transport(GO:0048490) synaptic vesicle cytoskeletal transport(GO:0099514) synaptic vesicle transport along microtubule(GO:0099517) |
| 0.0 | 0.2 | GO:0070475 | rRNA base methylation(GO:0070475) |
| 0.0 | 0.2 | GO:0032020 | ISG15-protein conjugation(GO:0032020) |
| 0.0 | 0.8 | GO:0050873 | brown fat cell differentiation(GO:0050873) |
| 0.0 | 0.2 | GO:0045040 | protein import into mitochondrial outer membrane(GO:0045040) |
| 0.0 | 0.4 | GO:0033539 | fatty acid beta-oxidation using acyl-CoA dehydrogenase(GO:0033539) |
| 0.0 | 0.2 | GO:1902916 | positive regulation of intracellular estrogen receptor signaling pathway(GO:0033148) positive regulation of protein polyubiquitination(GO:1902916) |
| 0.0 | 0.3 | GO:0021684 | cerebellar granular layer formation(GO:0021684) cerebellar granule cell differentiation(GO:0021707) |
| 0.0 | 0.2 | GO:1900383 | regulation of synaptic plasticity by receptor localization to synapse(GO:1900383) |
| 0.0 | 0.3 | GO:0000338 | protein deneddylation(GO:0000338) |
| 0.0 | 0.6 | GO:0032728 | positive regulation of interferon-beta production(GO:0032728) |
| 0.0 | 0.2 | GO:0036158 | outer dynein arm assembly(GO:0036158) |
| 0.0 | 0.0 | GO:0017183 | peptidyl-diphthamide metabolic process(GO:0017182) peptidyl-diphthamide biosynthetic process from peptidyl-histidine(GO:0017183) |
| 0.0 | 0.1 | GO:0071787 | endoplasmic reticulum tubular network assembly(GO:0071787) |
| 0.0 | 0.1 | GO:0007016 | cytoskeletal anchoring at plasma membrane(GO:0007016) |
| 0.0 | 0.2 | GO:0007216 | G-protein coupled glutamate receptor signaling pathway(GO:0007216) |
Gene overrepresentation in cellular_component category:
| Log-likelihood per target | Total log-likelihood | Term | Description |
|---|---|---|---|
| 0.7 | 5.9 | GO:0070369 | beta-catenin-TCF7L2 complex(GO:0070369) |
| 0.2 | 1.6 | GO:0071439 | clathrin complex(GO:0071439) |
| 0.1 | 0.4 | GO:0043540 | 6-phosphofructo-2-kinase/fructose-2,6-biphosphatase complex(GO:0043540) |
| 0.1 | 0.6 | GO:0005955 | calcineurin complex(GO:0005955) |
| 0.1 | 0.4 | GO:0042567 | insulin-like growth factor ternary complex(GO:0042567) |
| 0.1 | 0.4 | GO:0045251 | mitochondrial electron transfer flavoprotein complex(GO:0017133) electron transfer flavoprotein complex(GO:0045251) |
| 0.1 | 0.3 | GO:0030289 | protein phosphatase 4 complex(GO:0030289) |
| 0.1 | 0.5 | GO:1990726 | Lsm1-7-Pat1 complex(GO:1990726) |
| 0.1 | 0.4 | GO:0005828 | kinetochore microtubule(GO:0005828) |
| 0.0 | 0.4 | GO:0031080 | nuclear pore outer ring(GO:0031080) |
| 0.0 | 0.4 | GO:0005892 | acetylcholine-gated channel complex(GO:0005892) |
| 0.0 | 0.5 | GO:0031083 | BLOC-1 complex(GO:0031083) |
| 0.0 | 0.3 | GO:0045095 | keratin filament(GO:0045095) |
| 0.0 | 0.1 | GO:0042406 | extrinsic component of endoplasmic reticulum membrane(GO:0042406) |
| 0.0 | 1.1 | GO:0022627 | cytosolic small ribosomal subunit(GO:0022627) |
| 0.0 | 0.2 | GO:0097227 | sperm annulus(GO:0097227) |
| 0.0 | 0.2 | GO:0036157 | outer dynein arm(GO:0036157) |
| 0.0 | 0.7 | GO:0009925 | basal plasma membrane(GO:0009925) |
| 0.0 | 1.1 | GO:0031594 | neuromuscular junction(GO:0031594) |
| 0.0 | 2.0 | GO:0001650 | fibrillar center(GO:0001650) |
| 0.0 | 1.5 | GO:0043195 | terminal bouton(GO:0043195) |
| 0.0 | 0.1 | GO:0097449 | astrocyte projection(GO:0097449) |
| 0.0 | 0.2 | GO:0031616 | spindle pole centrosome(GO:0031616) |
| 0.0 | 0.1 | GO:1990454 | L-type voltage-gated calcium channel complex(GO:1990454) |
| 0.0 | 0.3 | GO:0005881 | cytoplasmic microtubule(GO:0005881) |
Gene overrepresentation in molecular_function category:
| Log-likelihood per target | Total log-likelihood | Term | Description |
|---|---|---|---|
| 0.4 | 1.7 | GO:0008970 | phosphatidylcholine 1-acylhydrolase activity(GO:0008970) |
| 0.4 | 1.1 | GO:0035373 | chondroitin sulfate proteoglycan binding(GO:0035373) |
| 0.3 | 5.9 | GO:0070016 | gamma-catenin binding(GO:0045295) armadillo repeat domain binding(GO:0070016) |
| 0.2 | 0.8 | GO:0005008 | hepatocyte growth factor-activated receptor activity(GO:0005008) |
| 0.2 | 0.6 | GO:0036468 | aromatic-L-amino-acid decarboxylase activity(GO:0004058) L-dopa decarboxylase activity(GO:0036468) |
| 0.1 | 1.6 | GO:0008430 | selenium binding(GO:0008430) |
| 0.1 | 0.4 | GO:0004568 | chitinase activity(GO:0004568) |
| 0.1 | 0.6 | GO:0033192 | calmodulin-dependent protein phosphatase activity(GO:0033192) |
| 0.1 | 1.1 | GO:0070181 | small ribosomal subunit rRNA binding(GO:0070181) |
| 0.1 | 0.7 | GO:0035727 | lysophosphatidic acid binding(GO:0035727) lysophosphatidic acid receptor activity(GO:0070915) |
| 0.1 | 0.3 | GO:0004704 | NF-kappaB-inducing kinase activity(GO:0004704) |
| 0.1 | 0.4 | GO:0004594 | pantothenate kinase activity(GO:0004594) |
| 0.1 | 0.2 | GO:0016434 | rRNA (cytosine) methyltransferase activity(GO:0016434) |
| 0.1 | 0.8 | GO:0008301 | DNA binding, bending(GO:0008301) |
| 0.1 | 0.4 | GO:0070095 | fructose-6-phosphate binding(GO:0070095) |
| 0.0 | 0.2 | GO:0004565 | beta-galactosidase activity(GO:0004565) |
| 0.0 | 0.9 | GO:0005003 | ephrin receptor activity(GO:0005003) |
| 0.0 | 0.2 | GO:0004322 | ferroxidase activity(GO:0004322) oxidoreductase activity, oxidizing metal ions, oxygen as acceptor(GO:0016724) |
| 0.0 | 0.4 | GO:0022848 | acetylcholine-gated cation channel activity(GO:0022848) |
| 0.0 | 0.1 | GO:0001639 | PLC activating G-protein coupled glutamate receptor activity(GO:0001639) A2A adenosine receptor binding(GO:0031687) G-protein coupled receptor activity involved in regulation of postsynaptic membrane potential(GO:0099530) |
| 0.0 | 0.2 | GO:0042296 | ISG15 transferase activity(GO:0042296) |
| 0.0 | 0.1 | GO:0005250 | A-type (transient outward) potassium channel activity(GO:0005250) |
| 0.0 | 0.3 | GO:0008191 | metalloendopeptidase inhibitor activity(GO:0008191) |
| 0.0 | 2.0 | GO:0005496 | steroid binding(GO:0005496) |
| 0.0 | 0.1 | GO:0004301 | epoxide hydrolase activity(GO:0004301) |
| 0.0 | 0.6 | GO:0008574 | ATP-dependent microtubule motor activity, plus-end-directed(GO:0008574) |
| 0.0 | 0.1 | GO:0051429 | corticotropin-releasing hormone receptor binding(GO:0051429) corticotropin-releasing hormone receptor 1 binding(GO:0051430) |
| 0.0 | 3.9 | GO:0003714 | transcription corepressor activity(GO:0003714) |
| 0.0 | 0.2 | GO:0031802 | type 5 metabotropic glutamate receptor binding(GO:0031802) |
| 0.0 | 0.1 | GO:0086007 | voltage-gated calcium channel activity involved in cardiac muscle cell action potential(GO:0086007) |
| 0.0 | 0.7 | GO:0008173 | RNA methyltransferase activity(GO:0008173) |
| 0.0 | 0.1 | GO:0004679 | AMP-activated protein kinase activity(GO:0004679) |
Gene overrepresentation in C2:CP category:
| Log-likelihood per target | Total log-likelihood | Term | Description |
|---|---|---|---|
| 0.1 | 3.2 | PID_IL12_STAT4_PATHWAY | IL12 signaling mediated by STAT4 |
| 0.1 | 5.9 | PID_AP1_PATHWAY | AP-1 transcription factor network |
| 0.1 | 1.1 | PID_SYNDECAN_3_PATHWAY | Syndecan-3-mediated signaling events |
| 0.0 | 0.7 | PID_LPA4_PATHWAY | LPA4-mediated signaling events |
| 0.0 | 0.9 | PID_EPHRINB_REV_PATHWAY | Ephrin B reverse signaling |
| 0.0 | 1.2 | PID_ECADHERIN_STABILIZATION_PATHWAY | Stabilization and expansion of the E-cadherin adherens junction |
| 0.0 | 0.5 | NABA_PROTEOGLYCANS | Genes encoding proteoglycans |
| 0.0 | 0.2 | PID_TCR_CALCIUM_PATHWAY | Calcium signaling in the CD4+ TCR pathway |
Gene overrepresentation in C2:CP:REACTOME category:
| Log-likelihood per target | Total log-likelihood | Term | Description |
|---|---|---|---|
| 0.1 | 4.0 | REACTOME_YAP1_AND_WWTR1_TAZ_STIMULATED_GENE_EXPRESSION | Genes involved in YAP1- and WWTR1 (TAZ)-stimulated gene expression |
| 0.1 | 0.1 | REACTOME_G_PROTEIN_ACTIVATION | Genes involved in G-protein activation |
| 0.1 | 0.7 | REACTOME_P2Y_RECEPTORS | Genes involved in P2Y receptors |
| 0.1 | 0.6 | REACTOME_AMINE_DERIVED_HORMONES | Genes involved in Amine-derived hormones |
| 0.0 | 0.4 | REACTOME_VITAMIN_B5_PANTOTHENATE_METABOLISM | Genes involved in Vitamin B5 (pantothenate) metabolism |
| 0.0 | 0.5 | REACTOME_MRNA_DECAY_BY_5_TO_3_EXORIBONUCLEASE | Genes involved in mRNA Decay by 5' to 3' Exoribonuclease |
| 0.0 | 1.1 | REACTOME_FORMATION_OF_THE_TERNARY_COMPLEX_AND_SUBSEQUENTLY_THE_43S_COMPLEX | Genes involved in Formation of the ternary complex, and subsequently, the 43S complex |
| 0.0 | 0.8 | REACTOME_SEMA4D_IN_SEMAPHORIN_SIGNALING | Genes involved in Sema4D in semaphorin signaling |
| 0.0 | 0.5 | REACTOME_KINESINS | Genes involved in Kinesins |
| 0.0 | 0.6 | REACTOME_DARPP_32_EVENTS | Genes involved in DARPP-32 events |
| 0.0 | 0.5 | REACTOME_LYSOSOME_VESICLE_BIOGENESIS | Genes involved in Lysosome Vesicle Biogenesis |
| 0.0 | 0.4 | REACTOME_GLUCONEOGENESIS | Genes involved in Gluconeogenesis |