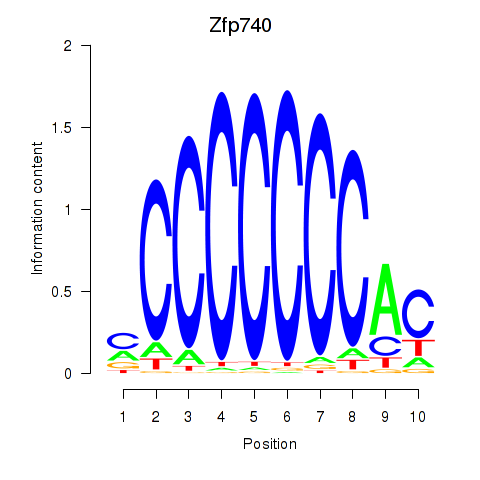
Motif ID: Zfp219_Zfp740
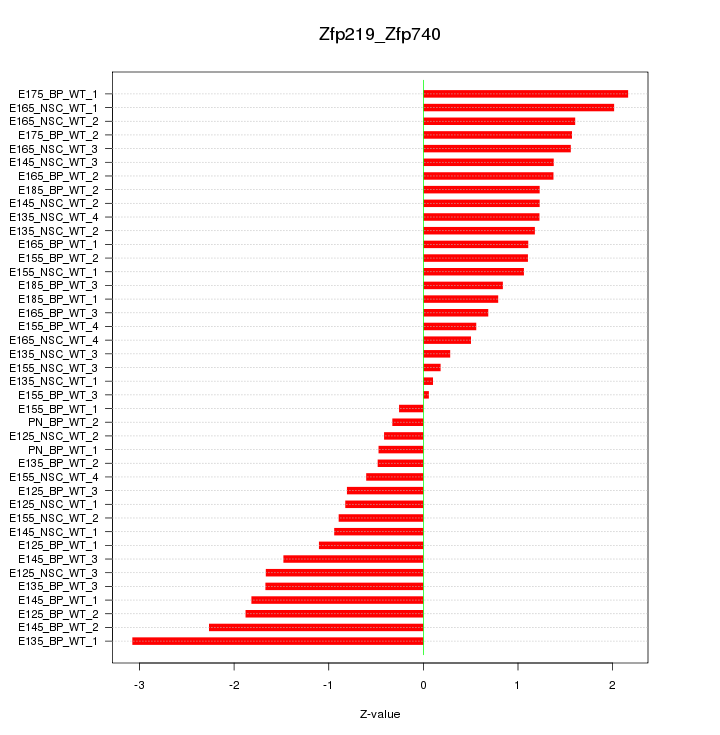
Z-value: 1.274

Transcription factors associated with Zfp219_Zfp740:
| Gene Symbol | Entrez ID | Gene Name |
|---|---|---|
| Zfp219 | ENSMUSG00000049295.10 | Zfp219 |
| Zfp740 | ENSMUSG00000046897.10 | Zfp740 |
Activity-expression correlation:
| Gene Symbol | Promoter | Pearson corr. coef. | P-value | Plot |
|---|---|---|---|---|
| Zfp740 | mm10_v2_chr15_+_102203639_102203709 | 0.41 | 7.7e-03 | Click! |
| Zfp219 | mm10_v2_chr14_-_52020698_52020737 | 0.40 | 8.9e-03 | Click! |

Top targets:
Gene overrepresentation in biological_process category:
| Log-likelihood per target | Total log-likelihood | Term | Description |
|---|---|---|---|
| 4.8 | 14.3 | GO:0048687 | positive regulation of sprouting of injured axon(GO:0048687) positive regulation of axon extension involved in regeneration(GO:0048691) |
| 3.0 | 11.9 | GO:1905167 | positive regulation of lysosomal protein catabolic process(GO:1905167) |
| 2.0 | 5.9 | GO:1904049 | negative regulation of spontaneous neurotransmitter secretion(GO:1904049) |
| 1.6 | 6.4 | GO:0060032 | notochord regression(GO:0060032) |
| 1.3 | 3.9 | GO:0060399 | positive regulation of growth hormone receptor signaling pathway(GO:0060399) |
| 1.2 | 6.2 | GO:0007256 | activation of JNKK activity(GO:0007256) |
| 1.2 | 4.9 | GO:2000525 | regulation of T cell costimulation(GO:2000523) positive regulation of T cell costimulation(GO:2000525) |
| 1.1 | 4.4 | GO:0043974 | histone H3-K27 acetylation(GO:0043974) regulation of histone H3-K27 acetylation(GO:1901674) |
| 1.1 | 3.2 | GO:0060023 | soft palate development(GO:0060023) |
| 1.0 | 6.1 | GO:1903056 | positive regulation of lens fiber cell differentiation(GO:1902748) regulation of melanosome organization(GO:1903056) |
| 1.0 | 4.9 | GO:1904936 | cerebral cortex GABAergic interneuron migration(GO:0021853) interneuron migration(GO:1904936) |
| 0.9 | 1.8 | GO:2000793 | cell proliferation involved in heart valve development(GO:2000793) |
| 0.9 | 0.9 | GO:1904048 | regulation of spontaneous neurotransmitter secretion(GO:1904048) |
| 0.8 | 13.4 | GO:0021902 | commitment of neuronal cell to specific neuron type in forebrain(GO:0021902) |
| 0.8 | 2.5 | GO:1900039 | positive regulation of cellular response to hypoxia(GO:1900039) |
| 0.8 | 2.5 | GO:0046881 | positive regulation of follicle-stimulating hormone secretion(GO:0046881) |
| 0.8 | 3.8 | GO:0060178 | regulation of exocyst localization(GO:0060178) |
| 0.7 | 5.5 | GO:0007406 | negative regulation of neuroblast proliferation(GO:0007406) |
| 0.6 | 0.6 | GO:0043585 | nose morphogenesis(GO:0043585) |
| 0.6 | 1.7 | GO:0035790 | platelet-derived growth factor receptor-alpha signaling pathway(GO:0035790) |
| 0.5 | 5.4 | GO:1902036 | regulation of hematopoietic stem cell differentiation(GO:1902036) |
| 0.5 | 2.2 | GO:0036091 | positive regulation of transcription from RNA polymerase II promoter in response to oxidative stress(GO:0036091) |
| 0.5 | 4.3 | GO:0090336 | positive regulation of brown fat cell differentiation(GO:0090336) |
| 0.5 | 1.6 | GO:0097402 | neuroblast migration(GO:0097402) |
| 0.5 | 2.0 | GO:0045358 | negative regulation of interferon-beta biosynthetic process(GO:0045358) |
| 0.5 | 5.5 | GO:0042572 | retinol metabolic process(GO:0042572) |
| 0.5 | 2.0 | GO:0052151 | positive regulation by symbiont of host apoptotic process(GO:0052151) positive regulation of apoptotic process by virus(GO:0060139) apoptotic process involved in embryonic digit morphogenesis(GO:1902263) |
| 0.5 | 4.9 | GO:0042118 | endothelial cell activation(GO:0042118) |
| 0.5 | 1.5 | GO:0032430 | inhibitory G-protein coupled receptor phosphorylation(GO:0002030) positive regulation of phospholipase A2 activity(GO:0032430) activation of meiosis involved in egg activation(GO:0060466) |
| 0.5 | 2.7 | GO:0042276 | error-prone translesion synthesis(GO:0042276) |
| 0.4 | 1.3 | GO:0021830 | interneuron migration from the subpallium to the cortex(GO:0021830) |
| 0.4 | 1.8 | GO:0044268 | multicellular organismal protein metabolic process(GO:0044268) |
| 0.4 | 1.7 | GO:0099566 | regulation of postsynaptic cytosolic calcium ion concentration(GO:0099566) |
| 0.4 | 2.1 | GO:0035405 | histone-threonine phosphorylation(GO:0035405) |
| 0.4 | 1.2 | GO:2001160 | regulation of histone H3-K79 methylation(GO:2001160) |
| 0.4 | 1.6 | GO:1904398 | positive regulation of neuromuscular junction development(GO:1904398) |
| 0.4 | 1.2 | GO:0015910 | peroxisomal long-chain fatty acid import(GO:0015910) |
| 0.4 | 3.7 | GO:0010745 | negative regulation of macrophage derived foam cell differentiation(GO:0010745) |
| 0.4 | 1.6 | GO:1903288 | positive regulation of potassium ion import(GO:1903288) |
| 0.4 | 0.8 | GO:2000078 | positive regulation of type B pancreatic cell development(GO:2000078) |
| 0.4 | 0.4 | GO:0045608 | inhibition of neuroepithelial cell differentiation(GO:0002085) negative regulation of auditory receptor cell differentiation(GO:0045608) |
| 0.4 | 3.1 | GO:0048149 | behavioral response to ethanol(GO:0048149) |
| 0.4 | 2.6 | GO:0035093 | spermatogenesis, exchange of chromosomal proteins(GO:0035093) |
| 0.4 | 3.8 | GO:0010571 | positive regulation of nuclear cell cycle DNA replication(GO:0010571) |
| 0.4 | 1.5 | GO:0003192 | mitral valve formation(GO:0003192) condensed mesenchymal cell proliferation(GO:0072137) |
| 0.4 | 2.2 | GO:2000672 | negative regulation of motor neuron apoptotic process(GO:2000672) |
| 0.3 | 3.8 | GO:1900113 | negative regulation of histone H3-K9 trimethylation(GO:1900113) |
| 0.3 | 0.7 | GO:0021759 | globus pallidus development(GO:0021759) |
| 0.3 | 5.5 | GO:1990403 | embryonic brain development(GO:1990403) |
| 0.3 | 1.0 | GO:0030827 | negative regulation of cGMP metabolic process(GO:0030824) negative regulation of cGMP biosynthetic process(GO:0030827) negative regulation of guanylate cyclase activity(GO:0031283) |
| 0.3 | 8.5 | GO:0010971 | positive regulation of G2/M transition of mitotic cell cycle(GO:0010971) |
| 0.3 | 1.0 | GO:0023016 | signal transduction by trans-phosphorylation(GO:0023016) |
| 0.3 | 2.2 | GO:0016480 | negative regulation of transcription from RNA polymerase III promoter(GO:0016480) |
| 0.3 | 0.9 | GO:0070602 | regulation of chondrocyte development(GO:0061181) regulation of centromeric sister chromatid cohesion(GO:0070602) |
| 0.3 | 0.9 | GO:0033088 | negative regulation of immature T cell proliferation in thymus(GO:0033088) |
| 0.3 | 1.2 | GO:0090472 | dibasic protein processing(GO:0090472) |
| 0.3 | 1.2 | GO:0051305 | chromosome movement towards spindle pole(GO:0051305) |
| 0.3 | 1.2 | GO:0021698 | cerebellar cortex structural organization(GO:0021698) |
| 0.3 | 1.5 | GO:0070345 | negative regulation of fat cell proliferation(GO:0070345) |
| 0.3 | 2.1 | GO:0070814 | hydrogen sulfide biosynthetic process(GO:0070814) |
| 0.3 | 2.4 | GO:0007158 | neuron cell-cell adhesion(GO:0007158) |
| 0.3 | 1.4 | GO:0014886 | transition between slow and fast fiber(GO:0014886) |
| 0.3 | 0.8 | GO:0070535 | histone H2A K63-linked ubiquitination(GO:0070535) negative regulation of protein K63-linked ubiquitination(GO:1900045) negative regulation of protein polyubiquitination(GO:1902915) |
| 0.3 | 1.1 | GO:0061010 | gall bladder development(GO:0061010) |
| 0.3 | 2.7 | GO:0002903 | negative regulation of B cell apoptotic process(GO:0002903) |
| 0.3 | 1.6 | GO:0072718 | response to cisplatin(GO:0072718) |
| 0.3 | 0.8 | GO:0021965 | spinal cord ventral commissure morphogenesis(GO:0021965) |
| 0.3 | 1.0 | GO:0070317 | negative regulation of G0 to G1 transition(GO:0070317) |
| 0.3 | 2.1 | GO:0072321 | chaperone-mediated protein transport(GO:0072321) |
| 0.2 | 1.7 | GO:0043569 | negative regulation of insulin-like growth factor receptor signaling pathway(GO:0043569) |
| 0.2 | 1.7 | GO:0030579 | ubiquitin-dependent SMAD protein catabolic process(GO:0030579) |
| 0.2 | 1.4 | GO:0006072 | glycerol-3-phosphate metabolic process(GO:0006072) |
| 0.2 | 1.9 | GO:0097118 | neuroligin clustering involved in postsynaptic membrane assembly(GO:0097118) |
| 0.2 | 1.2 | GO:1900170 | negative regulation of glucocorticoid mediated signaling pathway(GO:1900170) |
| 0.2 | 4.4 | GO:0061029 | eyelid development in camera-type eye(GO:0061029) |
| 0.2 | 1.6 | GO:0016584 | nucleosome positioning(GO:0016584) |
| 0.2 | 1.5 | GO:2001185 | regulation of CD8-positive, alpha-beta T cell activation(GO:2001185) |
| 0.2 | 1.9 | GO:0097154 | GABAergic neuron differentiation(GO:0097154) |
| 0.2 | 3.4 | GO:0007379 | segment specification(GO:0007379) |
| 0.2 | 0.6 | GO:1901491 | negative regulation of lymphangiogenesis(GO:1901491) |
| 0.2 | 0.6 | GO:2000297 | negative regulation of synapse maturation(GO:2000297) |
| 0.2 | 0.7 | GO:0035609 | C-terminal protein deglutamylation(GO:0035609) |
| 0.2 | 0.5 | GO:2000973 | regulation of pro-B cell differentiation(GO:2000973) |
| 0.2 | 0.5 | GO:0098928 | presynaptic signal transduction(GO:0098928) presynapse to nucleus signaling pathway(GO:0099526) |
| 0.2 | 0.8 | GO:0010961 | cellular magnesium ion homeostasis(GO:0010961) |
| 0.2 | 0.7 | GO:0097494 | regulation of vesicle size(GO:0097494) |
| 0.2 | 1.1 | GO:0033184 | positive regulation of histone ubiquitination(GO:0033184) |
| 0.2 | 1.2 | GO:0090219 | negative regulation of lipid kinase activity(GO:0090219) |
| 0.2 | 0.9 | GO:0036337 | Fas signaling pathway(GO:0036337) |
| 0.2 | 0.9 | GO:0000160 | phosphorelay signal transduction system(GO:0000160) |
| 0.2 | 3.2 | GO:0032967 | positive regulation of collagen biosynthetic process(GO:0032967) |
| 0.2 | 0.3 | GO:2001027 | negative regulation of antigen processing and presentation(GO:0002578) negative regulation of endothelial cell chemotaxis(GO:2001027) |
| 0.2 | 1.5 | GO:0071455 | cellular response to hyperoxia(GO:0071455) |
| 0.1 | 2.2 | GO:0033234 | negative regulation of protein sumoylation(GO:0033234) |
| 0.1 | 2.7 | GO:0050885 | neuromuscular process controlling balance(GO:0050885) |
| 0.1 | 1.4 | GO:0010459 | negative regulation of heart rate(GO:0010459) |
| 0.1 | 0.8 | GO:0097646 | dimeric G-protein coupled receptor signaling pathway(GO:0038042) calcitonin family receptor signaling pathway(GO:0097646) amylin receptor signaling pathway(GO:0097647) |
| 0.1 | 1.5 | GO:0032482 | Rab protein signal transduction(GO:0032482) |
| 0.1 | 2.2 | GO:0070935 | 3'-UTR-mediated mRNA stabilization(GO:0070935) |
| 0.1 | 0.4 | GO:0071579 | regulation of zinc ion transport(GO:0071579) |
| 0.1 | 1.3 | GO:1990118 | sodium ion import across plasma membrane(GO:0098719) sodium ion import into cell(GO:1990118) |
| 0.1 | 1.7 | GO:0000188 | inactivation of MAPK activity(GO:0000188) |
| 0.1 | 0.4 | GO:0035964 | COPI-coated vesicle budding(GO:0035964) |
| 0.1 | 0.6 | GO:0061669 | spontaneous neurotransmitter secretion(GO:0061669) spontaneous synaptic transmission(GO:0098814) |
| 0.1 | 0.5 | GO:0003430 | growth plate cartilage chondrocyte growth(GO:0003430) |
| 0.1 | 0.7 | GO:0042795 | snRNA transcription from RNA polymerase II promoter(GO:0042795) |
| 0.1 | 0.4 | GO:0015744 | succinate transport(GO:0015744) |
| 0.1 | 1.0 | GO:0070072 | vacuolar proton-transporting V-type ATPase complex assembly(GO:0070072) |
| 0.1 | 0.4 | GO:0097298 | regulation of nucleus size(GO:0097298) |
| 0.1 | 1.2 | GO:0055090 | acylglycerol homeostasis(GO:0055090) triglyceride homeostasis(GO:0070328) |
| 0.1 | 0.4 | GO:0033138 | positive regulation of peptidyl-serine phosphorylation(GO:0033138) |
| 0.1 | 1.9 | GO:0070816 | phosphorylation of RNA polymerase II C-terminal domain(GO:0070816) |
| 0.1 | 0.4 | GO:0006438 | valyl-tRNA aminoacylation(GO:0006438) |
| 0.1 | 3.6 | GO:0007520 | myoblast fusion(GO:0007520) |
| 0.1 | 0.8 | GO:0016576 | histone dephosphorylation(GO:0016576) |
| 0.1 | 2.3 | GO:1902043 | positive regulation of extrinsic apoptotic signaling pathway via death domain receptors(GO:1902043) |
| 0.1 | 0.9 | GO:0097091 | synaptic vesicle clustering(GO:0097091) |
| 0.1 | 2.0 | GO:0030033 | microvillus assembly(GO:0030033) |
| 0.1 | 1.1 | GO:0048934 | peripheral nervous system neuron differentiation(GO:0048934) peripheral nervous system neuron development(GO:0048935) |
| 0.1 | 0.6 | GO:0045078 | positive regulation of interferon-gamma biosynthetic process(GO:0045078) |
| 0.1 | 3.6 | GO:0048599 | oocyte development(GO:0048599) |
| 0.1 | 1.2 | GO:0046339 | diacylglycerol metabolic process(GO:0046339) |
| 0.1 | 1.5 | GO:0060736 | prostate gland growth(GO:0060736) |
| 0.1 | 3.3 | GO:0032728 | positive regulation of interferon-beta production(GO:0032728) |
| 0.1 | 0.8 | GO:0038203 | TORC2 signaling(GO:0038203) |
| 0.1 | 1.5 | GO:1902459 | positive regulation of stem cell population maintenance(GO:1902459) |
| 0.1 | 0.4 | GO:0045213 | neurotransmitter receptor metabolic process(GO:0045213) |
| 0.1 | 0.5 | GO:0060050 | positive regulation of protein glycosylation(GO:0060050) |
| 0.1 | 0.3 | GO:0006049 | UDP-N-acetylglucosamine catabolic process(GO:0006049) |
| 0.1 | 0.3 | GO:0019858 | cytosine metabolic process(GO:0019858) |
| 0.1 | 0.4 | GO:0016127 | cholesterol catabolic process(GO:0006707) sterol catabolic process(GO:0016127) |
| 0.1 | 0.4 | GO:0034372 | very-low-density lipoprotein particle remodeling(GO:0034372) |
| 0.1 | 3.8 | GO:0006284 | base-excision repair(GO:0006284) |
| 0.1 | 0.5 | GO:1900246 | positive regulation of RIG-I signaling pathway(GO:1900246) |
| 0.1 | 0.6 | GO:0071361 | cellular response to ethanol(GO:0071361) |
| 0.1 | 0.8 | GO:0000042 | protein targeting to Golgi(GO:0000042) |
| 0.1 | 0.4 | GO:2000623 | regulation of nuclear-transcribed mRNA catabolic process, nonsense-mediated decay(GO:2000622) negative regulation of nuclear-transcribed mRNA catabolic process, nonsense-mediated decay(GO:2000623) |
| 0.1 | 0.7 | GO:0099590 | neurotransmitter receptor internalization(GO:0099590) |
| 0.1 | 0.6 | GO:2000766 | negative regulation of cytoplasmic translation(GO:2000766) |
| 0.1 | 0.2 | GO:0090038 | negative regulation of protein kinase C signaling(GO:0090038) |
| 0.1 | 0.3 | GO:0006558 | L-phenylalanine metabolic process(GO:0006558) erythrose 4-phosphate/phosphoenolpyruvate family amino acid metabolic process(GO:1902221) |
| 0.1 | 3.8 | GO:0008542 | visual learning(GO:0008542) |
| 0.1 | 0.6 | GO:0036444 | calcium ion transmembrane import into mitochondrion(GO:0036444) |
| 0.1 | 1.1 | GO:0045663 | positive regulation of myoblast differentiation(GO:0045663) |
| 0.1 | 0.4 | GO:0034720 | histone H3-K4 demethylation(GO:0034720) |
| 0.1 | 0.8 | GO:2001197 | regulation of basement membrane assembly involved in embryonic body morphogenesis(GO:1904259) positive regulation of basement membrane assembly involved in embryonic body morphogenesis(GO:1904261) basement membrane assembly involved in embryonic body morphogenesis(GO:2001197) |
| 0.1 | 2.5 | GO:0001755 | neural crest cell migration(GO:0001755) |
| 0.1 | 0.5 | GO:0051611 | negative regulation of neurotransmitter uptake(GO:0051581) serotonin uptake(GO:0051610) regulation of serotonin uptake(GO:0051611) negative regulation of serotonin uptake(GO:0051612) |
| 0.1 | 0.6 | GO:2000507 | positive regulation of energy homeostasis(GO:2000507) |
| 0.1 | 0.5 | GO:0044027 | hypermethylation of CpG island(GO:0044027) |
| 0.1 | 2.2 | GO:0051491 | positive regulation of filopodium assembly(GO:0051491) |
| 0.1 | 6.6 | GO:0043149 | contractile actin filament bundle assembly(GO:0030038) stress fiber assembly(GO:0043149) |
| 0.1 | 3.4 | GO:0035019 | somatic stem cell population maintenance(GO:0035019) |
| 0.1 | 1.7 | GO:0071108 | protein K48-linked deubiquitination(GO:0071108) |
| 0.1 | 0.4 | GO:0070127 | tRNA aminoacylation for mitochondrial protein translation(GO:0070127) |
| 0.1 | 2.0 | GO:0015804 | neutral amino acid transport(GO:0015804) |
| 0.1 | 0.2 | GO:0060982 | coronary artery morphogenesis(GO:0060982) |
| 0.1 | 0.9 | GO:0000338 | protein deneddylation(GO:0000338) |
| 0.1 | 0.2 | GO:0086046 | membrane depolarization during SA node cell action potential(GO:0086046) |
| 0.1 | 0.3 | GO:0006701 | progesterone biosynthetic process(GO:0006701) |
| 0.1 | 0.4 | GO:0032876 | negative regulation of DNA endoreduplication(GO:0032876) |
| 0.1 | 0.4 | GO:0036506 | maintenance of unfolded protein(GO:0036506) tail-anchored membrane protein insertion into ER membrane(GO:0071816) maintenance of unfolded protein involved in ERAD pathway(GO:1904378) |
| 0.1 | 0.2 | GO:1990859 | cellular response to endothelin(GO:1990859) |
| 0.1 | 0.2 | GO:0010700 | negative regulation of norepinephrine secretion(GO:0010700) purinergic nucleotide receptor signaling pathway(GO:0035590) positive regulation of penile erection(GO:0060406) |
| 0.1 | 0.1 | GO:0060437 | lung growth(GO:0060437) |
| 0.1 | 0.6 | GO:0036037 | CD8-positive, alpha-beta T cell activation(GO:0036037) CD8-positive, alpha-beta T cell differentiation(GO:0043374) |
| 0.0 | 0.6 | GO:0043982 | histone H4-K5 acetylation(GO:0043981) histone H4-K8 acetylation(GO:0043982) |
| 0.0 | 0.1 | GO:0009994 | oocyte differentiation(GO:0009994) |
| 0.0 | 0.0 | GO:2000601 | positive regulation of Arp2/3 complex-mediated actin nucleation(GO:2000601) |
| 0.0 | 0.9 | GO:0010574 | regulation of vascular endothelial growth factor production(GO:0010574) |
| 0.0 | 0.8 | GO:0030213 | hyaluronan biosynthetic process(GO:0030213) |
| 0.0 | 0.8 | GO:0048305 | immunoglobulin secretion(GO:0048305) |
| 0.0 | 0.9 | GO:0007143 | female meiotic division(GO:0007143) |
| 0.0 | 0.9 | GO:0007064 | mitotic sister chromatid cohesion(GO:0007064) |
| 0.0 | 0.2 | GO:0002158 | osteoclast proliferation(GO:0002158) |
| 0.0 | 1.7 | GO:0046847 | filopodium assembly(GO:0046847) |
| 0.0 | 0.3 | GO:1903351 | response to dopamine(GO:1903350) cellular response to dopamine(GO:1903351) |
| 0.0 | 1.1 | GO:0010591 | regulation of lamellipodium assembly(GO:0010591) |
| 0.0 | 1.4 | GO:2001238 | positive regulation of extrinsic apoptotic signaling pathway(GO:2001238) |
| 0.0 | 0.2 | GO:0038030 | non-canonical Wnt signaling pathway via MAPK cascade(GO:0038030) non-canonical Wnt signaling pathway via JNK cascade(GO:0038031) |
| 0.0 | 2.4 | GO:0034333 | adherens junction assembly(GO:0034333) |
| 0.0 | 0.8 | GO:0000289 | nuclear-transcribed mRNA poly(A) tail shortening(GO:0000289) |
| 0.0 | 1.1 | GO:0061036 | positive regulation of cartilage development(GO:0061036) |
| 0.0 | 0.6 | GO:0048172 | regulation of short-term neuronal synaptic plasticity(GO:0048172) |
| 0.0 | 0.3 | GO:0030382 | sperm mitochondrion organization(GO:0030382) |
| 0.0 | 0.3 | GO:0035280 | miRNA loading onto RISC involved in gene silencing by miRNA(GO:0035280) |
| 0.0 | 0.3 | GO:0071578 | cadmium ion transport(GO:0015691) cadmium ion transmembrane transport(GO:0070574) zinc II ion transmembrane import(GO:0071578) |
| 0.0 | 0.2 | GO:0038028 | insulin receptor signaling pathway via phosphatidylinositol 3-kinase(GO:0038028) |
| 0.0 | 0.5 | GO:0031507 | heterochromatin assembly(GO:0031507) |
| 0.0 | 4.5 | GO:0007051 | spindle organization(GO:0007051) |
| 0.0 | 0.5 | GO:0015937 | coenzyme A biosynthetic process(GO:0015937) |
| 0.0 | 0.1 | GO:0001803 | type III hypersensitivity(GO:0001802) regulation of type III hypersensitivity(GO:0001803) positive regulation of type III hypersensitivity(GO:0001805) serotonin secretion by platelet(GO:0002554) positive regulation of mast cell cytokine production(GO:0032765) mast cell homeostasis(GO:0033023) mast cell apoptotic process(GO:0033024) regulation of mast cell apoptotic process(GO:0033025) |
| 0.0 | 1.0 | GO:0030514 | negative regulation of BMP signaling pathway(GO:0030514) |
| 0.0 | 0.9 | GO:0035065 | regulation of histone acetylation(GO:0035065) |
| 0.0 | 0.4 | GO:0070102 | interleukin-6-mediated signaling pathway(GO:0070102) |
| 0.0 | 0.2 | GO:0071802 | negative regulation of podosome assembly(GO:0071802) |
| 0.0 | 0.3 | GO:0007220 | Notch receptor processing(GO:0007220) |
| 0.0 | 0.6 | GO:0032011 | ARF protein signal transduction(GO:0032011) regulation of ARF protein signal transduction(GO:0032012) |
| 0.0 | 0.5 | GO:0035036 | binding of sperm to zona pellucida(GO:0007339) sperm-egg recognition(GO:0035036) |
| 0.0 | 0.9 | GO:0045773 | positive regulation of axon extension(GO:0045773) |
| 0.0 | 0.1 | GO:0060478 | acrosomal vesicle exocytosis(GO:0060478) |
| 0.0 | 0.3 | GO:0006353 | DNA-templated transcription, termination(GO:0006353) |
| 0.0 | 0.1 | GO:0015014 | heparan sulfate proteoglycan biosynthetic process, polysaccharide chain biosynthetic process(GO:0015014) |
| 0.0 | 0.2 | GO:0021819 | layer formation in cerebral cortex(GO:0021819) |
| 0.0 | 0.2 | GO:0046959 | habituation(GO:0046959) |
| 0.0 | 0.5 | GO:0095500 | acetylcholine receptor signaling pathway(GO:0095500) signal transduction involved in cellular response to ammonium ion(GO:1903831) response to acetylcholine(GO:1905144) cellular response to acetylcholine(GO:1905145) |
| 0.0 | 0.8 | GO:0007019 | microtubule depolymerization(GO:0007019) |
| 0.0 | 1.2 | GO:0045740 | positive regulation of DNA replication(GO:0045740) |
| 0.0 | 1.9 | GO:0008016 | regulation of heart contraction(GO:0008016) |
| 0.0 | 0.2 | GO:0032060 | bleb assembly(GO:0032060) |
| 0.0 | 0.1 | GO:0045607 | regulation of auditory receptor cell differentiation(GO:0045607) regulation of mechanoreceptor differentiation(GO:0045631) regulation of inner ear receptor cell differentiation(GO:2000980) |
| 0.0 | 0.3 | GO:0016973 | poly(A)+ mRNA export from nucleus(GO:0016973) |
| 0.0 | 0.7 | GO:0007229 | integrin-mediated signaling pathway(GO:0007229) |
| 0.0 | 0.7 | GO:0050775 | positive regulation of dendrite morphogenesis(GO:0050775) |
| 0.0 | 0.2 | GO:0051443 | positive regulation of ubiquitin-protein transferase activity(GO:0051443) |
| 0.0 | 0.2 | GO:0045600 | positive regulation of fat cell differentiation(GO:0045600) |
| 0.0 | 0.5 | GO:0006376 | mRNA splice site selection(GO:0006376) |
| 0.0 | 0.1 | GO:0070230 | positive regulation of lymphocyte apoptotic process(GO:0070230) |
| 0.0 | 0.2 | GO:0001516 | prostaglandin biosynthetic process(GO:0001516) prostanoid biosynthetic process(GO:0046457) |
| 0.0 | 0.2 | GO:0045717 | negative regulation of fatty acid biosynthetic process(GO:0045717) |
| 0.0 | 0.2 | GO:0002931 | response to ischemia(GO:0002931) |
| 0.0 | 0.2 | GO:0010800 | positive regulation of peptidyl-threonine phosphorylation(GO:0010800) |
| 0.0 | 1.7 | GO:0050714 | positive regulation of protein secretion(GO:0050714) |
| 0.0 | 0.2 | GO:0035493 | SNARE complex assembly(GO:0035493) |
| 0.0 | 0.0 | GO:0070562 | regulation of vitamin D receptor signaling pathway(GO:0070562) |
| 0.0 | 0.1 | GO:0035970 | peptidyl-threonine dephosphorylation(GO:0035970) |
| 0.0 | 0.1 | GO:2000114 | regulation of establishment of cell polarity(GO:2000114) |
| 0.0 | 0.1 | GO:0031100 | organ regeneration(GO:0031100) |
| 0.0 | 0.0 | GO:0071630 | nucleus-associated proteasomal ubiquitin-dependent protein catabolic process(GO:0071630) |
| 0.0 | 0.4 | GO:2000134 | negative regulation of G1/S transition of mitotic cell cycle(GO:2000134) |
| 0.0 | 0.0 | GO:0046416 | D-amino acid metabolic process(GO:0046416) |
| 0.0 | 0.2 | GO:0051310 | metaphase plate congression(GO:0051310) |
| 0.0 | 0.1 | GO:0006102 | isocitrate metabolic process(GO:0006102) |
| 0.0 | 0.3 | GO:0030970 | retrograde protein transport, ER to cytosol(GO:0030970) |
Gene overrepresentation in cellular_component category:
| Log-likelihood per target | Total log-likelihood | Term | Description |
|---|---|---|---|
| 2.6 | 7.7 | GO:0071953 | elastic fiber(GO:0071953) |
| 1.2 | 5.9 | GO:1990761 | growth cone lamellipodium(GO:1990761) |
| 1.1 | 3.4 | GO:0038045 | large latent transforming growth factor-beta complex(GO:0038045) |
| 0.9 | 3.6 | GO:0043259 | laminin-10 complex(GO:0043259) |
| 0.8 | 4.0 | GO:0044666 | MLL3/4 complex(GO:0044666) |
| 0.8 | 2.3 | GO:0030868 | smooth endoplasmic reticulum membrane(GO:0030868) smooth endoplasmic reticulum part(GO:0097425) |
| 0.7 | 2.2 | GO:0097058 | CRLF-CLCF1 complex(GO:0097058) |
| 0.6 | 1.9 | GO:0002944 | cyclin K-CDK12 complex(GO:0002944) |
| 0.6 | 2.5 | GO:0043511 | inhibin complex(GO:0043511) |
| 0.5 | 6.4 | GO:0097542 | ciliary tip(GO:0097542) |
| 0.5 | 2.7 | GO:0016035 | zeta DNA polymerase complex(GO:0016035) |
| 0.4 | 2.5 | GO:0044305 | calyx of Held(GO:0044305) |
| 0.3 | 5.4 | GO:0048188 | Set1C/COMPASS complex(GO:0048188) |
| 0.3 | 1.2 | GO:1990421 | subtelomeric heterochromatin(GO:1990421) nuclear subtelomeric heterochromatin(GO:1990707) |
| 0.3 | 7.0 | GO:0016581 | NuRD complex(GO:0016581) CHD-type complex(GO:0090545) |
| 0.3 | 1.4 | GO:0009331 | glycerol-3-phosphate dehydrogenase complex(GO:0009331) |
| 0.3 | 1.2 | GO:1990590 | ATF1-ATF4 transcription factor complex(GO:1990590) |
| 0.3 | 1.1 | GO:0042567 | insulin-like growth factor ternary complex(GO:0042567) |
| 0.2 | 3.8 | GO:0005721 | pericentric heterochromatin(GO:0005721) |
| 0.2 | 1.6 | GO:0005890 | sodium:potassium-exchanging ATPase complex(GO:0005890) |
| 0.2 | 0.7 | GO:0034679 | integrin alpha9-beta1 complex(GO:0034679) |
| 0.2 | 1.9 | GO:0036056 | filtration diaphragm(GO:0036056) slit diaphragm(GO:0036057) |
| 0.2 | 1.3 | GO:0070776 | H3 histone acetyltransferase complex(GO:0070775) MOZ/MORF histone acetyltransferase complex(GO:0070776) |
| 0.2 | 4.1 | GO:0010369 | chromocenter(GO:0010369) |
| 0.2 | 2.7 | GO:0043083 | synaptic cleft(GO:0043083) |
| 0.2 | 2.8 | GO:0031011 | Ino80 complex(GO:0031011) |
| 0.2 | 1.7 | GO:0044294 | dendritic growth cone(GO:0044294) |
| 0.2 | 3.6 | GO:0005665 | DNA-directed RNA polymerase II, core complex(GO:0005665) |
| 0.2 | 2.3 | GO:0000940 | condensed chromosome outer kinetochore(GO:0000940) |
| 0.2 | 13.6 | GO:0000118 | histone deacetylase complex(GO:0000118) |
| 0.2 | 0.5 | GO:1990257 | piccolo-bassoon transport vesicle(GO:1990257) |
| 0.2 | 0.8 | GO:1903440 | calcitonin family receptor complex(GO:1903439) amylin receptor complex(GO:1903440) |
| 0.2 | 4.1 | GO:0071339 | MLL1/2 complex(GO:0044665) MLL1 complex(GO:0071339) |
| 0.2 | 14.5 | GO:0005905 | clathrin-coated pit(GO:0005905) |
| 0.2 | 1.2 | GO:0012510 | trans-Golgi network transport vesicle membrane(GO:0012510) |
| 0.2 | 1.7 | GO:0097136 | Bcl-2 family protein complex(GO:0097136) |
| 0.2 | 0.3 | GO:0005577 | fibrinogen complex(GO:0005577) |
| 0.1 | 1.0 | GO:0044327 | dendritic spine head(GO:0044327) |
| 0.1 | 0.7 | GO:0000839 | Hrd1p ubiquitin ligase ERAD-L complex(GO:0000839) |
| 0.1 | 1.3 | GO:0016593 | Cdc73/Paf1 complex(GO:0016593) |
| 0.1 | 5.5 | GO:0035869 | ciliary transition zone(GO:0035869) |
| 0.1 | 1.4 | GO:0005916 | fascia adherens(GO:0005916) |
| 0.1 | 0.6 | GO:1990246 | uniplex complex(GO:1990246) |
| 0.1 | 0.8 | GO:0032584 | growth cone membrane(GO:0032584) |
| 0.1 | 3.6 | GO:0008023 | transcription elongation factor complex(GO:0008023) |
| 0.1 | 5.4 | GO:0017053 | transcriptional repressor complex(GO:0017053) |
| 0.1 | 1.2 | GO:0031235 | intrinsic component of the cytoplasmic side of the plasma membrane(GO:0031235) |
| 0.1 | 5.0 | GO:0009925 | basal plasma membrane(GO:0009925) |
| 0.1 | 2.8 | GO:0055038 | recycling endosome membrane(GO:0055038) |
| 0.1 | 0.6 | GO:0070765 | gamma-secretase complex(GO:0070765) |
| 0.1 | 8.3 | GO:0055037 | recycling endosome(GO:0055037) |
| 0.1 | 0.6 | GO:0016281 | eukaryotic translation initiation factor 4F complex(GO:0016281) |
| 0.1 | 0.8 | GO:0061700 | GATOR2 complex(GO:0061700) |
| 0.1 | 10.2 | GO:0090575 | RNA polymerase II transcription factor complex(GO:0090575) |
| 0.1 | 0.4 | GO:0071818 | BAT3 complex(GO:0071818) ER membrane insertion complex(GO:0072379) |
| 0.1 | 0.7 | GO:0005662 | DNA replication factor A complex(GO:0005662) |
| 0.1 | 1.9 | GO:0016592 | mediator complex(GO:0016592) |
| 0.1 | 1.2 | GO:0000159 | protein phosphatase type 2A complex(GO:0000159) |
| 0.1 | 0.8 | GO:0045180 | basal cortex(GO:0045180) |
| 0.1 | 1.2 | GO:0005942 | phosphatidylinositol 3-kinase complex(GO:0005942) |
| 0.0 | 0.7 | GO:0097539 | ciliary transition fiber(GO:0097539) |
| 0.0 | 1.4 | GO:0051233 | spindle midzone(GO:0051233) |
| 0.0 | 3.5 | GO:0031225 | anchored component of membrane(GO:0031225) |
| 0.0 | 0.7 | GO:0042405 | nuclear inclusion body(GO:0042405) |
| 0.0 | 0.5 | GO:0005677 | chromatin silencing complex(GO:0005677) |
| 0.0 | 1.2 | GO:0005779 | integral component of peroxisomal membrane(GO:0005779) |
| 0.0 | 0.5 | GO:0002199 | zona pellucida receptor complex(GO:0002199) |
| 0.0 | 5.1 | GO:0032993 | protein-DNA complex(GO:0032993) |
| 0.0 | 0.4 | GO:0005605 | basal lamina(GO:0005605) |
| 0.0 | 0.4 | GO:0035068 | micro-ribonucleoprotein complex(GO:0035068) |
| 0.0 | 0.8 | GO:0060077 | inhibitory synapse(GO:0060077) |
| 0.0 | 0.2 | GO:0031501 | mannosyltransferase complex(GO:0031501) |
| 0.0 | 0.3 | GO:0000346 | transcription export complex(GO:0000346) |
| 0.0 | 1.3 | GO:0030673 | axolemma(GO:0030673) |
| 0.0 | 0.5 | GO:0097440 | apical dendrite(GO:0097440) |
| 0.0 | 0.3 | GO:0035327 | transcriptionally active chromatin(GO:0035327) |
| 0.0 | 0.8 | GO:0030137 | COPI-coated vesicle(GO:0030137) |
| 0.0 | 0.6 | GO:0098827 | endoplasmic reticulum tubular network(GO:0071782) endoplasmic reticulum subcompartment(GO:0098827) |
| 0.0 | 0.3 | GO:0030119 | AP-type membrane coat adaptor complex(GO:0030119) |
| 0.0 | 0.1 | GO:0005784 | Sec61 translocon complex(GO:0005784) translocon complex(GO:0071256) |
| 0.0 | 1.8 | GO:0005844 | polysome(GO:0005844) |
| 0.0 | 2.1 | GO:0016528 | sarcoplasm(GO:0016528) |
| 0.0 | 0.4 | GO:0044232 | organelle membrane contact site(GO:0044232) |
| 0.0 | 1.6 | GO:0031526 | brush border membrane(GO:0031526) |
| 0.0 | 0.2 | GO:1990909 | Wnt signalosome(GO:1990909) |
| 0.0 | 0.5 | GO:0035102 | PRC1 complex(GO:0035102) |
| 0.0 | 0.5 | GO:0071004 | U2-type prespliceosome(GO:0071004) |
| 0.0 | 0.9 | GO:0031941 | filamentous actin(GO:0031941) |
| 0.0 | 0.3 | GO:0017146 | NMDA selective glutamate receptor complex(GO:0017146) |
| 0.0 | 0.7 | GO:0046658 | anchored component of plasma membrane(GO:0046658) |
| 0.0 | 0.4 | GO:0034364 | high-density lipoprotein particle(GO:0034364) |
| 0.0 | 4.7 | GO:0009897 | external side of plasma membrane(GO:0009897) |
| 0.0 | 0.9 | GO:0008180 | COP9 signalosome(GO:0008180) |
| 0.0 | 0.3 | GO:0005614 | interstitial matrix(GO:0005614) |
| 0.0 | 0.3 | GO:0031143 | pseudopodium(GO:0031143) |
| 0.0 | 0.8 | GO:0000307 | cyclin-dependent protein kinase holoenzyme complex(GO:0000307) |
| 0.0 | 2.4 | GO:0044306 | neuron projection terminus(GO:0044306) |
| 0.0 | 0.3 | GO:0005686 | U2 snRNP(GO:0005686) |
| 0.0 | 0.6 | GO:0000407 | pre-autophagosomal structure(GO:0000407) |
| 0.0 | 0.9 | GO:0031201 | SNARE complex(GO:0031201) |
| 0.0 | 0.8 | GO:0030173 | integral component of Golgi membrane(GO:0030173) |
| 0.0 | 1.4 | GO:0005814 | centriole(GO:0005814) |
| 0.0 | 0.2 | GO:0005641 | nuclear envelope lumen(GO:0005641) |
| 0.0 | 0.4 | GO:0030118 | clathrin coat(GO:0030118) |
| 0.0 | 0.4 | GO:0000795 | synaptonemal complex(GO:0000795) |
| 0.0 | 9.5 | GO:0016604 | nuclear body(GO:0016604) |
| 0.0 | 3.0 | GO:0043235 | receptor complex(GO:0043235) |
| 0.0 | 0.4 | GO:0030315 | T-tubule(GO:0030315) |
| 0.0 | 0.1 | GO:0030015 | CCR4-NOT core complex(GO:0030015) |
Gene overrepresentation in molecular_function category:
| Log-likelihood per target | Total log-likelihood | Term | Description |
|---|---|---|---|
| 4.0 | 11.9 | GO:0016964 | alpha-2 macroglobulin receptor activity(GO:0016964) |
| 2.9 | 14.3 | GO:0005030 | neurotrophin receptor activity(GO:0005030) |
| 1.2 | 4.9 | GO:0001011 | transcription factor activity, sequence-specific DNA binding, RNA polymerase recruiting(GO:0001011) transcription factor activity, TFIIB-class binding(GO:0001087) |
| 1.1 | 5.4 | GO:1990188 | euchromatin binding(GO:1990188) |
| 0.8 | 3.4 | GO:0050436 | microfibril binding(GO:0050436) |
| 0.8 | 5.5 | GO:0052650 | NADP-retinol dehydrogenase activity(GO:0052650) |
| 0.8 | 4.5 | GO:0045322 | unmethylated CpG binding(GO:0045322) |
| 0.7 | 2.6 | GO:0061628 | H3K27me3 modified histone binding(GO:0061628) |
| 0.6 | 1.8 | GO:0003989 | acetyl-CoA carboxylase activity(GO:0003989) |
| 0.6 | 2.3 | GO:0072320 | volume-sensitive chloride channel activity(GO:0072320) |
| 0.6 | 4.5 | GO:0001162 | RNA polymerase II intronic transcription regulatory region sequence-specific DNA binding(GO:0001162) |
| 0.5 | 2.0 | GO:0001093 | TFIIB-class transcription factor binding(GO:0001093) |
| 0.5 | 1.4 | GO:0016901 | glycerol-3-phosphate dehydrogenase activity(GO:0004368) oxidoreductase activity, acting on the CH-OH group of donors, quinone or similar compound as acceptor(GO:0016901) |
| 0.5 | 1.9 | GO:0032422 | purine-rich negative regulatory element binding(GO:0032422) |
| 0.4 | 6.2 | GO:0008349 | MAP kinase kinase kinase kinase activity(GO:0008349) |
| 0.4 | 2.6 | GO:0001069 | regulatory region RNA binding(GO:0001069) |
| 0.4 | 4.1 | GO:0019870 | potassium channel inhibitor activity(GO:0019870) |
| 0.4 | 1.1 | GO:0071936 | coreceptor activity involved in Wnt signaling pathway(GO:0071936) |
| 0.4 | 2.1 | GO:0035184 | histone threonine kinase activity(GO:0035184) |
| 0.3 | 2.1 | GO:0097001 | ceramide binding(GO:0097001) |
| 0.3 | 1.7 | GO:0038085 | vascular endothelial growth factor binding(GO:0038085) |
| 0.3 | 4.1 | GO:0042800 | histone methyltransferase activity (H3-K4 specific)(GO:0042800) |
| 0.3 | 2.2 | GO:0005127 | ciliary neurotrophic factor receptor binding(GO:0005127) |
| 0.3 | 0.9 | GO:0001042 | RNA polymerase I core binding(GO:0001042) |
| 0.3 | 2.4 | GO:0035374 | chondroitin sulfate binding(GO:0035374) |
| 0.3 | 1.8 | GO:0070699 | type II activin receptor binding(GO:0070699) |
| 0.3 | 1.2 | GO:0038049 | glucocorticoid receptor activity(GO:0004883) transcription factor activity, ligand-activated RNA polymerase II transcription factor binding(GO:0038049) glucocorticoid-activated RNA polymerase II transcription factor binding transcription factor activity(GO:0038051) |
| 0.3 | 2.3 | GO:0070087 | chromo shadow domain binding(GO:0070087) |
| 0.3 | 4.9 | GO:0005003 | ephrin receptor activity(GO:0005003) |
| 0.3 | 2.3 | GO:0099529 | neurotransmitter receptor activity involved in regulation of postsynaptic membrane potential(GO:0099529) |
| 0.3 | 5.2 | GO:0032454 | histone demethylase activity (H3-K9 specific)(GO:0032454) |
| 0.3 | 1.8 | GO:0098821 | BMP receptor activity(GO:0098821) |
| 0.3 | 1.0 | GO:0008802 | betaine-aldehyde dehydrogenase activity(GO:0008802) |
| 0.2 | 2.0 | GO:0019534 | toxin transporter activity(GO:0019534) |
| 0.2 | 1.2 | GO:0005324 | long-chain fatty acid transporter activity(GO:0005324) |
| 0.2 | 0.9 | GO:0043125 | ErbB-3 class receptor binding(GO:0043125) |
| 0.2 | 2.8 | GO:0045294 | alpha-catenin binding(GO:0045294) |
| 0.2 | 0.8 | GO:0048495 | Roundabout binding(GO:0048495) |
| 0.2 | 7.4 | GO:0005201 | extracellular matrix structural constituent(GO:0005201) |
| 0.2 | 4.3 | GO:0043395 | heparan sulfate proteoglycan binding(GO:0043395) |
| 0.2 | 1.6 | GO:0008556 | sodium:potassium-exchanging ATPase activity(GO:0005391) potassium-transporting ATPase activity(GO:0008556) |
| 0.2 | 0.7 | GO:0001161 | intronic transcription regulatory region sequence-specific DNA binding(GO:0001161) |
| 0.2 | 1.4 | GO:0008429 | phosphatidylethanolamine binding(GO:0008429) |
| 0.2 | 6.6 | GO:0070412 | R-SMAD binding(GO:0070412) |
| 0.2 | 0.8 | GO:0097643 | amylin receptor activity(GO:0097643) |
| 0.2 | 1.5 | GO:0008420 | CTD phosphatase activity(GO:0008420) |
| 0.2 | 1.1 | GO:0032184 | SUMO polymer binding(GO:0032184) |
| 0.2 | 1.3 | GO:0015386 | potassium:proton antiporter activity(GO:0015386) |
| 0.2 | 0.9 | GO:0046404 | ATP-dependent polydeoxyribonucleotide 5'-hydroxyl-kinase activity(GO:0046404) polydeoxyribonucleotide kinase activity(GO:0051733) ATP-dependent polynucleotide kinase activity(GO:0051734) |
| 0.2 | 0.9 | GO:0000155 | phosphorelay sensor kinase activity(GO:0000155) |
| 0.2 | 0.9 | GO:0005173 | stem cell factor receptor binding(GO:0005173) |
| 0.2 | 0.3 | GO:0070052 | collagen V binding(GO:0070052) |
| 0.1 | 0.4 | GO:0017153 | sodium:dicarboxylate symporter activity(GO:0017153) |
| 0.1 | 1.3 | GO:0039706 | co-receptor binding(GO:0039706) |
| 0.1 | 1.5 | GO:0001055 | RNA polymerase II activity(GO:0001055) |
| 0.1 | 4.1 | GO:0008157 | protein phosphatase 1 binding(GO:0008157) |
| 0.1 | 0.8 | GO:0005042 | netrin receptor activity(GO:0005042) |
| 0.1 | 1.2 | GO:0048406 | nerve growth factor binding(GO:0048406) |
| 0.1 | 1.3 | GO:0045499 | chemorepellent activity(GO:0045499) |
| 0.1 | 2.9 | GO:0008266 | poly(U) RNA binding(GO:0008266) |
| 0.1 | 0.5 | GO:0008142 | oxysterol binding(GO:0008142) |
| 0.1 | 0.9 | GO:0070411 | I-SMAD binding(GO:0070411) |
| 0.1 | 1.2 | GO:0001727 | lipid kinase activity(GO:0001727) |
| 0.1 | 0.4 | GO:0004104 | cholinesterase activity(GO:0004104) choline binding(GO:0033265) |
| 0.1 | 0.5 | GO:0042030 | ATPase inhibitor activity(GO:0042030) |
| 0.1 | 0.5 | GO:0038132 | neuregulin binding(GO:0038132) |
| 0.1 | 0.6 | GO:0008321 | Ral guanyl-nucleotide exchange factor activity(GO:0008321) |
| 0.1 | 0.4 | GO:0004832 | valine-tRNA ligase activity(GO:0004832) |
| 0.1 | 0.3 | GO:0010698 | acetyltransferase activator activity(GO:0010698) |
| 0.1 | 9.0 | GO:0001012 | RNA polymerase II regulatory region sequence-specific DNA binding(GO:0000977) RNA polymerase II regulatory region DNA binding(GO:0001012) |
| 0.1 | 0.6 | GO:0035033 | histone deacetylase regulator activity(GO:0035033) |
| 0.1 | 2.1 | GO:0008353 | RNA polymerase II carboxy-terminal domain kinase activity(GO:0008353) |
| 0.1 | 2.5 | GO:0046332 | SMAD binding(GO:0046332) |
| 0.1 | 3.1 | GO:0005160 | transforming growth factor beta receptor binding(GO:0005160) |
| 0.1 | 0.6 | GO:0043995 | histone acetyltransferase activity (H4-K5 specific)(GO:0043995) histone acetyltransferase activity (H4-K8 specific)(GO:0043996) histone acetyltransferase activity (H4-K16 specific)(GO:0046972) |
| 0.1 | 0.5 | GO:0004594 | pantothenate kinase activity(GO:0004594) |
| 0.1 | 2.1 | GO:0070577 | lysine-acetylated histone binding(GO:0070577) |
| 0.1 | 0.5 | GO:0004169 | dolichyl-phosphate-mannose-protein mannosyltransferase activity(GO:0004169) |
| 0.1 | 0.3 | GO:0003827 | alpha-1,3-mannosylglycoprotein 2-beta-N-acetylglucosaminyltransferase activity(GO:0003827) |
| 0.1 | 4.5 | GO:0001221 | transcription cofactor binding(GO:0001221) |
| 0.1 | 2.4 | GO:0019789 | SUMO transferase activity(GO:0019789) |
| 0.1 | 2.1 | GO:0071837 | HMG box domain binding(GO:0071837) |
| 0.1 | 0.3 | GO:0034647 | histone demethylase activity (H3-trimethyl-K4 specific)(GO:0034647) histone demethylase activity (H3-dimethyl-K4 specific)(GO:0034648) |
| 0.1 | 0.4 | GO:0050265 | RNA uridylyltransferase activity(GO:0050265) |
| 0.1 | 0.5 | GO:0003886 | DNA (cytosine-5-)-methyltransferase activity(GO:0003886) |
| 0.1 | 0.4 | GO:0019784 | NEDD8-specific protease activity(GO:0019784) |
| 0.1 | 0.3 | GO:0003836 | beta-galactoside (CMP) alpha-2,3-sialyltransferase activity(GO:0003836) |
| 0.1 | 1.6 | GO:0008327 | methyl-CpG binding(GO:0008327) |
| 0.1 | 0.3 | GO:0004741 | [pyruvate dehydrogenase (lipoamide)] phosphatase activity(GO:0004741) |
| 0.1 | 0.4 | GO:0034186 | apolipoprotein A-I binding(GO:0034186) |
| 0.1 | 0.2 | GO:0031686 | A1 adenosine receptor binding(GO:0031686) |
| 0.1 | 6.0 | GO:0008013 | beta-catenin binding(GO:0008013) |
| 0.1 | 2.4 | GO:0004693 | cyclin-dependent protein serine/threonine kinase activity(GO:0004693) |
| 0.1 | 2.9 | GO:0005158 | insulin receptor binding(GO:0005158) |
| 0.1 | 6.2 | GO:0003705 | transcription factor activity, RNA polymerase II distal enhancer sequence-specific binding(GO:0003705) |
| 0.1 | 1.4 | GO:0030506 | ankyrin binding(GO:0030506) |
| 0.1 | 2.8 | GO:0003678 | DNA helicase activity(GO:0003678) |
| 0.1 | 1.4 | GO:0005164 | tumor necrosis factor receptor binding(GO:0005164) |
| 0.1 | 1.2 | GO:0070840 | dynein complex binding(GO:0070840) |
| 0.1 | 0.1 | GO:0032453 | histone demethylase activity (H3-K4 specific)(GO:0032453) |
| 0.1 | 0.5 | GO:0030550 | acetylcholine receptor inhibitor activity(GO:0030550) |
| 0.1 | 1.0 | GO:0043274 | phospholipase binding(GO:0043274) |
| 0.0 | 2.6 | GO:0004402 | histone acetyltransferase activity(GO:0004402) |
| 0.0 | 0.8 | GO:0015491 | cation:cation antiporter activity(GO:0015491) |
| 0.0 | 0.6 | GO:0019855 | calcium channel inhibitor activity(GO:0019855) |
| 0.0 | 1.1 | GO:0001968 | fibronectin binding(GO:0001968) |
| 0.0 | 0.2 | GO:0008332 | low voltage-gated calcium channel activity(GO:0008332) |
| 0.0 | 1.2 | GO:0008139 | nuclear localization sequence binding(GO:0008139) |
| 0.0 | 0.2 | GO:0004667 | prostaglandin-D synthase activity(GO:0004667) prostaglandin-E synthase activity(GO:0050220) |
| 0.0 | 0.6 | GO:0042975 | peroxisome proliferator activated receptor binding(GO:0042975) |
| 0.0 | 0.7 | GO:0004181 | metallocarboxypeptidase activity(GO:0004181) |
| 0.0 | 0.7 | GO:0033549 | MAP kinase phosphatase activity(GO:0033549) |
| 0.0 | 0.2 | GO:0071532 | ankyrin repeat binding(GO:0071532) |
| 0.0 | 0.6 | GO:0005035 | tumor necrosis factor-activated receptor activity(GO:0005031) death receptor activity(GO:0005035) |
| 0.0 | 0.5 | GO:0019104 | DNA-(apurinic or apyrimidinic site) lyase activity(GO:0003906) DNA N-glycosylase activity(GO:0019104) |
| 0.0 | 0.2 | GO:0016941 | natriuretic peptide receptor activity(GO:0016941) |
| 0.0 | 0.6 | GO:0015269 | calcium-activated potassium channel activity(GO:0015269) |
| 0.0 | 0.5 | GO:0005247 | voltage-gated chloride channel activity(GO:0005247) |
| 0.0 | 1.4 | GO:0004867 | serine-type endopeptidase inhibitor activity(GO:0004867) |
| 0.0 | 1.7 | GO:0005179 | hormone activity(GO:0005179) |
| 0.0 | 0.5 | GO:0008510 | sodium:bicarbonate symporter activity(GO:0008510) |
| 0.0 | 8.2 | GO:0001077 | transcriptional activator activity, RNA polymerase II core promoter proximal region sequence-specific binding(GO:0001077) |
| 0.0 | 0.2 | GO:0031821 | G-protein coupled serotonin receptor binding(GO:0031821) |
| 0.0 | 0.5 | GO:0046965 | retinoid X receptor binding(GO:0046965) |
| 0.0 | 0.7 | GO:0001103 | RNA polymerase II repressing transcription factor binding(GO:0001103) |
| 0.0 | 1.3 | GO:0051019 | mitogen-activated protein kinase binding(GO:0051019) |
| 0.0 | 0.5 | GO:0070530 | K63-linked polyubiquitin binding(GO:0070530) |
| 0.0 | 2.8 | GO:0036459 | thiol-dependent ubiquitinyl hydrolase activity(GO:0036459) ubiquitinyl hydrolase activity(GO:0101005) |
| 0.0 | 0.3 | GO:0017166 | vinculin binding(GO:0017166) |
| 0.0 | 0.4 | GO:0070628 | proteasome binding(GO:0070628) |
| 0.0 | 0.1 | GO:0004449 | isocitrate dehydrogenase (NAD+) activity(GO:0004449) |
| 0.0 | 1.1 | GO:0005484 | SNAP receptor activity(GO:0005484) |
| 0.0 | 0.1 | GO:0005118 | sevenless binding(GO:0005118) |
| 0.0 | 0.1 | GO:0047184 | 1-acylglycerophosphocholine O-acyltransferase activity(GO:0047184) |
| 0.0 | 0.2 | GO:0005049 | nuclear export signal receptor activity(GO:0005049) |
| 0.0 | 0.1 | GO:0019863 | IgE binding(GO:0019863) |
| 0.0 | 0.6 | GO:0005086 | ARF guanyl-nucleotide exchange factor activity(GO:0005086) |
| 0.0 | 0.1 | GO:0016309 | 1-phosphatidylinositol-5-phosphate 4-kinase activity(GO:0016309) |
| 0.0 | 0.4 | GO:0046966 | thyroid hormone receptor binding(GO:0046966) |
| 0.0 | 2.6 | GO:0004713 | protein tyrosine kinase activity(GO:0004713) |
| 0.0 | 0.2 | GO:0005243 | gap junction channel activity(GO:0005243) |
| 0.0 | 1.2 | GO:0019888 | protein phosphatase regulator activity(GO:0019888) |
| 0.0 | 1.4 | GO:0043130 | ubiquitin binding(GO:0043130) |
| 0.0 | 0.4 | GO:0016709 | oxidoreductase activity, acting on paired donors, with incorporation or reduction of molecular oxygen, NAD(P)H as one donor, and incorporation of one atom of oxygen(GO:0016709) |
| 0.0 | 0.7 | GO:0031624 | ubiquitin conjugating enzyme binding(GO:0031624) |
| 0.0 | 0.4 | GO:0030371 | translation repressor activity(GO:0030371) |
| 0.0 | 0.3 | GO:0017127 | cholesterol transporter activity(GO:0017127) |
| 0.0 | 0.2 | GO:0042826 | histone deacetylase binding(GO:0042826) |
| 0.0 | 0.3 | GO:0005385 | zinc ion transmembrane transporter activity(GO:0005385) |
| 0.0 | 0.5 | GO:0032934 | cholesterol binding(GO:0015485) sterol binding(GO:0032934) |
| 0.0 | 0.0 | GO:0036361 | racemase and epimerase activity, acting on amino acids and derivatives(GO:0016855) racemase activity, acting on amino acids and derivatives(GO:0036361) amino-acid racemase activity(GO:0047661) |
| 0.0 | 0.9 | GO:0005178 | integrin binding(GO:0005178) |
| 0.0 | 0.2 | GO:0000030 | mannosyltransferase activity(GO:0000030) |
Gene overrepresentation in C2:CP category:
| Log-likelihood per target | Total log-likelihood | Term | Description |
|---|---|---|---|
| 0.5 | 4.1 | PID_INTEGRIN4_PATHWAY | Alpha6 beta4 integrin-ligand interactions |
| 0.3 | 11.5 | PID_UPA_UPAR_PATHWAY | Urokinase-type plasminogen activator (uPA) and uPAR-mediated signaling |
| 0.2 | 2.6 | PID_TCR_JNK_PATHWAY | JNK signaling in the CD4+ TCR pathway |
| 0.2 | 2.2 | ST_JAK_STAT_PATHWAY | Jak-STAT Pathway |
| 0.2 | 13.4 | PID_SHP2_PATHWAY | SHP2 signaling |
| 0.2 | 8.6 | PID_DELTA_NP63_PATHWAY | Validated transcriptional targets of deltaNp63 isoforms |
| 0.2 | 1.8 | PID_ALK2_PATHWAY | ALK2 signaling events |
| 0.2 | 2.7 | PID_PDGFRA_PATHWAY | PDGFR-alpha signaling pathway |
| 0.1 | 2.9 | SA_PROGRAMMED_CELL_DEATH | Programmed cell death, or apoptosis, eliminates damaged or unneeded cells. |
| 0.1 | 3.7 | PID_EPHRINB_REV_PATHWAY | Ephrin B reverse signaling |
| 0.1 | 2.8 | PID_IL2_STAT5_PATHWAY | IL2 signaling events mediated by STAT5 |
| 0.1 | 2.7 | PID_EPO_PATHWAY | EPO signaling pathway |
| 0.1 | 3.8 | PID_HDAC_CLASSIII_PATHWAY | Signaling events mediated by HDAC Class III |
| 0.1 | 6.7 | PID_TNF_PATHWAY | TNF receptor signaling pathway |
| 0.1 | 0.9 | PID_ERBB_NETWORK_PATHWAY | ErbB receptor signaling network |
| 0.1 | 3.0 | PID_SMAD2_3PATHWAY | Regulation of cytoplasmic and nuclear SMAD2/3 signaling |
| 0.1 | 8.3 | PID_REG_GR_PATHWAY | Glucocorticoid receptor regulatory network |
| 0.1 | 6.0 | PID_HEDGEHOG_GLI_PATHWAY | Hedgehog signaling events mediated by Gli proteins |
| 0.1 | 4.3 | PID_TAP63_PATHWAY | Validated transcriptional targets of TAp63 isoforms |
| 0.1 | 1.6 | PID_P38_MKK3_6PATHWAY | p38 MAPK signaling pathway |
| 0.1 | 1.6 | PID_BETA_CATENIN_DEG_PATHWAY | Degradation of beta catenin |
| 0.1 | 0.7 | PID_INTEGRIN_CS_PATHWAY | Integrin family cell surface interactions |
| 0.1 | 1.1 | ST_TUMOR_NECROSIS_FACTOR_PATHWAY | Tumor Necrosis Factor Pathway. |
| 0.1 | 0.8 | PID_SYNDECAN_3_PATHWAY | Syndecan-3-mediated signaling events |
| 0.1 | 0.6 | PID_SYNDECAN_2_PATHWAY | Syndecan-2-mediated signaling events |
| 0.1 | 4.6 | PID_BETA_CATENIN_NUC_PATHWAY | Regulation of nuclear beta catenin signaling and target gene transcription |
| 0.1 | 3.3 | PID_P53_REGULATION_PATHWAY | p53 pathway |
| 0.0 | 1.2 | PID_REELIN_PATHWAY | Reelin signaling pathway |
| 0.0 | 5.8 | NABA_ECM_GLYCOPROTEINS | Genes encoding structural ECM glycoproteins |
| 0.0 | 2.2 | PID_HDAC_CLASSI_PATHWAY | Signaling events mediated by HDAC Class I |
| 0.0 | 1.4 | PID_FAK_PATHWAY | Signaling events mediated by focal adhesion kinase |
| 0.0 | 1.6 | PID_MYC_REPRESS_PATHWAY | Validated targets of C-MYC transcriptional repression |
| 0.0 | 3.7 | NABA_ECM_AFFILIATED | Genes encoding proteins affiliated structurally or functionally to extracellular matrix proteins |
| 0.0 | 0.9 | PID_NCADHERIN_PATHWAY | N-cadherin signaling events |
| 0.0 | 1.6 | PID_HIF1_TFPATHWAY | HIF-1-alpha transcription factor network |
| 0.0 | 0.6 | PID_ERBB2_ERBB3_PATHWAY | ErbB2/ErbB3 signaling events |
| 0.0 | 0.6 | PID_KIT_PATHWAY | Signaling events mediated by Stem cell factor receptor (c-Kit) |
| 0.0 | 1.0 | PID_HES_HEY_PATHWAY | Notch-mediated HES/HEY network |
| 0.0 | 0.4 | PID_NETRIN_PATHWAY | Netrin-mediated signaling events |
| 0.0 | 4.2 | NABA_SECRETED_FACTORS | Genes encoding secreted soluble factors |
| 0.0 | 0.9 | PID_TGFBR_PATHWAY | TGF-beta receptor signaling |
| 0.0 | 0.7 | ST_ERK1_ERK2_MAPK_PATHWAY | ERK1/ERK2 MAPK Pathway |
| 0.0 | 0.9 | PID_RB_1PATHWAY | Regulation of retinoblastoma protein |
| 0.0 | 0.2 | PID_A6B1_A6B4_INTEGRIN_PATHWAY | a6b1 and a6b4 Integrin signaling |
Gene overrepresentation in C2:CP:REACTOME category:
| Log-likelihood per target | Total log-likelihood | Term | Description |
|---|---|---|---|
| 0.6 | 2.5 | REACTOME_GLYCOPROTEIN_HORMONES | Genes involved in Glycoprotein hormones |
| 0.2 | 4.8 | REACTOME_HS_GAG_DEGRADATION | Genes involved in HS-GAG degradation |
| 0.2 | 1.3 | REACTOME_TANDEM_PORE_DOMAIN_POTASSIUM_CHANNELS | Genes involved in Tandem pore domain potassium channels |
| 0.1 | 2.4 | REACTOME_TRAF3_DEPENDENT_IRF_ACTIVATION_PATHWAY | Genes involved in TRAF3-dependent IRF activation pathway |
| 0.1 | 5.5 | REACTOME_MYOGENESIS | Genes involved in Myogenesis |
| 0.1 | 1.2 | REACTOME_GAMMA_CARBOXYLATION_TRANSPORT_AND_AMINO_TERMINAL_CLEAVAGE_OF_PROTEINS | Genes involved in Gamma-carboxylation, transport, and amino-terminal cleavage of proteins |
| 0.1 | 1.2 | REACTOME_PLATELET_SENSITIZATION_BY_LDL | Genes involved in Platelet sensitization by LDL |
| 0.1 | 2.8 | REACTOME_SIGNAL_ATTENUATION | Genes involved in Signal attenuation |
| 0.1 | 4.1 | REACTOME_BASIGIN_INTERACTIONS | Genes involved in Basigin interactions |
| 0.1 | 3.2 | REACTOME_CREB_PHOSPHORYLATION_THROUGH_THE_ACTIVATION_OF_CAMKII | Genes involved in CREB phosphorylation through the activation of CaMKII |
| 0.1 | 3.3 | REACTOME_NEPHRIN_INTERACTIONS | Genes involved in Nephrin interactions |
| 0.1 | 1.5 | REACTOME_HDL_MEDIATED_LIPID_TRANSPORT | Genes involved in HDL-mediated lipid transport |
| 0.1 | 2.3 | REACTOME_DOWNREGULATION_OF_ERBB2_ERBB3_SIGNALING | Genes involved in Downregulation of ERBB2:ERBB3 signaling |
| 0.1 | 2.3 | REACTOME_CELL_EXTRACELLULAR_MATRIX_INTERACTIONS | Genes involved in Cell-extracellular matrix interactions |
| 0.1 | 1.3 | REACTOME_ERKS_ARE_INACTIVATED | Genes involved in ERKs are inactivated |
| 0.1 | 0.4 | REACTOME_BILE_SALT_AND_ORGANIC_ANION_SLC_TRANSPORTERS | Genes involved in Bile salt and organic anion SLC transporters |
| 0.1 | 2.1 | REACTOME_TRAFFICKING_OF_GLUR2_CONTAINING_AMPA_RECEPTORS | Genes involved in Trafficking of GluR2-containing AMPA receptors |
| 0.1 | 1.5 | REACTOME_VIRAL_MESSENGER_RNA_SYNTHESIS | Genes involved in Viral Messenger RNA Synthesis |
| 0.1 | 1.1 | REACTOME_NUCLEAR_EVENTS_KINASE_AND_TRANSCRIPTION_FACTOR_ACTIVATION | Genes involved in Nuclear Events (kinase and transcription factor activation) |
| 0.1 | 0.5 | REACTOME_IRAK2_MEDIATED_ACTIVATION_OF_TAK1_COMPLEX_UPON_TLR7_8_OR_9_STIMULATION | Genes involved in IRAK2 mediated activation of TAK1 complex upon TLR7/8 or 9 stimulation |
| 0.1 | 0.8 | REACTOME_ROLE_OF_SECOND_MESSENGERS_IN_NETRIN1_SIGNALING | Genes involved in Role of second messengers in netrin-1 signaling |
| 0.1 | 2.0 | REACTOME_PRE_NOTCH_TRANSCRIPTION_AND_TRANSLATION | Genes involved in Pre-NOTCH Transcription and Translation |
| 0.1 | 1.9 | REACTOME_YAP1_AND_WWTR1_TAZ_STIMULATED_GENE_EXPRESSION | Genes involved in YAP1- and WWTR1 (TAZ)-stimulated gene expression |
| 0.1 | 0.9 | REACTOME_PROTEOLYTIC_CLEAVAGE_OF_SNARE_COMPLEX_PROTEINS | Genes involved in Proteolytic cleavage of SNARE complex proteins |
| 0.1 | 1.2 | REACTOME_ABCA_TRANSPORTERS_IN_LIPID_HOMEOSTASIS | Genes involved in ABCA transporters in lipid homeostasis |
| 0.1 | 4.5 | REACTOME_INTEGRIN_CELL_SURFACE_INTERACTIONS | Genes involved in Integrin cell surface interactions |
| 0.1 | 1.6 | REACTOME_METAL_ION_SLC_TRANSPORTERS | Genes involved in Metal ion SLC transporters |
| 0.1 | 0.4 | REACTOME_ENDOGENOUS_STEROLS | Genes involved in Endogenous sterols |
| 0.1 | 0.9 | REACTOME_METABOLISM_OF_POLYAMINES | Genes involved in Metabolism of polyamines |
| 0.1 | 1.7 | REACTOME_BMAL1_CLOCK_NPAS2_ACTIVATES_CIRCADIAN_EXPRESSION | Genes involved in BMAL1:CLOCK/NPAS2 Activates Circadian Expression |
| 0.1 | 0.7 | REACTOME_PRE_NOTCH_PROCESSING_IN_GOLGI | Genes involved in Pre-NOTCH Processing in Golgi |
| 0.1 | 1.6 | REACTOME_PIP3_ACTIVATES_AKT_SIGNALING | Genes involved in PIP3 activates AKT signaling |
| 0.0 | 1.6 | REACTOME_FATTY_ACYL_COA_BIOSYNTHESIS | Genes involved in Fatty Acyl-CoA Biosynthesis |
| 0.0 | 0.5 | REACTOME_SYNTHESIS_OF_PE | Genes involved in Synthesis of PE |
| 0.0 | 1.2 | REACTOME_TRANSPORT_OF_RIBONUCLEOPROTEINS_INTO_THE_HOST_NUCLEUS | Genes involved in Transport of Ribonucleoproteins into the Host Nucleus |
| 0.0 | 0.4 | REACTOME_DOPAMINE_NEUROTRANSMITTER_RELEASE_CYCLE | Genes involved in Dopamine Neurotransmitter Release Cycle |
| 0.0 | 0.5 | REACTOME_VITAMIN_B5_PANTOTHENATE_METABOLISM | Genes involved in Vitamin B5 (pantothenate) metabolism |
| 0.0 | 0.5 | REACTOME_NEF_MEDIATED_DOWNREGULATION_OF_MHC_CLASS_I_COMPLEX_CELL_SURFACE_EXPRESSION | Genes involved in Nef mediated downregulation of MHC class I complex cell surface expression |
| 0.0 | 0.3 | REACTOME_TERMINATION_OF_O_GLYCAN_BIOSYNTHESIS | Genes involved in Termination of O-glycan biosynthesis |
| 0.0 | 0.9 | REACTOME_DOWNREGULATION_OF_TGF_BETA_RECEPTOR_SIGNALING | Genes involved in Downregulation of TGF-beta receptor signaling |
| 0.0 | 0.5 | REACTOME_CRMPS_IN_SEMA3A_SIGNALING | Genes involved in CRMPs in Sema3A signaling |
| 0.0 | 0.4 | REACTOME_SYNTHESIS_OF_PC | Genes involved in Synthesis of PC |
| 0.0 | 1.0 | REACTOME_ANTIVIRAL_MECHANISM_BY_IFN_STIMULATED_GENES | Genes involved in Antiviral mechanism by IFN-stimulated genes |
| 0.0 | 0.8 | REACTOME_G1_PHASE | Genes involved in G1 Phase |
| 0.0 | 0.5 | REACTOME_SIGNALING_BY_FGFR1_FUSION_MUTANTS | Genes involved in Signaling by FGFR1 fusion mutants |
| 0.0 | 3.3 | REACTOME_FATTY_ACID_TRIACYLGLYCEROL_AND_KETONE_BODY_METABOLISM | Genes involved in Fatty acid, triacylglycerol, and ketone body metabolism |
| 0.0 | 2.3 | REACTOME_SIGNALING_BY_RHO_GTPASES | Genes involved in Signaling by Rho GTPases |
| 0.0 | 0.2 | REACTOME_P2Y_RECEPTORS | Genes involved in P2Y receptors |
| 0.0 | 2.8 | REACTOME_CHROMOSOME_MAINTENANCE | Genes involved in Chromosome Maintenance |
| 0.0 | 0.2 | REACTOME_REGULATION_OF_IFNG_SIGNALING | Genes involved in Regulation of IFNG signaling |
| 0.0 | 0.3 | REACTOME_REGULATION_OF_PYRUVATE_DEHYDROGENASE_PDH_COMPLEX | Genes involved in Regulation of pyruvate dehydrogenase (PDH) complex |
| 0.0 | 0.6 | REACTOME_CGMP_EFFECTS | Genes involved in cGMP effects |
| 0.0 | 0.1 | REACTOME_SPRY_REGULATION_OF_FGF_SIGNALING | Genes involved in Spry regulation of FGF signaling |
| 0.0 | 0.4 | REACTOME_MITOCHONDRIAL_TRNA_AMINOACYLATION | Genes involved in Mitochondrial tRNA aminoacylation |
| 0.0 | 0.1 | REACTOME_PLATELET_ADHESION_TO_EXPOSED_COLLAGEN | Genes involved in Platelet Adhesion to exposed collagen |
| 0.0 | 0.2 | REACTOME_ELONGATION_ARREST_AND_RECOVERY | Genes involved in Elongation arrest and recovery |
| 0.0 | 0.1 | REACTOME_ACYL_CHAIN_REMODELLING_OF_PS | Genes involved in Acyl chain remodelling of PS |
| 0.0 | 1.2 | REACTOME_NRAGE_SIGNALS_DEATH_THROUGH_JNK | Genes involved in NRAGE signals death through JNK |
| 0.0 | 1.6 | REACTOME_TRANSPORT_OF_INORGANIC_CATIONS_ANIONS_AND_AMINO_ACIDS_OLIGOPEPTIDES | Genes involved in Transport of inorganic cations/anions and amino acids/oligopeptides |
| 0.0 | 0.2 | REACTOME_IONOTROPIC_ACTIVITY_OF_KAINATE_RECEPTORS | Genes involved in Ionotropic activity of Kainate Receptors |
| 0.0 | 0.6 | REACTOME_ACTIVATION_OF_CHAPERONE_GENES_BY_XBP1S | Genes involved in Activation of Chaperone Genes by XBP1(S) |
|
|
|
|