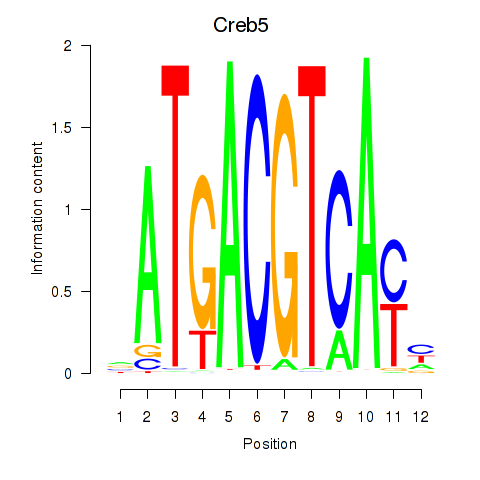
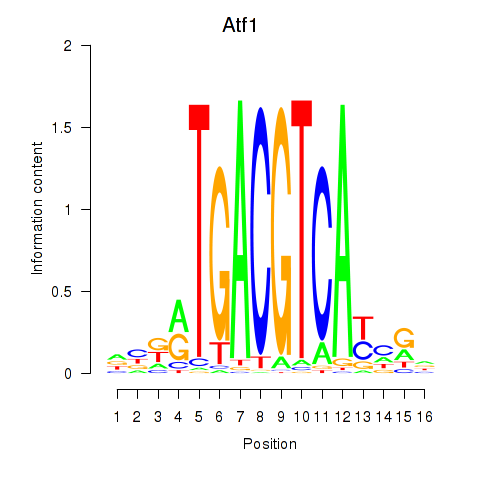
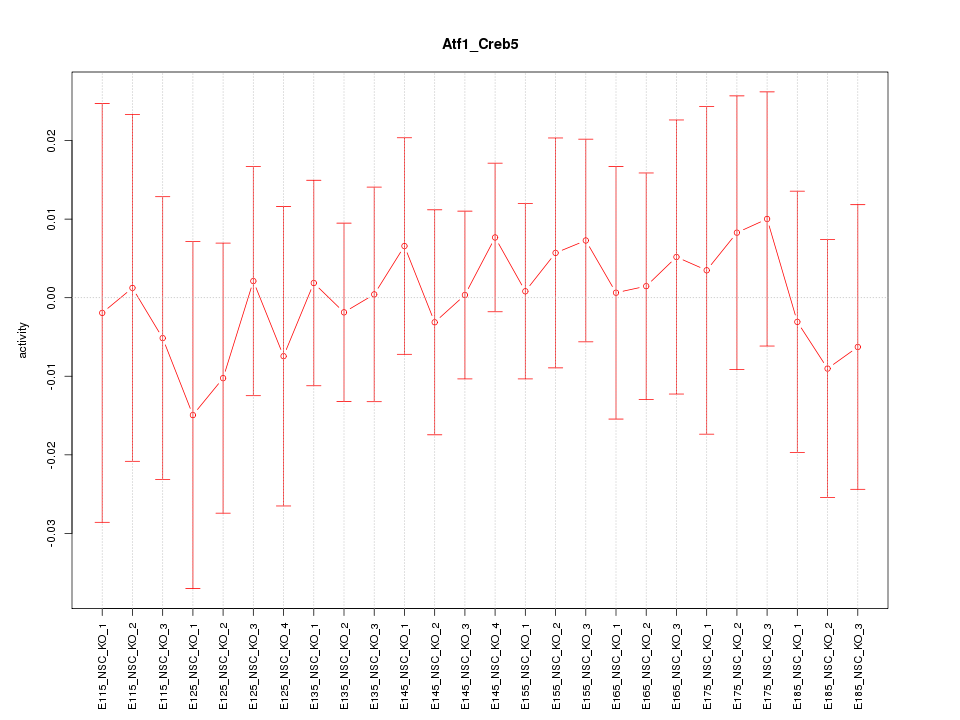
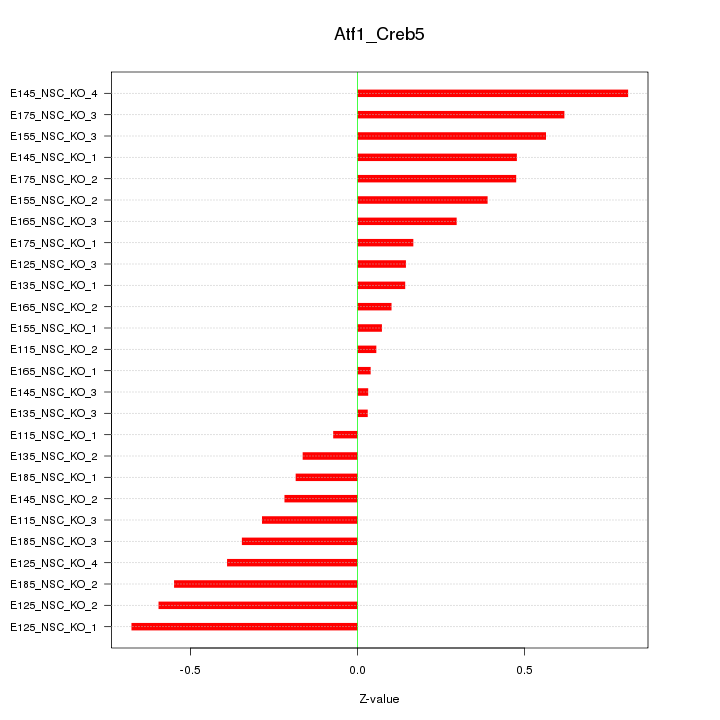
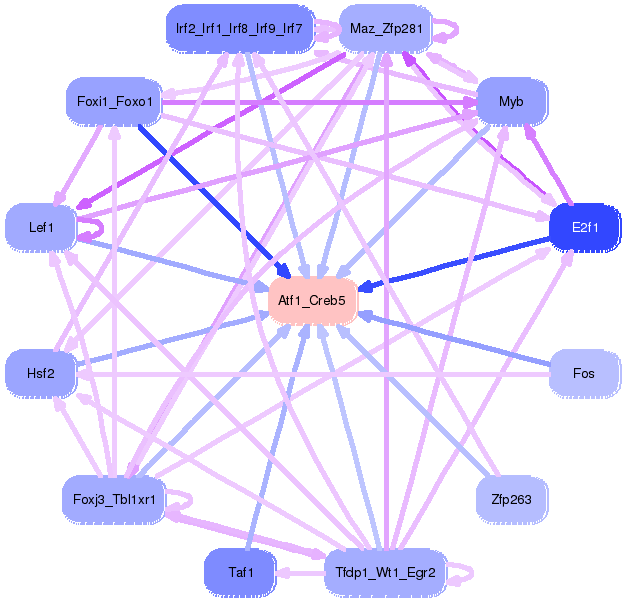
Motif ID: Atf1_Creb5
Z-value: 0.379
Transcription factors associated with Atf1_Creb5:
| Gene Symbol | Entrez ID | Gene Name |
|---|---|---|
| Atf1 | ENSMUSG00000023027.6 | Atf1 |
| Creb5 | ENSMUSG00000053007.6 | Creb5 |
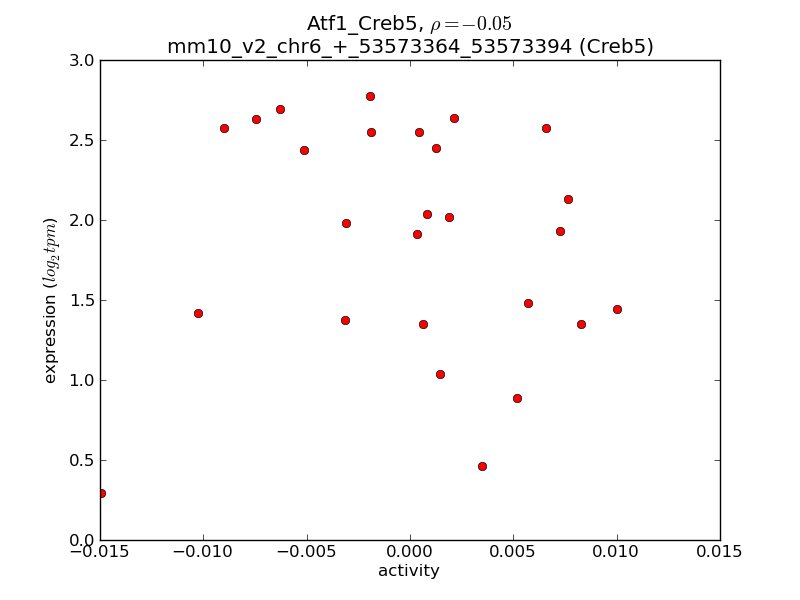
Activity-expression correlation:
| Gene Symbol | Promoter | Pearson corr. coef. | P-value | Plot |
|---|---|---|---|---|
| Atf1 | mm10_v2_chr15_+_100227819_100227856 | -0.30 | 1.4e-01 | Click! |
| Creb5 | mm10_v2_chr6_+_53573364_53573394 | -0.05 | 7.9e-01 | Click! |

Top targets:
Gene overrepresentation in biological_process category:
| Log-likelihood per target | Total log-likelihood | Term | Description |
|---|---|---|---|
| 0.4 | 1.1 | GO:1903774 | positive regulation of viral budding via host ESCRT complex(GO:1903774) |
| 0.3 | 1.2 | GO:1901894 | regulation of calcium-transporting ATPase activity(GO:1901894) |
| 0.3 | 0.8 | GO:1900736 | regulation of phospholipase C-activating G-protein coupled receptor signaling pathway(GO:1900736) |
| 0.2 | 1.1 | GO:0051012 | microtubule sliding(GO:0051012) negative regulation of nonmotile primary cilium assembly(GO:1902856) |
| 0.2 | 0.6 | GO:0043379 | memory T cell differentiation(GO:0043379) negative regulation of isotype switching to IgE isotypes(GO:0048294) |
| 0.2 | 0.7 | GO:0045054 | constitutive secretory pathway(GO:0045054) |
| 0.2 | 0.5 | GO:0046341 | CDP-diacylglycerol metabolic process(GO:0046341) |
| 0.2 | 1.9 | GO:0006995 | cellular response to nitrogen starvation(GO:0006995) cellular response to nitrogen levels(GO:0043562) |
| 0.2 | 1.5 | GO:0060373 | regulation of atrial cardiac muscle cell membrane depolarization(GO:0060371) regulation of ventricular cardiac muscle cell membrane depolarization(GO:0060373) |
| 0.2 | 0.5 | GO:0031038 | myosin II filament organization(GO:0031038) regulation of myosin II filament organization(GO:0043519) |
| 0.2 | 0.5 | GO:0010958 | regulation of amino acid import(GO:0010958) regulation of L-arginine import(GO:0010963) |
| 0.1 | 0.6 | GO:2001204 | regulation of osteoclast development(GO:2001204) |
| 0.1 | 0.3 | GO:0006931 | substrate-dependent cell migration, cell attachment to substrate(GO:0006931) calcium-independent cell-matrix adhesion(GO:0007161) |
| 0.1 | 0.6 | GO:0035743 | CD4-positive, alpha-beta T cell cytokine production(GO:0035743) T-helper 2 cell cytokine production(GO:0035745) |
| 0.1 | 0.3 | GO:2000501 | natural killer cell chemotaxis(GO:0035747) regulation of natural killer cell chemotaxis(GO:2000501) |
| 0.1 | 0.3 | GO:0009182 | purine deoxyribonucleoside diphosphate metabolic process(GO:0009182) dGDP metabolic process(GO:0046066) GDP metabolic process(GO:0046710) |
| 0.1 | 0.3 | GO:0006669 | sphinganine-1-phosphate biosynthetic process(GO:0006669) |
| 0.1 | 0.3 | GO:0034975 | protein folding in endoplasmic reticulum(GO:0034975) |
| 0.1 | 0.5 | GO:1901096 | regulation of autophagosome maturation(GO:1901096) |
| 0.1 | 0.2 | GO:0048388 | endosomal lumen acidification(GO:0048388) synaptic vesicle lumen acidification(GO:0097401) |
| 0.1 | 0.2 | GO:0048208 | vesicle targeting, rough ER to cis-Golgi(GO:0048207) COPII vesicle coating(GO:0048208) |
| 0.1 | 0.4 | GO:0042985 | negative regulation of amyloid precursor protein biosynthetic process(GO:0042985) |
| 0.1 | 0.6 | GO:2000301 | negative regulation of synaptic vesicle exocytosis(GO:2000301) |
| 0.1 | 0.6 | GO:0030432 | peristalsis(GO:0030432) |
| 0.1 | 0.3 | GO:0071947 | protein deubiquitination involved in ubiquitin-dependent protein catabolic process(GO:0071947) |
| 0.1 | 0.3 | GO:0018125 | peptidyl-cysteine methylation(GO:0018125) |
| 0.1 | 0.2 | GO:1903722 | regulation of centriole elongation(GO:1903722) |
| 0.1 | 0.2 | GO:0071677 | positive regulation of mononuclear cell migration(GO:0071677) |
| 0.1 | 0.7 | GO:0045217 | cell-cell junction maintenance(GO:0045217) |
| 0.1 | 0.6 | GO:0071243 | cellular response to arsenic-containing substance(GO:0071243) |
| 0.1 | 0.6 | GO:0046543 | development of secondary female sexual characteristics(GO:0046543) |
| 0.1 | 0.2 | GO:0019482 | beta-alanine metabolic process(GO:0019482) |
| 0.1 | 0.2 | GO:1902310 | positive regulation of peptidyl-serine dephosphorylation(GO:1902310) |
| 0.1 | 0.1 | GO:0001543 | ovarian follicle rupture(GO:0001543) |
| 0.1 | 0.2 | GO:0010845 | positive regulation of reciprocal meiotic recombination(GO:0010845) |
| 0.1 | 0.5 | GO:0097011 | cellular response to granulocyte macrophage colony-stimulating factor stimulus(GO:0097011) |
| 0.1 | 0.2 | GO:0002175 | protein localization to paranode region of axon(GO:0002175) |
| 0.0 | 0.2 | GO:1901475 | pyruvate transmembrane transport(GO:1901475) |
| 0.0 | 0.3 | GO:0090209 | negative regulation of triglyceride metabolic process(GO:0090209) |
| 0.0 | 0.2 | GO:0045144 | meiotic sister chromatid segregation(GO:0045144) meiotic sister chromatid cohesion(GO:0051177) |
| 0.0 | 0.3 | GO:0010528 | regulation of transposition(GO:0010528) negative regulation of transposition(GO:0010529) |
| 0.0 | 0.9 | GO:0021542 | dentate gyrus development(GO:0021542) |
| 0.0 | 0.3 | GO:0043983 | histone H4-K12 acetylation(GO:0043983) |
| 0.0 | 0.2 | GO:0007023 | post-chaperonin tubulin folding pathway(GO:0007023) |
| 0.0 | 0.3 | GO:0090091 | positive regulation of extracellular matrix disassembly(GO:0090091) |
| 0.0 | 0.1 | GO:1904742 | regulation of telomeric DNA binding(GO:1904742) |
| 0.0 | 0.4 | GO:0042118 | endothelial cell activation(GO:0042118) |
| 0.0 | 0.1 | GO:0008612 | peptidyl-lysine modification to peptidyl-hypusine(GO:0008612) |
| 0.0 | 0.1 | GO:1900369 | negative regulation of RNA interference(GO:1900369) |
| 0.0 | 0.7 | GO:0008209 | androgen metabolic process(GO:0008209) |
| 0.0 | 0.1 | GO:0060022 | hard palate development(GO:0060022) soft palate development(GO:0060023) |
| 0.0 | 0.6 | GO:0046069 | cGMP catabolic process(GO:0046069) |
| 0.0 | 0.3 | GO:1903301 | positive regulation of glucokinase activity(GO:0033133) positive regulation of hexokinase activity(GO:1903301) |
| 0.0 | 0.2 | GO:0018243 | protein O-linked glycosylation via threonine(GO:0018243) |
| 0.0 | 0.2 | GO:0014022 | neural plate elongation(GO:0014022) convergent extension involved in neural plate elongation(GO:0022007) |
| 0.0 | 0.1 | GO:0097309 | cap1 mRNA methylation(GO:0097309) |
| 0.0 | 0.1 | GO:1900060 | negative regulation of sphingolipid biosynthetic process(GO:0090155) cellular sphingolipid homeostasis(GO:0090156) negative regulation of ceramide biosynthetic process(GO:1900060) |
| 0.0 | 0.3 | GO:0090557 | establishment of endothelial intestinal barrier(GO:0090557) |
| 0.0 | 0.1 | GO:0071442 | positive regulation of histone H3-K14 acetylation(GO:0071442) |
| 0.0 | 0.1 | GO:1902626 | assembly of large subunit precursor of preribosome(GO:1902626) |
| 0.0 | 0.1 | GO:0051365 | cellular response to potassium ion starvation(GO:0051365) |
| 0.0 | 0.1 | GO:0045204 | MAPK export from nucleus(GO:0045204) |
| 0.0 | 0.1 | GO:0003245 | cardiac muscle tissue growth involved in heart morphogenesis(GO:0003245) |
| 0.0 | 0.2 | GO:0051152 | positive regulation of smooth muscle cell differentiation(GO:0051152) |
| 0.0 | 0.2 | GO:0043615 | astrocyte cell migration(GO:0043615) |
| 0.0 | 0.1 | GO:0000393 | spliceosomal conformational changes to generate catalytic conformation(GO:0000393) |
| 0.0 | 0.5 | GO:0045653 | negative regulation of megakaryocyte differentiation(GO:0045653) |
| 0.0 | 0.3 | GO:0000012 | single strand break repair(GO:0000012) |
| 0.0 | 0.3 | GO:0035970 | peptidyl-threonine dephosphorylation(GO:0035970) |
| 0.0 | 0.2 | GO:0070314 | G1 to G0 transition(GO:0070314) |
| 0.0 | 0.1 | GO:0070126 | mitochondrial translational termination(GO:0070126) |
| 0.0 | 0.1 | GO:0006780 | uroporphyrinogen III biosynthetic process(GO:0006780) |
| 0.0 | 0.1 | GO:0060050 | positive regulation of protein glycosylation(GO:0060050) |
| 0.0 | 2.0 | GO:0051965 | positive regulation of synapse assembly(GO:0051965) |
| 0.0 | 0.1 | GO:2000767 | positive regulation of cytoplasmic translation(GO:2000767) |
| 0.0 | 0.1 | GO:1903237 | negative regulation of leukocyte tethering or rolling(GO:1903237) |
| 0.0 | 0.0 | GO:0036302 | atrioventricular canal development(GO:0036302) |
| 0.0 | 0.2 | GO:0018095 | protein polyglutamylation(GO:0018095) |
| 0.0 | 0.1 | GO:0038108 | negative regulation of appetite by leptin-mediated signaling pathway(GO:0038108) |
| 0.0 | 0.2 | GO:0007042 | lysosomal lumen acidification(GO:0007042) |
| 0.0 | 0.2 | GO:0086023 | adrenergic receptor signaling pathway involved in heart process(GO:0086023) |
| 0.0 | 0.7 | GO:2000279 | negative regulation of DNA biosynthetic process(GO:2000279) |
| 0.0 | 0.1 | GO:1902775 | mitochondrial large ribosomal subunit assembly(GO:1902775) |
| 0.0 | 0.1 | GO:0030825 | positive regulation of cGMP metabolic process(GO:0030825) positive regulation of cGMP biosynthetic process(GO:0030828) |
| 0.0 | 0.1 | GO:0021764 | amygdala development(GO:0021764) |
| 0.0 | 0.4 | GO:0045956 | positive regulation of calcium ion-dependent exocytosis(GO:0045956) |
| 0.0 | 0.1 | GO:1903546 | protein localization to photoreceptor outer segment(GO:1903546) |
| 0.0 | 0.2 | GO:0030953 | astral microtubule organization(GO:0030953) |
| 0.0 | 0.1 | GO:2000271 | positive regulation of fibroblast apoptotic process(GO:2000271) |
| 0.0 | 0.5 | GO:0045746 | negative regulation of Notch signaling pathway(GO:0045746) |
| 0.0 | 1.1 | GO:0035904 | aorta development(GO:0035904) |
| 0.0 | 0.2 | GO:0019433 | triglyceride catabolic process(GO:0019433) |
| 0.0 | 0.1 | GO:0003406 | retinal pigment epithelium development(GO:0003406) |
| 0.0 | 0.8 | GO:0008542 | visual learning(GO:0008542) |
| 0.0 | 0.1 | GO:0007253 | cytoplasmic sequestering of NF-kappaB(GO:0007253) |
| 0.0 | 0.2 | GO:0006622 | protein targeting to lysosome(GO:0006622) |
| 0.0 | 0.1 | GO:0097034 | mitochondrial respiratory chain complex IV assembly(GO:0033617) mitochondrial respiratory chain complex IV biogenesis(GO:0097034) |
| 0.0 | 0.9 | GO:0072583 | clathrin-mediated endocytosis(GO:0072583) |
| 0.0 | 0.2 | GO:1901898 | negative regulation of relaxation of muscle(GO:1901078) negative regulation of relaxation of cardiac muscle(GO:1901898) |
| 0.0 | 0.2 | GO:0048172 | regulation of short-term neuronal synaptic plasticity(GO:0048172) |
| 0.0 | 0.1 | GO:0006706 | steroid catabolic process(GO:0006706) |
| 0.0 | 0.5 | GO:0071277 | cellular response to calcium ion(GO:0071277) |
| 0.0 | 0.1 | GO:0070475 | rRNA base methylation(GO:0070475) |
| 0.0 | 0.1 | GO:0006290 | pyrimidine dimer repair(GO:0006290) |
| 0.0 | 0.0 | GO:0045347 | negative regulation of MHC class II biosynthetic process(GO:0045347) |
| 0.0 | 0.1 | GO:0048672 | positive regulation of collateral sprouting(GO:0048672) |
| 0.0 | 0.4 | GO:0033014 | porphyrin-containing compound biosynthetic process(GO:0006779) tetrapyrrole biosynthetic process(GO:0033014) |
| 0.0 | 0.2 | GO:0035518 | histone H2A monoubiquitination(GO:0035518) |
| 0.0 | 0.1 | GO:0033227 | dsRNA transport(GO:0033227) |
| 0.0 | 0.1 | GO:0048563 | post-embryonic organ morphogenesis(GO:0048563) |
| 0.0 | 0.0 | GO:0051030 | snRNA transport(GO:0051030) |
Gene overrepresentation in cellular_component category:
| Log-likelihood per target | Total log-likelihood | Term | Description |
|---|---|---|---|
| 0.2 | 0.8 | GO:0042583 | chromaffin granule(GO:0042583) |
| 0.1 | 2.1 | GO:0000421 | autophagosome membrane(GO:0000421) |
| 0.1 | 0.3 | GO:0005577 | fibrinogen complex(GO:0005577) |
| 0.1 | 0.8 | GO:0000813 | ESCRT I complex(GO:0000813) |
| 0.1 | 1.4 | GO:0034706 | voltage-gated sodium channel complex(GO:0001518) sodium channel complex(GO:0034706) |
| 0.1 | 0.9 | GO:0030130 | clathrin coat of trans-Golgi network vesicle(GO:0030130) |
| 0.1 | 0.3 | GO:0031467 | Cul7-RING ubiquitin ligase complex(GO:0031467) |
| 0.1 | 1.4 | GO:0033017 | sarcoplasmic reticulum membrane(GO:0033017) |
| 0.1 | 0.2 | GO:0097454 | Schwann cell microvillus(GO:0097454) |
| 0.1 | 0.2 | GO:0030981 | cortical microtubule cytoskeleton(GO:0030981) |
| 0.1 | 0.2 | GO:1990415 | Pex17p-Pex14p docking complex(GO:1990415) peroxisomal importomer complex(GO:1990429) |
| 0.0 | 0.2 | GO:0031673 | H zone(GO:0031673) |
| 0.0 | 0.3 | GO:0000235 | astral microtubule(GO:0000235) |
| 0.0 | 1.6 | GO:0055038 | recycling endosome membrane(GO:0055038) |
| 0.0 | 0.3 | GO:0000220 | vacuolar proton-transporting V-type ATPase, V0 domain(GO:0000220) |
| 0.0 | 0.2 | GO:0036449 | microtubule minus-end(GO:0036449) |
| 0.0 | 0.4 | GO:0072546 | ER membrane protein complex(GO:0072546) |
| 0.0 | 0.2 | GO:0000322 | storage vacuole(GO:0000322) |
| 0.0 | 0.2 | GO:0031313 | extrinsic component of endosome membrane(GO:0031313) |
| 0.0 | 1.1 | GO:0030131 | clathrin adaptor complex(GO:0030131) |
| 0.0 | 0.2 | GO:0070187 | telosome(GO:0070187) |
| 0.0 | 0.6 | GO:0000795 | synaptonemal complex(GO:0000795) |
| 0.0 | 0.1 | GO:0035339 | SPOTS complex(GO:0035339) |
| 0.0 | 0.3 | GO:0000164 | protein phosphatase type 1 complex(GO:0000164) |
| 0.0 | 0.3 | GO:0035253 | ciliary rootlet(GO:0035253) |
| 0.0 | 0.1 | GO:0072357 | PTW/PP1 phosphatase complex(GO:0072357) |
| 0.0 | 0.4 | GO:0014731 | spectrin-associated cytoskeleton(GO:0014731) |
| 0.0 | 0.4 | GO:0000159 | protein phosphatase type 2A complex(GO:0000159) |
| 0.0 | 0.3 | GO:0032580 | Golgi cisterna membrane(GO:0032580) |
| 0.0 | 0.1 | GO:0071437 | invadopodium(GO:0071437) |
| 0.0 | 0.1 | GO:0005947 | mitochondrial alpha-ketoglutarate dehydrogenase complex(GO:0005947) |
| 0.0 | 0.6 | GO:0030660 | Golgi-associated vesicle membrane(GO:0030660) |
| 0.0 | 0.2 | GO:0042581 | specific granule(GO:0042581) |
| 0.0 | 0.1 | GO:0044530 | supraspliceosomal complex(GO:0044530) |
| 0.0 | 0.2 | GO:0000815 | ESCRT III complex(GO:0000815) |
| 0.0 | 0.1 | GO:1902636 | kinociliary basal body(GO:1902636) |
| 0.0 | 0.1 | GO:0071014 | post-mRNA release spliceosomal complex(GO:0071014) |
| 0.0 | 1.0 | GO:0031463 | Cul3-RING ubiquitin ligase complex(GO:0031463) |
| 0.0 | 0.2 | GO:1990909 | Wnt signalosome(GO:1990909) |
| 0.0 | 0.1 | GO:0033503 | HULC complex(GO:0033503) |
| 0.0 | 0.1 | GO:0070695 | FHF complex(GO:0070695) |
| 0.0 | 0.1 | GO:0031933 | telomeric heterochromatin(GO:0031933) |
| 0.0 | 0.5 | GO:0044295 | axonal growth cone(GO:0044295) |
| 0.0 | 0.1 | GO:0045261 | mitochondrial proton-transporting ATP synthase complex, catalytic core F(1)(GO:0000275) proton-transporting ATP synthase complex, catalytic core F(1)(GO:0045261) |
| 0.0 | 1.0 | GO:0005930 | axoneme(GO:0005930) ciliary plasm(GO:0097014) |
| 0.0 | 0.8 | GO:0031594 | neuromuscular junction(GO:0031594) |
| 0.0 | 0.1 | GO:0042788 | polysomal ribosome(GO:0042788) |
| 0.0 | 0.5 | GO:0005776 | autophagosome(GO:0005776) |
| 0.0 | 0.1 | GO:0090576 | RNA polymerase III transcription factor complex(GO:0090576) |
| 0.0 | 0.1 | GO:0016589 | NURF complex(GO:0016589) |
Gene overrepresentation in molecular_function category:
| Log-likelihood per target | Total log-likelihood | Term | Description |
|---|---|---|---|
| 0.2 | 0.7 | GO:0060072 | large conductance calcium-activated potassium channel activity(GO:0060072) |
| 0.2 | 1.8 | GO:0008429 | phosphatidylethanolamine binding(GO:0008429) |
| 0.2 | 1.5 | GO:0086006 | voltage-gated sodium channel activity involved in cardiac muscle cell action potential(GO:0086006) |
| 0.2 | 0.6 | GO:0004994 | somatostatin receptor activity(GO:0004994) |
| 0.2 | 0.5 | GO:0004605 | phosphatidate cytidylyltransferase activity(GO:0004605) |
| 0.1 | 1.1 | GO:0001206 | transcriptional repressor activity, RNA polymerase II distal enhancer sequence-specific binding(GO:0001206) |
| 0.1 | 0.3 | GO:0033699 | DNA 5'-adenosine monophosphate hydrolase activity(GO:0033699) |
| 0.1 | 0.3 | GO:0034190 | apolipoprotein receptor binding(GO:0034190) |
| 0.1 | 0.9 | GO:0032050 | clathrin heavy chain binding(GO:0032050) |
| 0.1 | 0.5 | GO:0016813 | hydrolase activity, acting on carbon-nitrogen (but not peptide) bonds, in linear amidines(GO:0016813) |
| 0.1 | 0.3 | GO:0017050 | sphinganine kinase activity(GO:0008481) D-erythro-sphingosine kinase activity(GO:0017050) |
| 0.1 | 0.3 | GO:0016812 | hydrolase activity, acting on carbon-nitrogen (but not peptide) bonds, in cyclic amides(GO:0016812) |
| 0.1 | 0.2 | GO:0042030 | ATPase inhibitor activity(GO:0042030) |
| 0.1 | 0.2 | GO:0072320 | volume-sensitive chloride channel activity(GO:0072320) |
| 0.1 | 0.3 | GO:0045340 | mercury ion binding(GO:0045340) |
| 0.1 | 0.6 | GO:0001161 | intronic transcription regulatory region sequence-specific DNA binding(GO:0001161) |
| 0.1 | 0.3 | GO:0004724 | magnesium-dependent protein serine/threonine phosphatase activity(GO:0004724) |
| 0.0 | 0.2 | GO:0050833 | pyruvate transmembrane transporter activity(GO:0050833) |
| 0.0 | 0.1 | GO:0030249 | guanylate cyclase regulator activity(GO:0030249) |
| 0.0 | 0.1 | GO:0034597 | phosphatidylinositol-4,5-bisphosphate 4-phosphatase activity(GO:0034597) |
| 0.0 | 1.0 | GO:0031489 | myosin V binding(GO:0031489) |
| 0.0 | 0.6 | GO:0043522 | leucine zipper domain binding(GO:0043522) |
| 0.0 | 0.2 | GO:0086080 | protein binding involved in heterotypic cell-cell adhesion(GO:0086080) |
| 0.0 | 0.1 | GO:0035614 | snRNA stem-loop binding(GO:0035614) |
| 0.0 | 0.8 | GO:0005184 | neuropeptide hormone activity(GO:0005184) |
| 0.0 | 0.3 | GO:0003873 | 6-phosphofructo-2-kinase activity(GO:0003873) fructose-2,6-bisphosphate 2-phosphatase activity(GO:0004331) |
| 0.0 | 0.2 | GO:0004984 | olfactory receptor activity(GO:0004984) |
| 0.0 | 0.9 | GO:0008327 | methyl-CpG binding(GO:0008327) |
| 0.0 | 0.1 | GO:0003692 | left-handed Z-DNA binding(GO:0003692) |
| 0.0 | 0.3 | GO:0008140 | cAMP response element binding protein binding(GO:0008140) |
| 0.0 | 0.4 | GO:0008601 | protein phosphatase type 2A regulator activity(GO:0008601) |
| 0.0 | 0.3 | GO:0031730 | CCR5 chemokine receptor binding(GO:0031730) |
| 0.0 | 0.6 | GO:0030553 | cGMP binding(GO:0030553) |
| 0.0 | 0.1 | GO:0046969 | histone deacetylase activity (H3-K9 specific)(GO:0032129) NAD-dependent histone deacetylase activity (H3-K9 specific)(GO:0046969) |
| 0.0 | 0.2 | GO:0051429 | corticotropin-releasing hormone receptor binding(GO:0051429) corticotropin-releasing hormone receptor 1 binding(GO:0051430) |
| 0.0 | 0.7 | GO:0008330 | protein tyrosine/threonine phosphatase activity(GO:0008330) |
| 0.0 | 0.1 | GO:0004483 | mRNA (nucleoside-2'-O-)-methyltransferase activity(GO:0004483) |
| 0.0 | 0.5 | GO:0030742 | GTP-dependent protein binding(GO:0030742) |
| 0.0 | 0.5 | GO:0008242 | omega peptidase activity(GO:0008242) |
| 0.0 | 0.6 | GO:0043325 | phosphatidylinositol-3,4-bisphosphate binding(GO:0043325) |
| 0.0 | 0.4 | GO:0005355 | glucose transmembrane transporter activity(GO:0005355) |
| 0.0 | 0.1 | GO:0061676 | importin-alpha family protein binding(GO:0061676) |
| 0.0 | 0.2 | GO:0030957 | Tat protein binding(GO:0030957) |
| 0.0 | 0.1 | GO:0043891 | glyceraldehyde-3-phosphate dehydrogenase (NAD+) (phosphorylating) activity(GO:0004365) glyceraldehyde-3-phosphate dehydrogenase (NAD(P)+) (phosphorylating) activity(GO:0043891) |
| 0.0 | 0.3 | GO:0008553 | hydrogen-exporting ATPase activity, phosphorylative mechanism(GO:0008553) |
| 0.0 | 0.1 | GO:0031735 | CCR10 chemokine receptor binding(GO:0031735) |
| 0.0 | 0.2 | GO:0097322 | 7SK snRNA binding(GO:0097322) |
| 0.0 | 0.7 | GO:0004709 | MAP kinase kinase kinase activity(GO:0004709) |
| 0.0 | 0.1 | GO:0015186 | L-asparagine transmembrane transporter activity(GO:0015182) L-glutamine transmembrane transporter activity(GO:0015186) |
| 0.0 | 0.6 | GO:0005112 | Notch binding(GO:0005112) |
| 0.0 | 1.8 | GO:0048306 | calcium-dependent protein binding(GO:0048306) |
| 0.0 | 0.2 | GO:0051011 | microtubule minus-end binding(GO:0051011) |
| 0.0 | 0.1 | GO:0008176 | tRNA (guanine-N7-)-methyltransferase activity(GO:0008176) |
| 0.0 | 0.2 | GO:0030306 | ADP-ribosylation factor binding(GO:0030306) |
| 0.0 | 0.1 | GO:0050510 | N-acetylgalactosaminyl-proteoglycan 3-beta-glucuronosyltransferase activity(GO:0050510) |
| 0.0 | 0.8 | GO:0042169 | SH2 domain binding(GO:0042169) |
| 0.0 | 1.1 | GO:0030276 | clathrin binding(GO:0030276) |
| 0.0 | 0.1 | GO:0051032 | nucleic acid transmembrane transporter activity(GO:0051032) RNA transmembrane transporter activity(GO:0051033) |
| 0.0 | 0.1 | GO:0008097 | 5S rRNA binding(GO:0008097) |
| 0.0 | 0.2 | GO:0031210 | phosphatidylcholine binding(GO:0031210) |
| 0.0 | 0.3 | GO:0005540 | hyaluronic acid binding(GO:0005540) |
| 0.0 | 0.1 | GO:0004852 | uroporphyrinogen-III synthase activity(GO:0004852) |
| 0.0 | 0.1 | GO:0005093 | Rab GDP-dissociation inhibitor activity(GO:0005093) |
| 0.0 | 0.2 | GO:0004806 | triglyceride lipase activity(GO:0004806) |
| 0.0 | 0.4 | GO:0008157 | protein phosphatase 1 binding(GO:0008157) |
| 0.0 | 0.3 | GO:0070530 | K63-linked polyubiquitin binding(GO:0070530) |
| 0.0 | 0.1 | GO:0004551 | nucleotide diphosphatase activity(GO:0004551) |
| 0.0 | 0.1 | GO:0045703 | pinocarveol dehydrogenase activity(GO:0018446) chloral hydrate dehydrogenase activity(GO:0018447) hydroxymethylmethylsilanediol oxidase activity(GO:0018448) 1-phenylethanol dehydrogenase activity(GO:0018449) myrtenol dehydrogenase activity(GO:0018450) cis-1,2-dihydroxy-1,2-dihydro-8-carboxynaphthalene dehydrogenase activity(GO:0034522) 3-hydroxy-4-methyloctanoyl-CoA dehydrogenase activity(GO:0034582) 2-hydroxy-4-isopropenylcyclohexane-1-carboxyl-CoA dehydrogenase activity(GO:0034778) cis-9,10-dihydroanthracene-9,10-diol dehydrogenase activity(GO:0034817) citronellol dehydrogenase activity(GO:0034821) naphthyl-2-hydroxymethyl-succinyl-CoA dehydrogenase activity(GO:0034847) 2,4,4-trimethyl-1-pentanol dehydrogenase activity(GO:0034863) 2,4,4-trimethyl-3-hydroxypentanoyl-CoA dehydrogenase activity(GO:0034868) 1-hydroxy-4,4-dimethylpentan-3-one dehydrogenase activity(GO:0034871) endosulfan diol dehydrogenase activity(GO:0034891) endosulfan hydroxyether dehydrogenase activity(GO:0034901) 3-hydroxy-2-methylhexanoyl-CoA dehydrogenase activity(GO:0034918) 3-hydroxy-2,6-dimethyl-5-methylene-heptanoyl-CoA dehydrogenase activity(GO:0034944) versicolorin reductase activity(GO:0042469) ketoreductase activity(GO:0045703) |
| 0.0 | 0.4 | GO:0008093 | cytoskeletal adaptor activity(GO:0008093) |
| 0.0 | 0.6 | GO:0004896 | cytokine receptor activity(GO:0004896) |
| 0.0 | 0.2 | GO:0004198 | calcium-dependent cysteine-type endopeptidase activity(GO:0004198) |
| 0.0 | 0.1 | GO:0034916 | 4-methyloctanoyl-CoA dehydrogenase activity(GO:0034580) naphthyl-2-methyl-succinyl-CoA dehydrogenase activity(GO:0034845) 2-methylhexanoyl-CoA dehydrogenase activity(GO:0034916) propionyl-CoA dehydrogenase activity(GO:0043820) thiol-driven fumarate reductase activity(GO:0043830) coenzyme F420-dependent 2,4,6-trinitrophenol reductase activity(GO:0052758) coenzyme F420-dependent 2,4,6-trinitrophenol hydride reductase activity(GO:0052759) coenzyme F420-dependent 2,4-dinitrophenol reductase activity(GO:0052760) |
| 0.0 | 0.2 | GO:0017017 | MAP kinase tyrosine/serine/threonine phosphatase activity(GO:0017017) |
| 0.0 | 0.4 | GO:0001540 | beta-amyloid binding(GO:0001540) |
| 0.0 | 0.2 | GO:0002162 | dystroglycan binding(GO:0002162) |
| 0.0 | 0.1 | GO:0103116 | alpha-D-galactofuranose transporter activity(GO:0103116) |
| 0.0 | 0.1 | GO:0051880 | G-quadruplex DNA binding(GO:0051880) |
| 0.0 | 0.4 | GO:0004120 | calmodulin-dependent cyclic-nucleotide phosphodiesterase activity(GO:0004117) cGMP-stimulated cyclic-nucleotide phosphodiesterase activity(GO:0004118) cGMP-inhibited cyclic-nucleotide phosphodiesterase activity(GO:0004119) photoreceptor cyclic-nucleotide phosphodiesterase activity(GO:0004120) 7,8-dihydro-D-neopterin 2',3'-cyclic phosphate phosphodiesterase activity(GO:0044688) inositol phosphosphingolipid phospholipase activity(GO:0052712) inositol phosphorylceramide phospholipase activity(GO:0052713) mannosyl-inositol phosphorylceramide phospholipase activity(GO:0052714) mannosyl-diinositol phosphorylceramide phospholipase activity(GO:0052715) |
| 0.0 | 0.5 | GO:0004712 | protein serine/threonine/tyrosine kinase activity(GO:0004712) |
|
|
|
|