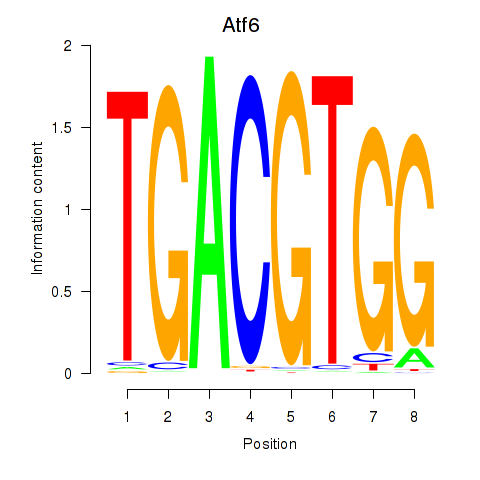
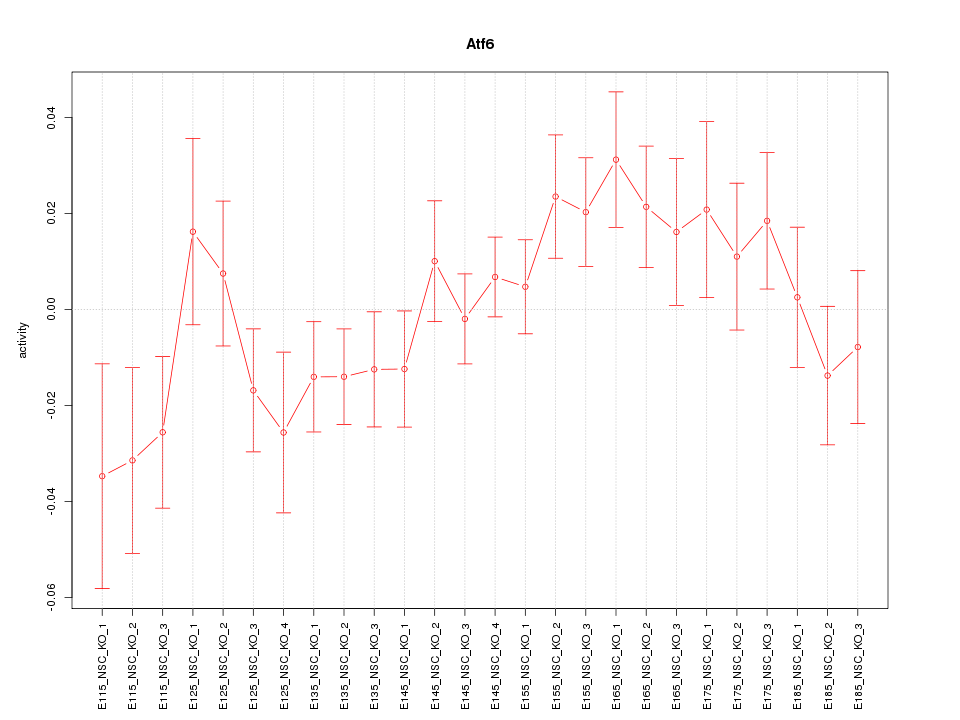
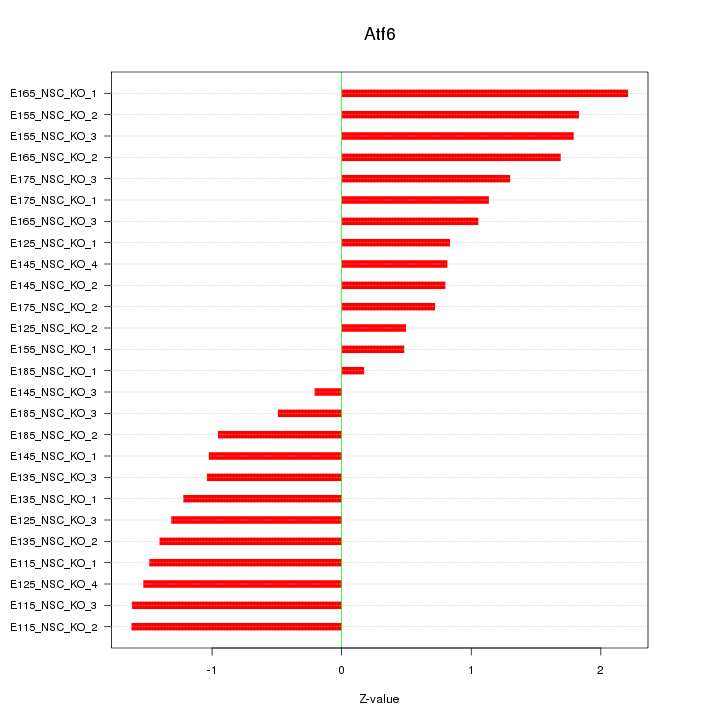
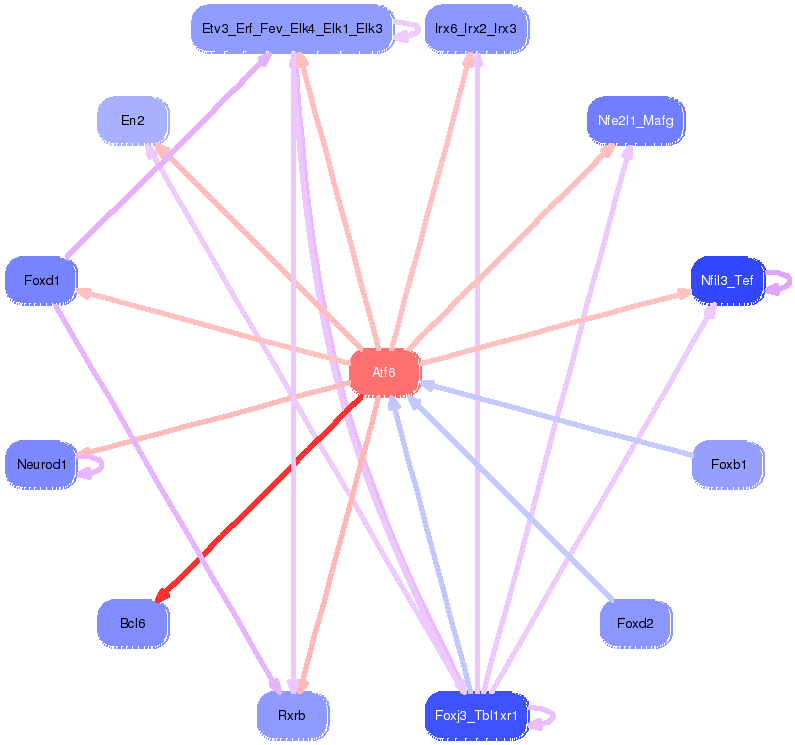
Motif ID: Atf6
Z-value: 1.236
Transcription factors associated with Atf6:
| Gene Symbol | Entrez ID | Gene Name |
|---|---|---|
| Atf6 | ENSMUSG00000026663.6 | Atf6 |
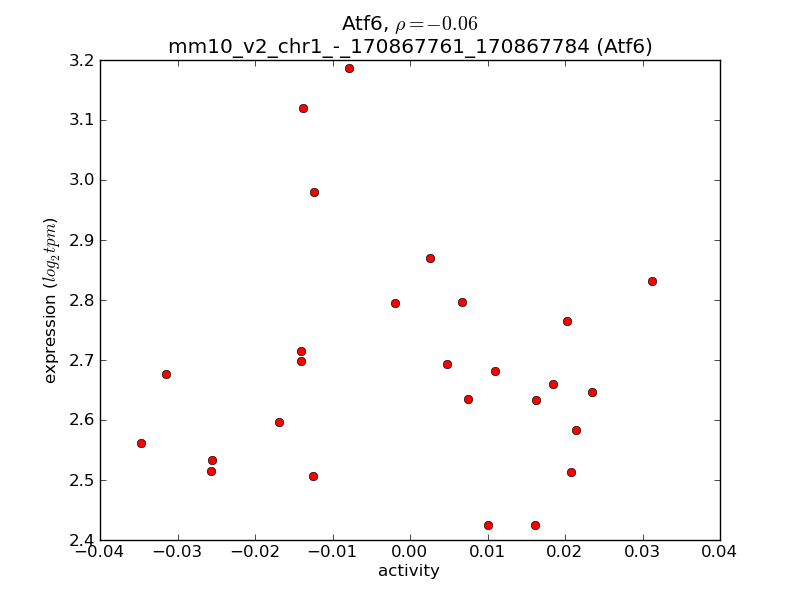
Activity-expression correlation:
| Gene Symbol | Promoter | Pearson corr. coef. | P-value | Plot |
|---|---|---|---|---|
| Atf6 | mm10_v2_chr1_-_170867761_170867784 | -0.06 | 7.6e-01 | Click! |

Top targets:
Gene overrepresentation in biological_process category:
| Log-likelihood per target | Total log-likelihood | Term | Description |
|---|---|---|---|
| 2.6 | 7.7 | GO:0043379 | memory T cell differentiation(GO:0043379) negative regulation of isotype switching to IgE isotypes(GO:0048294) |
| 0.9 | 2.6 | GO:0002159 | desmosome assembly(GO:0002159) |
| 0.8 | 2.5 | GO:0072531 | pyrimidine-containing compound transmembrane transport(GO:0072531) |
| 0.8 | 2.4 | GO:0060478 | acrosomal vesicle exocytosis(GO:0060478) |
| 0.7 | 0.7 | GO:1900170 | negative regulation of glucocorticoid mediated signaling pathway(GO:1900170) |
| 0.6 | 4.9 | GO:0016338 | calcium-independent cell-cell adhesion via plasma membrane cell-adhesion molecules(GO:0016338) |
| 0.6 | 5.1 | GO:0090166 | Golgi disassembly(GO:0090166) |
| 0.5 | 5.7 | GO:0006995 | cellular response to nitrogen starvation(GO:0006995) cellular response to nitrogen levels(GO:0043562) |
| 0.5 | 1.5 | GO:0032513 | negative regulation of protein phosphatase type 2B activity(GO:0032513) |
| 0.4 | 2.2 | GO:0021993 | initiation of neural tube closure(GO:0021993) |
| 0.4 | 2.6 | GO:1902474 | positive regulation of protein localization to synapse(GO:1902474) |
| 0.4 | 2.5 | GO:0019695 | choline metabolic process(GO:0019695) |
| 0.4 | 4.8 | GO:0044387 | negative regulation of protein kinase activity by regulation of protein phosphorylation(GO:0044387) |
| 0.4 | 1.2 | GO:1902219 | regulation of intrinsic apoptotic signaling pathway in response to osmotic stress(GO:1902218) negative regulation of intrinsic apoptotic signaling pathway in response to osmotic stress(GO:1902219) |
| 0.4 | 3.2 | GO:2000301 | negative regulation of synaptic vesicle exocytosis(GO:2000301) |
| 0.4 | 1.9 | GO:1900748 | positive regulation of vascular endothelial growth factor signaling pathway(GO:1900748) |
| 0.4 | 1.4 | GO:0035609 | C-terminal protein deglutamylation(GO:0035609) |
| 0.3 | 1.0 | GO:0070375 | ERK5 cascade(GO:0070375) |
| 0.3 | 8.5 | GO:0090036 | regulation of protein kinase C signaling(GO:0090036) |
| 0.3 | 8.0 | GO:0002091 | negative regulation of receptor internalization(GO:0002091) |
| 0.3 | 5.2 | GO:0014049 | positive regulation of glutamate secretion(GO:0014049) |
| 0.3 | 0.9 | GO:0010248 | B cell negative selection(GO:0002352) establishment or maintenance of transmembrane electrochemical gradient(GO:0010248) regulation of mitochondrial membrane permeability involved in programmed necrotic cell death(GO:1902445) |
| 0.3 | 0.8 | GO:1903774 | positive regulation of viral budding via host ESCRT complex(GO:1903774) |
| 0.3 | 3.9 | GO:0045176 | apical protein localization(GO:0045176) |
| 0.3 | 0.8 | GO:0009298 | GDP-mannose biosynthetic process(GO:0009298) |
| 0.3 | 2.4 | GO:0036371 | protein localization to M-band(GO:0036309) protein localization to T-tubule(GO:0036371) |
| 0.3 | 0.8 | GO:0060075 | regulation of resting membrane potential(GO:0060075) |
| 0.3 | 1.3 | GO:1901678 | iron coordination entity transport(GO:1901678) |
| 0.3 | 1.0 | GO:0070358 | actin polymerization-dependent cell motility(GO:0070358) |
| 0.2 | 3.6 | GO:0002115 | store-operated calcium entry(GO:0002115) |
| 0.2 | 1.4 | GO:0048934 | peripheral nervous system neuron differentiation(GO:0048934) peripheral nervous system neuron development(GO:0048935) positive regulation of glucocorticoid receptor signaling pathway(GO:2000324) |
| 0.2 | 0.7 | GO:0071336 | lung growth(GO:0060437) positive regulation of fat cell proliferation(GO:0070346) regulation of hair follicle cell proliferation(GO:0071336) positive regulation of hair follicle cell proliferation(GO:0071338) |
| 0.2 | 1.3 | GO:0030397 | membrane disassembly(GO:0030397) nuclear envelope disassembly(GO:0051081) |
| 0.2 | 2.6 | GO:0032808 | lacrimal gland development(GO:0032808) |
| 0.2 | 0.9 | GO:0045113 | regulation of integrin biosynthetic process(GO:0045113) |
| 0.2 | 1.0 | GO:1901843 | positive regulation of high voltage-gated calcium channel activity(GO:1901843) |
| 0.2 | 2.2 | GO:0060081 | membrane hyperpolarization(GO:0060081) |
| 0.2 | 10.0 | GO:0007528 | neuromuscular junction development(GO:0007528) |
| 0.2 | 1.2 | GO:2000672 | negative regulation of motor neuron apoptotic process(GO:2000672) |
| 0.2 | 1.3 | GO:0032596 | protein transport into membrane raft(GO:0032596) dsRNA transport(GO:0033227) |
| 0.2 | 0.6 | GO:0060729 | intestinal epithelial structure maintenance(GO:0060729) |
| 0.2 | 0.7 | GO:0051151 | negative regulation of smooth muscle cell differentiation(GO:0051151) |
| 0.2 | 0.5 | GO:0019343 | cysteine biosynthetic process via cystathionine(GO:0019343) cysteine biosynthetic process(GO:0019344) |
| 0.2 | 0.5 | GO:0060266 | negative regulation of respiratory burst involved in inflammatory response(GO:0060266) negative regulation of respiratory burst(GO:0060268) |
| 0.2 | 0.5 | GO:0072076 | nephrogenic mesenchyme development(GO:0072076) |
| 0.2 | 1.2 | GO:0006102 | isocitrate metabolic process(GO:0006102) |
| 0.2 | 2.0 | GO:0043084 | penile erection(GO:0043084) |
| 0.2 | 4.0 | GO:0043496 | regulation of protein homodimerization activity(GO:0043496) |
| 0.2 | 2.9 | GO:0071577 | zinc II ion transmembrane transport(GO:0071577) |
| 0.2 | 0.3 | GO:0036166 | phenotypic switching(GO:0036166) |
| 0.2 | 0.9 | GO:0045629 | negative regulation of T-helper 2 cell differentiation(GO:0045629) |
| 0.1 | 0.6 | GO:0032804 | negative regulation of low-density lipoprotein particle receptor catabolic process(GO:0032804) negative regulation of receptor catabolic process(GO:2000645) |
| 0.1 | 2.0 | GO:0009312 | oligosaccharide biosynthetic process(GO:0009312) |
| 0.1 | 0.4 | GO:0003195 | tricuspid valve development(GO:0003175) tricuspid valve morphogenesis(GO:0003186) tricuspid valve formation(GO:0003195) right ventricular cardiac muscle tissue morphogenesis(GO:0003221) |
| 0.1 | 0.7 | GO:0006689 | ganglioside catabolic process(GO:0006689) |
| 0.1 | 0.7 | GO:0006646 | phosphatidylethanolamine biosynthetic process(GO:0006646) |
| 0.1 | 1.1 | GO:0000395 | mRNA 5'-splice site recognition(GO:0000395) |
| 0.1 | 0.8 | GO:0006488 | dolichol-linked oligosaccharide biosynthetic process(GO:0006488) |
| 0.1 | 0.4 | GO:0032055 | negative regulation of translation in response to stress(GO:0032055) |
| 0.1 | 0.5 | GO:0010891 | negative regulation of sequestering of triglyceride(GO:0010891) |
| 0.1 | 0.4 | GO:0034035 | purine ribonucleoside bisphosphate metabolic process(GO:0034035) |
| 0.1 | 1.9 | GO:0042659 | regulation of cell fate specification(GO:0042659) |
| 0.1 | 5.2 | GO:0006506 | GPI anchor biosynthetic process(GO:0006506) |
| 0.1 | 0.4 | GO:0010756 | positive regulation of plasminogen activation(GO:0010756) |
| 0.1 | 0.6 | GO:0030539 | male genitalia development(GO:0030539) |
| 0.1 | 1.0 | GO:1904153 | negative regulation of protein exit from endoplasmic reticulum(GO:0070862) negative regulation of retrograde protein transport, ER to cytosol(GO:1904153) |
| 0.1 | 0.5 | GO:0044828 | negative regulation by host of viral genome replication(GO:0044828) |
| 0.1 | 0.5 | GO:0045347 | negative regulation of MHC class II biosynthetic process(GO:0045347) |
| 0.1 | 1.2 | GO:0043252 | sodium-independent organic anion transport(GO:0043252) |
| 0.1 | 2.1 | GO:0055012 | ventricular cardiac muscle cell differentiation(GO:0055012) |
| 0.1 | 0.3 | GO:0090529 | barrier septum assembly(GO:0000917) cell septum assembly(GO:0090529) |
| 0.1 | 0.3 | GO:0009405 | pathogenesis(GO:0009405) |
| 0.1 | 3.1 | GO:0007094 | mitotic spindle assembly checkpoint(GO:0007094) |
| 0.1 | 0.4 | GO:0045716 | positive regulation of low-density lipoprotein particle receptor biosynthetic process(GO:0045716) |
| 0.1 | 0.4 | GO:0021914 | negative regulation of smoothened signaling pathway involved in ventral spinal cord patterning(GO:0021914) |
| 0.1 | 0.7 | GO:0030578 | PML body organization(GO:0030578) |
| 0.1 | 0.3 | GO:0018158 | protein oxidation(GO:0018158) |
| 0.1 | 1.0 | GO:0033572 | transferrin transport(GO:0033572) |
| 0.1 | 0.4 | GO:0071947 | protein deubiquitination involved in ubiquitin-dependent protein catabolic process(GO:0071947) |
| 0.1 | 1.4 | GO:0035641 | locomotory exploration behavior(GO:0035641) |
| 0.1 | 0.9 | GO:0045217 | cell-cell junction maintenance(GO:0045217) |
| 0.1 | 0.5 | GO:0006046 | N-acetylglucosamine catabolic process(GO:0006046) |
| 0.1 | 1.3 | GO:2000311 | regulation of alpha-amino-3-hydroxy-5-methyl-4-isoxazole propionate selective glutamate receptor activity(GO:2000311) |
| 0.1 | 0.4 | GO:1902255 | positive regulation of intrinsic apoptotic signaling pathway by p53 class mediator(GO:1902255) |
| 0.1 | 0.7 | GO:2000310 | regulation of N-methyl-D-aspartate selective glutamate receptor activity(GO:2000310) |
| 0.1 | 0.4 | GO:2000643 | positive regulation of early endosome to late endosome transport(GO:2000643) |
| 0.1 | 1.5 | GO:0071378 | growth hormone receptor signaling pathway(GO:0060396) cellular response to growth hormone stimulus(GO:0071378) |
| 0.1 | 0.9 | GO:0007216 | G-protein coupled glutamate receptor signaling pathway(GO:0007216) |
| 0.1 | 1.0 | GO:0030157 | pancreatic juice secretion(GO:0030157) |
| 0.1 | 1.4 | GO:0007289 | spermatid nucleus differentiation(GO:0007289) |
| 0.1 | 0.5 | GO:0051611 | negative regulation of neurotransmitter uptake(GO:0051581) serotonin uptake(GO:0051610) regulation of serotonin uptake(GO:0051611) negative regulation of serotonin uptake(GO:0051612) |
| 0.1 | 0.9 | GO:0044144 | regulation of growth of symbiont in host(GO:0044126) modulation of growth of symbiont involved in interaction with host(GO:0044144) |
| 0.1 | 0.9 | GO:0010758 | regulation of macrophage chemotaxis(GO:0010758) |
| 0.1 | 0.3 | GO:0000103 | sulfate assimilation(GO:0000103) |
| 0.1 | 0.1 | GO:0003253 | cardiac neural crest cell migration involved in outflow tract morphogenesis(GO:0003253) regulation of oxidative phosphorylation uncoupler activity(GO:2000275) |
| 0.1 | 0.2 | GO:0045014 | detection of carbohydrate stimulus(GO:0009730) detection of hexose stimulus(GO:0009732) detection of monosaccharide stimulus(GO:0034287) carbon catabolite repression of transcription(GO:0045013) negative regulation of transcription by glucose(GO:0045014) detection of glucose(GO:0051594) |
| 0.1 | 2.5 | GO:0001919 | regulation of receptor recycling(GO:0001919) |
| 0.1 | 0.1 | GO:0061144 | alveolar secondary septum development(GO:0061144) |
| 0.1 | 0.7 | GO:0030828 | positive regulation of cGMP biosynthetic process(GO:0030828) |
| 0.1 | 1.4 | GO:0071385 | cellular response to glucocorticoid stimulus(GO:0071385) |
| 0.1 | 0.4 | GO:0043153 | entrainment of circadian clock by photoperiod(GO:0043153) |
| 0.1 | 0.9 | GO:0014898 | muscle hypertrophy in response to stress(GO:0003299) cardiac muscle hypertrophy in response to stress(GO:0014898) |
| 0.1 | 0.2 | GO:0071072 | negative regulation of phospholipid biosynthetic process(GO:0071072) |
| 0.1 | 1.1 | GO:0035025 | positive regulation of Rho protein signal transduction(GO:0035025) |
| 0.1 | 0.7 | GO:1990403 | embryonic brain development(GO:1990403) |
| 0.1 | 0.2 | GO:0048133 | germ-line stem cell division(GO:0042078) male germ-line stem cell asymmetric division(GO:0048133) germline stem cell asymmetric division(GO:0098728) |
| 0.0 | 2.0 | GO:0036465 | synaptic vesicle recycling(GO:0036465) |
| 0.0 | 0.4 | GO:0006104 | succinyl-CoA metabolic process(GO:0006104) |
| 0.0 | 0.5 | GO:0009404 | toxin metabolic process(GO:0009404) |
| 0.0 | 0.8 | GO:0006896 | Golgi to vacuole transport(GO:0006896) |
| 0.0 | 0.5 | GO:0050774 | negative regulation of dendrite morphogenesis(GO:0050774) |
| 0.0 | 0.7 | GO:0043552 | positive regulation of phosphatidylinositol 3-kinase activity(GO:0043552) |
| 0.0 | 0.9 | GO:0010107 | potassium ion import(GO:0010107) |
| 0.0 | 0.2 | GO:0002553 | histamine production involved in inflammatory response(GO:0002349) histamine secretion involved in inflammatory response(GO:0002441) histamine secretion by mast cell(GO:0002553) |
| 0.0 | 0.1 | GO:1903378 | positive regulation of oxidative stress-induced neuron intrinsic apoptotic signaling pathway(GO:1903378) |
| 0.0 | 0.7 | GO:0007614 | short-term memory(GO:0007614) locomotion involved in locomotory behavior(GO:0031987) |
| 0.0 | 1.1 | GO:0015991 | energy coupled proton transmembrane transport, against electrochemical gradient(GO:0015988) ATP hydrolysis coupled proton transport(GO:0015991) ATP hydrolysis coupled transmembrane transport(GO:0090662) |
| 0.0 | 2.4 | GO:0030433 | ER-associated ubiquitin-dependent protein catabolic process(GO:0030433) |
| 0.0 | 2.2 | GO:0010923 | negative regulation of phosphatase activity(GO:0010923) |
| 0.0 | 0.2 | GO:0090091 | positive regulation of extracellular matrix disassembly(GO:0090091) |
| 0.0 | 0.2 | GO:0032261 | purine nucleotide salvage(GO:0032261) IMP salvage(GO:0032264) |
| 0.0 | 0.9 | GO:0016578 | histone deubiquitination(GO:0016578) |
| 0.0 | 0.3 | GO:0006614 | SRP-dependent cotranslational protein targeting to membrane(GO:0006614) |
| 0.0 | 1.8 | GO:0045669 | positive regulation of osteoblast differentiation(GO:0045669) |
| 0.0 | 0.3 | GO:0048711 | positive regulation of astrocyte differentiation(GO:0048711) |
| 0.0 | 0.2 | GO:0006620 | posttranslational protein targeting to membrane(GO:0006620) |
| 0.0 | 0.8 | GO:0031146 | SCF-dependent proteasomal ubiquitin-dependent protein catabolic process(GO:0031146) |
| 0.0 | 0.9 | GO:0045746 | negative regulation of Notch signaling pathway(GO:0045746) |
| 0.0 | 0.9 | GO:0007498 | mesoderm development(GO:0007498) |
| 0.0 | 1.6 | GO:0000045 | autophagosome assembly(GO:0000045) |
| 0.0 | 0.2 | GO:0048199 | vesicle targeting, to, from or within Golgi(GO:0048199) |
| 0.0 | 0.2 | GO:0048742 | regulation of skeletal muscle fiber development(GO:0048742) |
| 0.0 | 0.4 | GO:0031290 | retinal ganglion cell axon guidance(GO:0031290) |
| 0.0 | 0.6 | GO:0009268 | response to pH(GO:0009268) |
| 0.0 | 3.9 | GO:0043547 | positive regulation of GTPase activity(GO:0043547) |
| 0.0 | 0.6 | GO:0014044 | Schwann cell development(GO:0014044) myelination in peripheral nervous system(GO:0022011) peripheral nervous system axon ensheathment(GO:0032292) |
| 0.0 | 0.5 | GO:0051703 | social behavior(GO:0035176) intraspecies interaction between organisms(GO:0051703) |
| 0.0 | 0.3 | GO:0000188 | inactivation of MAPK activity(GO:0000188) |
| 0.0 | 0.5 | GO:0001829 | trophectodermal cell differentiation(GO:0001829) |
| 0.0 | 0.1 | GO:1902031 | regulation of NADP metabolic process(GO:1902031) |
| 0.0 | 0.5 | GO:0030488 | tRNA methylation(GO:0030488) |
| 0.0 | 0.4 | GO:0030513 | positive regulation of BMP signaling pathway(GO:0030513) |
| 0.0 | 0.3 | GO:0009191 | ribonucleoside diphosphate catabolic process(GO:0009191) |
| 0.0 | 0.7 | GO:0000381 | regulation of alternative mRNA splicing, via spliceosome(GO:0000381) |
| 0.0 | 4.5 | GO:0034765 | regulation of ion transmembrane transport(GO:0034765) |
| 0.0 | 0.6 | GO:0045739 | positive regulation of DNA repair(GO:0045739) |
| 0.0 | 0.5 | GO:0031935 | regulation of chromatin silencing(GO:0031935) |
| 0.0 | 0.6 | GO:0045761 | regulation of adenylate cyclase activity(GO:0045761) |
| 0.0 | 1.0 | GO:0001935 | endothelial cell proliferation(GO:0001935) |
| 0.0 | 2.1 | GO:0032869 | cellular response to insulin stimulus(GO:0032869) |
| 0.0 | 0.2 | GO:0035116 | embryonic hindlimb morphogenesis(GO:0035116) |
| 0.0 | 0.4 | GO:0000027 | ribosomal large subunit assembly(GO:0000027) |
| 0.0 | 0.7 | GO:0032755 | positive regulation of interleukin-6 production(GO:0032755) |
| 0.0 | 0.5 | GO:0071300 | cellular response to retinoic acid(GO:0071300) |
| 0.0 | 0.3 | GO:0030318 | melanocyte differentiation(GO:0030318) |
| 0.0 | 0.7 | GO:0006418 | tRNA aminoacylation for protein translation(GO:0006418) |
| 0.0 | 0.2 | GO:0043968 | histone H2A acetylation(GO:0043968) |
| 0.0 | 0.1 | GO:0051503 | adenine nucleotide transport(GO:0051503) |
| 0.0 | 0.3 | GO:0050435 | beta-amyloid metabolic process(GO:0050435) |
| 0.0 | 1.4 | GO:0010771 | negative regulation of cell morphogenesis involved in differentiation(GO:0010771) |
| 0.0 | 0.3 | GO:0005978 | glycogen biosynthetic process(GO:0005978) glucan biosynthetic process(GO:0009250) |
| 0.0 | 0.3 | GO:0071480 | cellular response to gamma radiation(GO:0071480) |
| 0.0 | 0.5 | GO:0051592 | response to calcium ion(GO:0051592) |
Gene overrepresentation in cellular_component category:
| Log-likelihood per target | Total log-likelihood | Term | Description |
|---|---|---|---|
| 0.6 | 6.4 | GO:0043083 | synaptic cleft(GO:0043083) |
| 0.5 | 2.4 | GO:0005784 | Sec61 translocon complex(GO:0005784) translocon complex(GO:0071256) |
| 0.4 | 3.1 | GO:0005827 | polar microtubule(GO:0005827) |
| 0.3 | 5.2 | GO:0000506 | glycosylphosphatidylinositol-N-acetylglucosaminyltransferase (GPI-GnT) complex(GO:0000506) |
| 0.3 | 5.7 | GO:0000421 | autophagosome membrane(GO:0000421) |
| 0.3 | 0.8 | GO:1990316 | ATG1/ULK1 kinase complex(GO:1990316) |
| 0.3 | 1.4 | GO:0038039 | G-protein coupled receptor heterodimeric complex(GO:0038039) |
| 0.3 | 0.3 | GO:0042827 | platelet dense granule(GO:0042827) |
| 0.3 | 1.3 | GO:0070044 | synaptobrevin 2-SNAP-25-syntaxin-1a complex(GO:0070044) |
| 0.2 | 4.9 | GO:0016327 | apicolateral plasma membrane(GO:0016327) |
| 0.2 | 2.1 | GO:0000813 | ESCRT I complex(GO:0000813) |
| 0.2 | 3.2 | GO:0031045 | dense core granule(GO:0031045) |
| 0.2 | 10.1 | GO:0005834 | heterotrimeric G-protein complex(GO:0005834) |
| 0.2 | 1.3 | GO:0060053 | neurofilament cytoskeleton(GO:0060053) |
| 0.1 | 12.6 | GO:0031594 | neuromuscular junction(GO:0031594) |
| 0.1 | 0.7 | GO:0042582 | primary lysosome(GO:0005766) azurophil granule(GO:0042582) |
| 0.1 | 1.8 | GO:0032580 | Golgi cisterna membrane(GO:0032580) |
| 0.1 | 1.0 | GO:0097136 | Bcl-2 family protein complex(GO:0097136) |
| 0.1 | 5.3 | GO:0030667 | secretory granule membrane(GO:0030667) |
| 0.1 | 0.5 | GO:0001652 | granular component(GO:0001652) |
| 0.1 | 5.4 | GO:0031201 | SNARE complex(GO:0031201) |
| 0.1 | 2.4 | GO:0097038 | perinuclear endoplasmic reticulum(GO:0097038) |
| 0.1 | 0.5 | GO:0032541 | cortical endoplasmic reticulum(GO:0032541) |
| 0.1 | 2.4 | GO:0031430 | M band(GO:0031430) |
| 0.1 | 1.1 | GO:0033179 | proton-transporting V-type ATPase, V0 domain(GO:0033179) |
| 0.1 | 0.7 | GO:0071541 | eukaryotic translation initiation factor 3 complex, eIF3m(GO:0071541) |
| 0.1 | 1.3 | GO:0032279 | asymmetric synapse(GO:0032279) |
| 0.1 | 7.0 | GO:0008076 | voltage-gated potassium channel complex(GO:0008076) |
| 0.1 | 0.3 | GO:0097413 | Lewy body(GO:0097413) |
| 0.1 | 6.2 | GO:0005657 | replication fork(GO:0005657) |
| 0.1 | 0.9 | GO:0000124 | SAGA complex(GO:0000124) |
| 0.1 | 1.2 | GO:0012510 | trans-Golgi network transport vesicle membrane(GO:0012510) |
| 0.1 | 0.6 | GO:0070552 | BRISC complex(GO:0070552) |
| 0.1 | 0.7 | GO:0016272 | prefoldin complex(GO:0016272) |
| 0.1 | 0.5 | GO:0072357 | PTW/PP1 phosphatase complex(GO:0072357) |
| 0.1 | 1.7 | GO:0035371 | microtubule plus-end(GO:0035371) |
| 0.1 | 12.9 | GO:0030426 | growth cone(GO:0030426) |
| 0.1 | 0.8 | GO:0030126 | COPI vesicle coat(GO:0030126) |
| 0.1 | 0.2 | GO:0045334 | clathrin-coated endocytic vesicle(GO:0045334) |
| 0.0 | 0.5 | GO:0005788 | endoplasmic reticulum lumen(GO:0005788) |
| 0.0 | 0.4 | GO:0045252 | oxoglutarate dehydrogenase complex(GO:0045252) |
| 0.0 | 0.3 | GO:0005964 | phosphorylase kinase complex(GO:0005964) |
| 0.0 | 0.3 | GO:0005786 | signal recognition particle, endoplasmic reticulum targeting(GO:0005786) signal recognition particle(GO:0048500) |
| 0.0 | 1.3 | GO:0035145 | exon-exon junction complex(GO:0035145) |
| 0.0 | 0.1 | GO:1990730 | VCP-NSFL1C complex(GO:1990730) |
| 0.0 | 1.4 | GO:0030315 | T-tubule(GO:0030315) |
| 0.0 | 1.1 | GO:0016592 | mediator complex(GO:0016592) |
| 0.0 | 2.0 | GO:0005905 | clathrin-coated pit(GO:0005905) |
| 0.0 | 1.5 | GO:0034704 | calcium channel complex(GO:0034704) |
| 0.0 | 0.4 | GO:0016235 | aggresome(GO:0016235) |
| 0.0 | 2.1 | GO:0032587 | ruffle membrane(GO:0032587) |
| 0.0 | 0.2 | GO:0030008 | TRAPP complex(GO:0030008) |
| 0.0 | 14.3 | GO:0043025 | neuronal cell body(GO:0043025) |
| 0.0 | 0.1 | GO:0097433 | dense body(GO:0097433) |
| 0.0 | 4.8 | GO:0097060 | synaptic membrane(GO:0097060) |
| 0.0 | 0.9 | GO:0005776 | autophagosome(GO:0005776) |
| 0.0 | 0.2 | GO:0005798 | Golgi-associated vesicle(GO:0005798) |
| 0.0 | 0.3 | GO:0017119 | Golgi transport complex(GO:0017119) |
| 0.0 | 0.3 | GO:0043034 | costamere(GO:0043034) |
| 0.0 | 0.2 | GO:0030285 | integral component of synaptic vesicle membrane(GO:0030285) intrinsic component of synaptic vesicle membrane(GO:0098563) |
| 0.0 | 0.7 | GO:0030119 | AP-type membrane coat adaptor complex(GO:0030119) |
| 0.0 | 0.2 | GO:0001739 | sex chromatin(GO:0001739) |
| 0.0 | 4.4 | GO:0031252 | cell leading edge(GO:0031252) |
| 0.0 | 3.0 | GO:0043209 | myelin sheath(GO:0043209) |
| 0.0 | 0.6 | GO:0030864 | cortical actin cytoskeleton(GO:0030864) |
| 0.0 | 0.2 | GO:0097542 | ciliary tip(GO:0097542) |
| 0.0 | 0.4 | GO:0005811 | lipid particle(GO:0005811) |
| 0.0 | 0.3 | GO:0005884 | actin filament(GO:0005884) |
| 0.0 | 0.5 | GO:0005881 | cytoplasmic microtubule(GO:0005881) |
| 0.0 | 0.8 | GO:0019005 | SCF ubiquitin ligase complex(GO:0019005) |
| 0.0 | 0.5 | GO:0022627 | cytosolic small ribosomal subunit(GO:0022627) |
| 0.0 | 0.3 | GO:0005795 | Golgi stack(GO:0005795) |
| 0.0 | 0.6 | GO:0031519 | PcG protein complex(GO:0031519) |
Gene overrepresentation in molecular_function category:
| Log-likelihood per target | Total log-likelihood | Term | Description |
|---|---|---|---|
| 0.8 | 3.1 | GO:0005483 | soluble NSF attachment protein activity(GO:0005483) |
| 0.6 | 7.7 | GO:0001161 | intronic transcription regulatory region sequence-specific DNA binding(GO:0001161) |
| 0.6 | 2.5 | GO:0004104 | cholinesterase activity(GO:0004104) choline binding(GO:0033265) |
| 0.5 | 4.8 | GO:0017176 | phosphatidylinositol N-acetylglucosaminyltransferase activity(GO:0017176) |
| 0.4 | 1.2 | GO:0005128 | erythropoietin receptor binding(GO:0005128) |
| 0.4 | 1.2 | GO:0004449 | isocitrate dehydrogenase (NAD+) activity(GO:0004449) |
| 0.4 | 3.8 | GO:0031749 | D2 dopamine receptor binding(GO:0031749) |
| 0.4 | 3.0 | GO:0008429 | phosphatidylethanolamine binding(GO:0008429) |
| 0.4 | 2.6 | GO:0004971 | AMPA glutamate receptor activity(GO:0004971) |
| 0.3 | 0.7 | GO:0004103 | choline kinase activity(GO:0004103) |
| 0.3 | 1.7 | GO:0061676 | importin-alpha family protein binding(GO:0061676) |
| 0.3 | 1.3 | GO:0070012 | oligopeptidase activity(GO:0070012) |
| 0.3 | 4.0 | GO:0015279 | store-operated calcium channel activity(GO:0015279) |
| 0.3 | 2.6 | GO:0035184 | histone threonine kinase activity(GO:0035184) |
| 0.3 | 1.8 | GO:0030375 | thyroid hormone receptor coactivator activity(GO:0030375) |
| 0.3 | 0.9 | GO:0016715 | oxidoreductase activity, acting on paired donors, with incorporation or reduction of molecular oxygen, reduced ascorbate as one donor, and incorporation of one atom of oxygen(GO:0016715) |
| 0.3 | 1.5 | GO:0008269 | JAK pathway signal transduction adaptor activity(GO:0008269) |
| 0.3 | 1.4 | GO:0005030 | neurotrophin receptor activity(GO:0005030) |
| 0.3 | 4.8 | GO:0097371 | MDM2/MDM4 family protein binding(GO:0097371) |
| 0.3 | 1.4 | GO:0015467 | G-protein activated inward rectifier potassium channel activity(GO:0015467) |
| 0.3 | 1.0 | GO:0051434 | BH3 domain binding(GO:0051434) |
| 0.2 | 0.7 | GO:0030249 | guanylate cyclase regulator activity(GO:0030249) |
| 0.2 | 1.4 | GO:0004965 | G-protein coupled GABA receptor activity(GO:0004965) |
| 0.2 | 2.2 | GO:0008140 | cAMP response element binding protein binding(GO:0008140) |
| 0.2 | 1.7 | GO:0008499 | UDP-galactose:beta-N-acetylglucosamine beta-1,3-galactosyltransferase activity(GO:0008499) |
| 0.2 | 1.0 | GO:0045545 | syndecan binding(GO:0045545) |
| 0.2 | 0.7 | GO:0005111 | type 2 fibroblast growth factor receptor binding(GO:0005111) |
| 0.2 | 0.5 | GO:0098809 | nitrite reductase activity(GO:0098809) |
| 0.2 | 0.9 | GO:0001640 | adenylate cyclase inhibiting G-protein coupled glutamate receptor activity(GO:0001640) |
| 0.2 | 1.0 | GO:0004691 | cAMP-dependent protein kinase activity(GO:0004691) |
| 0.2 | 1.9 | GO:0005159 | insulin-like growth factor receptor binding(GO:0005159) |
| 0.2 | 1.4 | GO:0031811 | G-protein coupled nucleotide receptor binding(GO:0031811) P2Y1 nucleotide receptor binding(GO:0031812) |
| 0.2 | 0.5 | GO:0042289 | MHC class II protein binding(GO:0042289) |
| 0.2 | 2.7 | GO:0051864 | histone demethylase activity (H3-K36 specific)(GO:0051864) |
| 0.2 | 2.7 | GO:0050811 | GABA receptor binding(GO:0050811) |
| 0.1 | 0.4 | GO:0005001 | transmembrane receptor protein tyrosine phosphatase activity(GO:0005001) |
| 0.1 | 2.5 | GO:0015215 | nucleotide transmembrane transporter activity(GO:0015215) |
| 0.1 | 0.7 | GO:0004563 | beta-N-acetylhexosaminidase activity(GO:0004563) |
| 0.1 | 3.7 | GO:0001786 | phosphatidylserine binding(GO:0001786) |
| 0.1 | 3.8 | GO:0005251 | delayed rectifier potassium channel activity(GO:0005251) |
| 0.1 | 5.3 | GO:0005158 | insulin receptor binding(GO:0005158) |
| 0.1 | 1.2 | GO:0015347 | sodium-independent organic anion transmembrane transporter activity(GO:0015347) |
| 0.1 | 1.3 | GO:0005242 | inward rectifier potassium channel activity(GO:0005242) |
| 0.1 | 0.3 | GO:0047066 | phospholipid-hydroperoxide glutathione peroxidase activity(GO:0047066) |
| 0.1 | 1.1 | GO:0050733 | RS domain binding(GO:0050733) |
| 0.1 | 0.7 | GO:0008597 | calcium-dependent protein serine/threonine phosphatase regulator activity(GO:0008597) |
| 0.1 | 1.5 | GO:0019855 | calcium channel inhibitor activity(GO:0019855) |
| 0.1 | 2.8 | GO:0005385 | zinc ion transmembrane transporter activity(GO:0005385) |
| 0.1 | 1.8 | GO:0003924 | GTPase activity(GO:0003924) |
| 0.1 | 0.4 | GO:0071074 | eukaryotic initiation factor eIF2 binding(GO:0071074) |
| 0.1 | 3.4 | GO:0005154 | epidermal growth factor receptor binding(GO:0005154) |
| 0.1 | 2.0 | GO:0005184 | neuropeptide hormone activity(GO:0005184) |
| 0.1 | 0.4 | GO:0004582 | dolichyl-phosphate beta-D-mannosyltransferase activity(GO:0004582) |
| 0.1 | 3.6 | GO:0005484 | SNAP receptor activity(GO:0005484) |
| 0.1 | 0.6 | GO:0042043 | neurexin family protein binding(GO:0042043) |
| 0.1 | 2.4 | GO:0005246 | calcium channel regulator activity(GO:0005246) |
| 0.1 | 2.4 | GO:0008093 | cytoskeletal adaptor activity(GO:0008093) |
| 0.1 | 1.4 | GO:0004181 | metallocarboxypeptidase activity(GO:0004181) |
| 0.1 | 2.4 | GO:0005544 | calcium-dependent phospholipid binding(GO:0005544) |
| 0.1 | 1.2 | GO:0004190 | aspartic-type endopeptidase activity(GO:0004190) aspartic-type peptidase activity(GO:0070001) |
| 0.1 | 0.4 | GO:0034602 | oxoglutarate dehydrogenase (NAD+) activity(GO:0034602) |
| 0.1 | 0.6 | GO:0048406 | nerve growth factor binding(GO:0048406) |
| 0.1 | 1.0 | GO:0005104 | fibroblast growth factor receptor binding(GO:0005104) |
| 0.1 | 6.7 | GO:0004860 | protein kinase inhibitor activity(GO:0004860) |
| 0.1 | 0.8 | GO:0016868 | intramolecular transferase activity, phosphotransferases(GO:0016868) |
| 0.1 | 0.2 | GO:0004616 | phosphogluconate dehydrogenase (decarboxylating) activity(GO:0004616) |
| 0.1 | 0.9 | GO:0015248 | sterol transporter activity(GO:0015248) |
| 0.1 | 0.3 | GO:0002094 | polyprenyltransferase activity(GO:0002094) |
| 0.1 | 0.5 | GO:0005234 | extracellular-glutamate-gated ion channel activity(GO:0005234) |
| 0.1 | 1.1 | GO:0005545 | 1-phosphatidylinositol binding(GO:0005545) |
| 0.1 | 0.2 | GO:0047192 | 1-alkylglycerophosphocholine O-acetyltransferase activity(GO:0047192) |
| 0.1 | 0.3 | GO:0008312 | 7S RNA binding(GO:0008312) |
| 0.1 | 0.3 | GO:0046976 | histone methyltransferase activity (H3-K27 specific)(GO:0046976) |
| 0.1 | 0.3 | GO:0004382 | guanosine-diphosphatase activity(GO:0004382) |
| 0.0 | 0.4 | GO:0004779 | sulfate adenylyltransferase activity(GO:0004779) |
| 0.0 | 0.7 | GO:0044183 | protein binding involved in protein folding(GO:0044183) |
| 0.0 | 0.8 | GO:0070566 | adenylyltransferase activity(GO:0070566) |
| 0.0 | 0.8 | GO:0004707 | MAP kinase activity(GO:0004707) |
| 0.0 | 0.3 | GO:0004689 | phosphorylase kinase activity(GO:0004689) |
| 0.0 | 1.1 | GO:0046961 | proton-transporting ATPase activity, rotational mechanism(GO:0046961) |
| 0.0 | 0.5 | GO:0008301 | DNA binding, bending(GO:0008301) |
| 0.0 | 2.0 | GO:0004497 | monooxygenase activity(GO:0004497) |
| 0.0 | 0.6 | GO:0005035 | tumor necrosis factor-activated receptor activity(GO:0005031) death receptor activity(GO:0005035) |
| 0.0 | 0.9 | GO:0030742 | GTP-dependent protein binding(GO:0030742) |
| 0.0 | 0.6 | GO:0005247 | voltage-gated chloride channel activity(GO:0005247) |
| 0.0 | 0.2 | GO:0003876 | AMP deaminase activity(GO:0003876) adenosine-phosphate deaminase activity(GO:0047623) |
| 0.0 | 0.6 | GO:0008179 | adenylate cyclase binding(GO:0008179) |
| 0.0 | 1.2 | GO:0004709 | MAP kinase kinase kinase activity(GO:0004709) |
| 0.0 | 0.3 | GO:0015643 | toxic substance binding(GO:0015643) |
| 0.0 | 1.5 | GO:0061631 | ubiquitin conjugating enzyme activity(GO:0061631) |
| 0.0 | 0.8 | GO:0080025 | phosphatidylinositol-3,5-bisphosphate binding(GO:0080025) |
| 0.0 | 1.6 | GO:0048306 | calcium-dependent protein binding(GO:0048306) |
| 0.0 | 0.5 | GO:0004198 | calcium-dependent cysteine-type endopeptidase activity(GO:0004198) |
| 0.0 | 0.1 | GO:0004471 | malic enzyme activity(GO:0004470) malate dehydrogenase (decarboxylating) (NAD+) activity(GO:0004471) |
| 0.0 | 1.0 | GO:0005179 | hormone activity(GO:0005179) |
| 0.0 | 1.7 | GO:0031593 | polyubiquitin binding(GO:0031593) |
| 0.0 | 1.0 | GO:0004864 | protein phosphatase inhibitor activity(GO:0004864) |
| 0.0 | 1.3 | GO:0001105 | RNA polymerase II transcription coactivator activity(GO:0001105) |
| 0.0 | 0.4 | GO:0042800 | histone methyltransferase activity (H3-K4 specific)(GO:0042800) |
| 0.0 | 2.1 | GO:0101005 | thiol-dependent ubiquitinyl hydrolase activity(GO:0036459) ubiquitinyl hydrolase activity(GO:0101005) |
| 0.0 | 1.2 | GO:0019003 | GDP binding(GO:0019003) |
| 0.0 | 0.4 | GO:0070577 | lysine-acetylated histone binding(GO:0070577) |
| 0.0 | 0.3 | GO:0034450 | ubiquitin-ubiquitin ligase activity(GO:0034450) |
| 0.0 | 4.1 | GO:0061630 | ubiquitin protein ligase activity(GO:0061630) |
| 0.0 | 5.5 | GO:0005096 | GTPase activator activity(GO:0005096) |
| 0.0 | 0.2 | GO:0001206 | transcriptional repressor activity, RNA polymerase II distal enhancer sequence-specific binding(GO:0001206) |
| 0.0 | 0.4 | GO:0001102 | RNA polymerase II activating transcription factor binding(GO:0001102) |
| 0.0 | 0.7 | GO:0004812 | aminoacyl-tRNA ligase activity(GO:0004812) |
| 0.0 | 0.8 | GO:0016765 | transferase activity, transferring alkyl or aryl (other than methyl) groups(GO:0016765) |
| 0.0 | 1.4 | GO:0008565 | protein transporter activity(GO:0008565) |
| 0.0 | 0.7 | GO:0035496 | UDP-glucose:glycoprotein glucosyltransferase activity(GO:0003980) O antigen polymerase activity(GO:0008755) lipopolysaccharide-1,6-galactosyltransferase activity(GO:0008921) cellulose synthase activity(GO:0016759) 9-phenanthrol UDP-glucuronosyltransferase activity(GO:0018715) 1-phenanthrol glycosyltransferase activity(GO:0018716) 9-phenanthrol glycosyltransferase activity(GO:0018717) 1,2-dihydroxy-phenanthrene glycosyltransferase activity(GO:0018718) phenanthrol glycosyltransferase activity(GO:0019112) alpha-1,2-galactosyltransferase activity(GO:0031278) dolichyl pyrophosphate Man7GlcNAc2 alpha-1,3-glucosyltransferase activity(GO:0033556) endogalactosaminidase activity(GO:0033931) lipopolysaccharide-1,5-galactosyltransferase activity(GO:0035496) dolichyl pyrophosphate Glc1Man9GlcNAc2 alpha-1,3-glucosyltransferase activity(GO:0042283) inositol phosphoceramide synthase activity(GO:0045140) alpha-(1->3)-fucosyltransferase activity(GO:0046920) indole-3-butyrate beta-glucosyltransferase activity(GO:0052638) salicylic acid glucosyltransferase (ester-forming) activity(GO:0052639) salicylic acid glucosyltransferase (glucoside-forming) activity(GO:0052640) benzoic acid glucosyltransferase activity(GO:0052641) chondroitin hydrolase activity(GO:0052757) dolichyl-pyrophosphate Man7GlcNAc2 alpha-1,6-mannosyltransferase activity(GO:0052824) cytokinin 9-beta-glucosyltransferase activity(GO:0080062) |
| 0.0 | 0.3 | GO:0008330 | protein tyrosine/threonine phosphatase activity(GO:0008330) |
| 0.0 | 2.4 | GO:0004842 | ubiquitin-protein transferase activity(GO:0004842) |