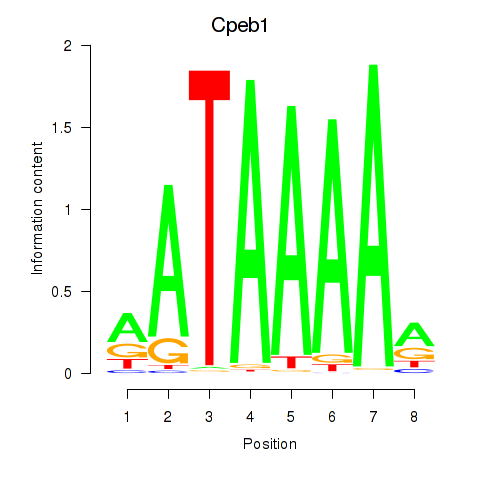
Motif ID: Cpeb1
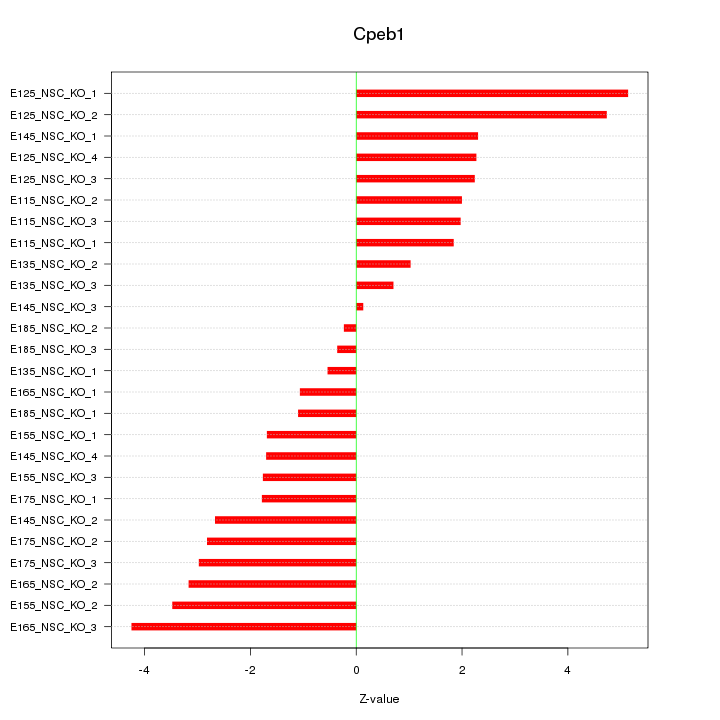
Z-value: 2.451
Transcription factors associated with Cpeb1:
| Gene Symbol | Entrez ID | Gene Name |
|---|---|---|
| Cpeb1 | ENSMUSG00000025586.10 | Cpeb1 |
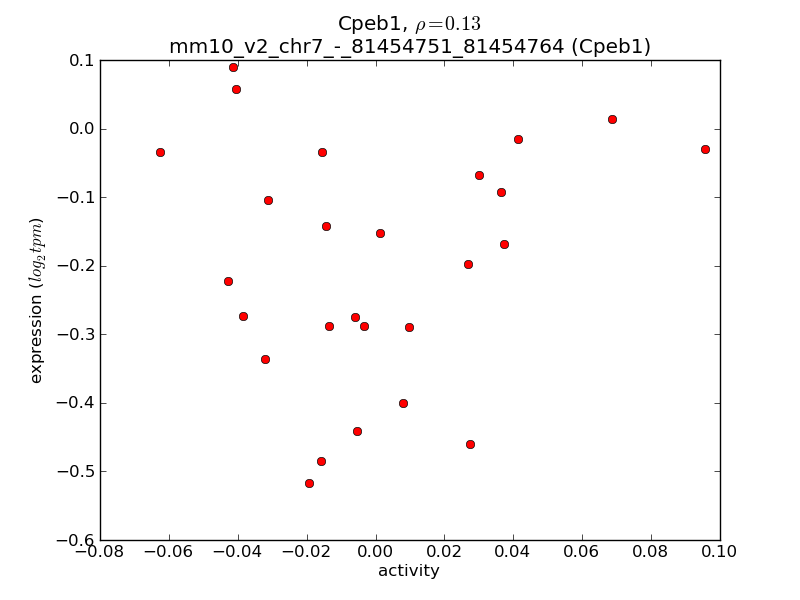
Activity-expression correlation:
| Gene Symbol | Promoter | Pearson corr. coef. | P-value | Plot |
|---|---|---|---|---|
| Cpeb1 | mm10_v2_chr7_-_81454751_81454764 | 0.13 | 5.3e-01 | Click! |


Top targets:
Gene overrepresentation in biological_process category:
| Log-likelihood per target | Total log-likelihood | Term | Description |
|---|---|---|---|
| 9.1 | 36.4 | GO:0046552 | eye photoreceptor cell fate commitment(GO:0042706) photoreceptor cell fate commitment(GO:0046552) |
| 7.1 | 56.8 | GO:0048625 | myoblast fate commitment(GO:0048625) |
| 5.6 | 22.4 | GO:0014846 | esophagus smooth muscle contraction(GO:0014846) |
| 4.1 | 20.4 | GO:2000325 | regulation of ligand-dependent nuclear receptor transcription coactivator activity(GO:2000325) positive regulation of ligand-dependent nuclear receptor transcription coactivator activity(GO:2000327) |
| 3.4 | 10.1 | GO:0021529 | spinal cord oligodendrocyte cell differentiation(GO:0021529) spinal cord oligodendrocyte cell fate specification(GO:0021530) |
| 3.1 | 15.6 | GO:0097475 | motor neuron migration(GO:0097475) spinal cord motor neuron migration(GO:0097476) |
| 3.1 | 15.4 | GO:0072015 | ciliary body morphogenesis(GO:0061073) glomerular visceral epithelial cell development(GO:0072015) glomerular epithelial cell development(GO:0072310) |
| 2.9 | 5.7 | GO:0021913 | regulation of transcription from RNA polymerase II promoter involved in spinal cord motor neuron fate specification(GO:0021912) regulation of transcription from RNA polymerase II promoter involved in ventral spinal cord interneuron specification(GO:0021913) |
| 2.7 | 13.6 | GO:0015671 | oxygen transport(GO:0015671) |
| 2.1 | 16.7 | GO:0021546 | rhombomere development(GO:0021546) |
| 2.0 | 9.8 | GO:0035262 | gonad morphogenesis(GO:0035262) |
| 1.7 | 5.2 | GO:0003345 | proepicardium cell migration involved in pericardium morphogenesis(GO:0003345) |
| 1.7 | 6.6 | GO:0045091 | regulation of single stranded viral RNA replication via double stranded DNA intermediate(GO:0045091) |
| 1.5 | 4.5 | GO:0042320 | regulation of circadian sleep/wake cycle, REM sleep(GO:0042320) circadian sleep/wake cycle, REM sleep(GO:0042747) positive regulation of circadian sleep/wake cycle, sleep(GO:0045938) |
| 1.5 | 19.2 | GO:0048672 | positive regulation of collateral sprouting(GO:0048672) |
| 1.4 | 4.3 | GO:0090425 | hepatocyte cell migration(GO:0002194) branching involved in pancreas morphogenesis(GO:0061114) acinar cell differentiation(GO:0090425) positive regulation of forebrain neuron differentiation(GO:2000979) |
| 1.4 | 4.1 | GO:0006597 | spermine biosynthetic process(GO:0006597) |
| 1.3 | 4.0 | GO:1903225 | negative regulation of endodermal cell differentiation(GO:1903225) |
| 1.3 | 10.4 | GO:0014816 | skeletal muscle satellite cell differentiation(GO:0014816) |
| 1.2 | 11.7 | GO:0051574 | positive regulation of histone H3-K9 methylation(GO:0051574) |
| 1.0 | 6.1 | GO:0007253 | cytoplasmic sequestering of NF-kappaB(GO:0007253) |
| 1.0 | 9.1 | GO:0048664 | neuron fate determination(GO:0048664) |
| 1.0 | 4.0 | GO:1903898 | positive regulation of translation in response to endoplasmic reticulum stress(GO:0036493) negative regulation of PERK-mediated unfolded protein response(GO:1903898) |
| 0.9 | 2.8 | GO:0071649 | regulation of adenylate cyclase activity involved in G-protein coupled receptor signaling pathway(GO:0010578) positive regulation of adenylate cyclase activity involved in G-protein coupled receptor signaling pathway(GO:0010579) regulation of chemokine (C-C motif) ligand 5 production(GO:0071649) positive regulation of somatostatin secretion(GO:0090274) |
| 0.9 | 4.6 | GO:0070934 | CRD-mediated mRNA stabilization(GO:0070934) |
| 0.8 | 3.3 | GO:1903966 | monounsaturated fatty acid metabolic process(GO:1903964) monounsaturated fatty acid biosynthetic process(GO:1903966) |
| 0.8 | 2.4 | GO:0030210 | heparin biosynthetic process(GO:0030210) Tie signaling pathway(GO:0048014) |
| 0.8 | 7.0 | GO:1902166 | negative regulation of intrinsic apoptotic signaling pathway in response to DNA damage by p53 class mediator(GO:1902166) |
| 0.7 | 3.6 | GO:0035426 | extracellular matrix-cell signaling(GO:0035426) |
| 0.7 | 3.5 | GO:0015705 | iodide transport(GO:0015705) |
| 0.7 | 3.5 | GO:0060040 | retinal bipolar neuron differentiation(GO:0060040) |
| 0.7 | 2.1 | GO:0014826 | vein smooth muscle contraction(GO:0014826) |
| 0.6 | 4.4 | GO:0007296 | vitellogenesis(GO:0007296) |
| 0.6 | 5.7 | GO:0090166 | Golgi disassembly(GO:0090166) |
| 0.6 | 1.9 | GO:0035928 | mitochondrial RNA 3'-end processing(GO:0000965) RNA 5'-end processing(GO:0000966) rRNA import into mitochondrion(GO:0035928) |
| 0.6 | 6.1 | GO:2001214 | positive regulation of vasculogenesis(GO:2001214) |
| 0.6 | 3.6 | GO:0006703 | estrogen biosynthetic process(GO:0006703) |
| 0.6 | 2.9 | GO:0033087 | negative regulation of immature T cell proliferation(GO:0033087) |
| 0.6 | 2.3 | GO:0048143 | astrocyte activation(GO:0048143) |
| 0.6 | 1.7 | GO:0060399 | positive regulation of growth hormone receptor signaling pathway(GO:0060399) |
| 0.5 | 2.6 | GO:1900147 | Schwann cell migration(GO:0036135) regulation of Schwann cell migration(GO:1900147) |
| 0.5 | 2.0 | GO:0070537 | histone H2A K63-linked deubiquitination(GO:0070537) |
| 0.5 | 8.1 | GO:0060736 | prostate gland growth(GO:0060736) |
| 0.5 | 4.0 | GO:2001054 | negative regulation of mesenchymal cell apoptotic process(GO:2001054) |
| 0.5 | 3.9 | GO:0031642 | negative regulation of myelination(GO:0031642) |
| 0.5 | 1.5 | GO:0014005 | microglia differentiation(GO:0014004) microglia development(GO:0014005) |
| 0.5 | 0.9 | GO:1900220 | semaphorin-plexin signaling pathway involved in bone trabecula morphogenesis(GO:1900220) |
| 0.5 | 1.9 | GO:0021780 | oligodendrocyte cell fate specification(GO:0021778) oligodendrocyte cell fate commitment(GO:0021779) glial cell fate specification(GO:0021780) |
| 0.4 | 2.7 | GO:0071699 | olfactory placode formation(GO:0030910) olfactory placode development(GO:0071698) olfactory placode morphogenesis(GO:0071699) |
| 0.4 | 1.8 | GO:0007113 | endomitotic cell cycle(GO:0007113) |
| 0.4 | 1.3 | GO:0036091 | positive regulation of transcription from RNA polymerase II promoter in response to oxidative stress(GO:0036091) |
| 0.4 | 0.8 | GO:0060455 | negative regulation of gastric acid secretion(GO:0060455) |
| 0.4 | 2.8 | GO:1900029 | positive regulation of ruffle assembly(GO:1900029) |
| 0.4 | 1.2 | GO:0035989 | tendon development(GO:0035989) |
| 0.4 | 6.5 | GO:0031987 | locomotion involved in locomotory behavior(GO:0031987) |
| 0.4 | 1.8 | GO:0030259 | lipid glycosylation(GO:0030259) |
| 0.4 | 3.7 | GO:0032876 | negative regulation of DNA endoreduplication(GO:0032876) |
| 0.3 | 4.1 | GO:0019985 | translesion synthesis(GO:0019985) |
| 0.3 | 3.7 | GO:0006610 | ribosomal protein import into nucleus(GO:0006610) |
| 0.3 | 1.0 | GO:0048162 | preantral ovarian follicle growth(GO:0001546) multi-layer follicle stage(GO:0048162) |
| 0.3 | 3.1 | GO:0021796 | cerebral cortex regionalization(GO:0021796) |
| 0.3 | 0.6 | GO:1903026 | negative regulation of RNA polymerase II regulatory region sequence-specific DNA binding(GO:1903026) |
| 0.3 | 1.5 | GO:0021631 | optic nerve morphogenesis(GO:0021631) |
| 0.3 | 3.0 | GO:0090557 | establishment of endothelial intestinal barrier(GO:0090557) |
| 0.3 | 6.1 | GO:0060009 | Sertoli cell development(GO:0060009) |
| 0.3 | 1.9 | GO:0043569 | negative regulation of insulin-like growth factor receptor signaling pathway(GO:0043569) |
| 0.3 | 1.9 | GO:0046477 | glycosylceramide catabolic process(GO:0046477) |
| 0.3 | 0.8 | GO:0060023 | soft palate development(GO:0060023) |
| 0.3 | 4.1 | GO:0048387 | negative regulation of retinoic acid receptor signaling pathway(GO:0048387) |
| 0.3 | 0.8 | GO:1901896 | positive regulation of calcium-transporting ATPase activity(GO:1901896) |
| 0.3 | 3.0 | GO:0002043 | blood vessel endothelial cell proliferation involved in sprouting angiogenesis(GO:0002043) |
| 0.2 | 2.9 | GO:2001224 | positive regulation of neuron migration(GO:2001224) |
| 0.2 | 3.3 | GO:0051382 | kinetochore assembly(GO:0051382) |
| 0.2 | 0.6 | GO:0016445 | somatic diversification of immunoglobulins(GO:0016445) |
| 0.2 | 1.0 | GO:0006177 | GMP biosynthetic process(GO:0006177) |
| 0.2 | 1.7 | GO:0010587 | miRNA catabolic process(GO:0010587) |
| 0.2 | 1.4 | GO:0061032 | visceral serous pericardium development(GO:0061032) |
| 0.2 | 0.4 | GO:0046101 | hypoxanthine metabolic process(GO:0046100) hypoxanthine biosynthetic process(GO:0046101) |
| 0.2 | 1.8 | GO:0048251 | elastic fiber assembly(GO:0048251) |
| 0.2 | 3.1 | GO:0045600 | positive regulation of fat cell differentiation(GO:0045600) |
| 0.2 | 2.7 | GO:0015937 | coenzyme A biosynthetic process(GO:0015937) |
| 0.2 | 1.5 | GO:0050957 | equilibrioception(GO:0050957) |
| 0.2 | 2.1 | GO:0097034 | mitochondrial respiratory chain complex IV assembly(GO:0033617) mitochondrial respiratory chain complex IV biogenesis(GO:0097034) |
| 0.2 | 4.0 | GO:0006825 | copper ion transport(GO:0006825) |
| 0.2 | 2.1 | GO:1902459 | positive regulation of stem cell population maintenance(GO:1902459) |
| 0.2 | 0.6 | GO:0002314 | germinal center B cell differentiation(GO:0002314) |
| 0.2 | 0.7 | GO:0035878 | nail development(GO:0035878) |
| 0.2 | 1.3 | GO:0032625 | interleukin-21 production(GO:0032625) interleukin-21 secretion(GO:0072619) |
| 0.2 | 1.1 | GO:0060613 | fat pad development(GO:0060613) |
| 0.2 | 5.0 | GO:0003301 | physiological muscle hypertrophy(GO:0003298) physiological cardiac muscle hypertrophy(GO:0003301) cell growth involved in cardiac muscle cell development(GO:0061049) |
| 0.1 | 0.9 | GO:0006957 | complement activation, alternative pathway(GO:0006957) |
| 0.1 | 0.7 | GO:0006369 | termination of RNA polymerase II transcription(GO:0006369) |
| 0.1 | 8.8 | GO:0051384 | response to glucocorticoid(GO:0051384) |
| 0.1 | 1.6 | GO:0033572 | transferrin transport(GO:0033572) |
| 0.1 | 1.3 | GO:0097531 | mast cell migration(GO:0097531) |
| 0.1 | 0.9 | GO:0034638 | phosphatidylcholine catabolic process(GO:0034638) |
| 0.1 | 1.8 | GO:0038063 | collagen-activated tyrosine kinase receptor signaling pathway(GO:0038063) |
| 0.1 | 0.4 | GO:0006348 | chromatin silencing at telomere(GO:0006348) |
| 0.1 | 0.3 | GO:0035701 | hematopoietic stem cell migration(GO:0035701) |
| 0.1 | 0.4 | GO:0060126 | somatotropin secreting cell differentiation(GO:0060126) |
| 0.1 | 2.2 | GO:0016339 | calcium-dependent cell-cell adhesion via plasma membrane cell adhesion molecules(GO:0016339) |
| 0.1 | 0.3 | GO:0050689 | negative regulation of interferon-beta biosynthetic process(GO:0045358) negative regulation of defense response to virus by host(GO:0050689) |
| 0.1 | 0.6 | GO:0090292 | nuclear matrix organization(GO:0043578) nuclear matrix anchoring at nuclear membrane(GO:0090292) |
| 0.1 | 1.2 | GO:0042573 | retinoic acid metabolic process(GO:0042573) |
| 0.1 | 0.9 | GO:0042759 | long-chain fatty acid biosynthetic process(GO:0042759) |
| 0.1 | 0.7 | GO:0060484 | lung-associated mesenchyme development(GO:0060484) |
| 0.1 | 2.8 | GO:0001706 | endoderm formation(GO:0001706) |
| 0.1 | 1.7 | GO:0034142 | toll-like receptor 4 signaling pathway(GO:0034142) |
| 0.1 | 12.6 | GO:0006261 | DNA-dependent DNA replication(GO:0006261) |
| 0.1 | 4.0 | GO:0021884 | forebrain neuron development(GO:0021884) |
| 0.1 | 0.3 | GO:0070944 | neutrophil mediated killing of bacterium(GO:0070944) |
| 0.1 | 2.2 | GO:0048026 | positive regulation of mRNA splicing, via spliceosome(GO:0048026) |
| 0.1 | 0.5 | GO:0046684 | response to pyrethroid(GO:0046684) |
| 0.1 | 0.6 | GO:0007320 | insemination(GO:0007320) |
| 0.1 | 2.9 | GO:0010972 | negative regulation of G2/M transition of mitotic cell cycle(GO:0010972) |
| 0.1 | 4.2 | GO:0021680 | cerebellar Purkinje cell layer development(GO:0021680) |
| 0.1 | 0.9 | GO:0009404 | toxin metabolic process(GO:0009404) |
| 0.1 | 4.1 | GO:1901998 | toxin transport(GO:1901998) |
| 0.1 | 0.8 | GO:0043518 | negative regulation of DNA damage response, signal transduction by p53 class mediator(GO:0043518) |
| 0.1 | 0.8 | GO:0007250 | activation of NF-kappaB-inducing kinase activity(GO:0007250) |
| 0.1 | 0.8 | GO:0045723 | positive regulation of fatty acid biosynthetic process(GO:0045723) |
| 0.1 | 0.3 | GO:1903031 | regulation of microtubule plus-end binding(GO:1903031) positive regulation of microtubule plus-end binding(GO:1903033) |
| 0.1 | 1.9 | GO:0070374 | positive regulation of ERK1 and ERK2 cascade(GO:0070374) |
| 0.1 | 2.0 | GO:0045747 | positive regulation of Notch signaling pathway(GO:0045747) |
| 0.1 | 2.3 | GO:0048791 | calcium ion-regulated exocytosis of neurotransmitter(GO:0048791) |
| 0.1 | 0.8 | GO:0043374 | CD8-positive, alpha-beta T cell differentiation(GO:0043374) |
| 0.1 | 0.8 | GO:0051457 | maintenance of protein location in nucleus(GO:0051457) |
| 0.1 | 3.4 | GO:0006493 | protein O-linked glycosylation(GO:0006493) |
| 0.1 | 0.8 | GO:0031272 | regulation of pseudopodium assembly(GO:0031272) |
| 0.1 | 0.3 | GO:0072488 | ammonium transmembrane transport(GO:0072488) |
| 0.1 | 1.6 | GO:0034724 | DNA replication-independent nucleosome assembly(GO:0006336) DNA replication-independent nucleosome organization(GO:0034724) |
| 0.1 | 0.3 | GO:0033762 | response to glucagon(GO:0033762) |
| 0.1 | 1.2 | GO:0033194 | response to hydroperoxide(GO:0033194) |
| 0.1 | 2.5 | GO:0050853 | B cell receptor signaling pathway(GO:0050853) |
| 0.1 | 0.6 | GO:0045040 | protein import into mitochondrial outer membrane(GO:0045040) |
| 0.1 | 1.0 | GO:1901522 | positive regulation of transcription from RNA polymerase II promoter involved in cellular response to chemical stimulus(GO:1901522) |
| 0.1 | 6.2 | GO:0048015 | phosphatidylinositol-mediated signaling(GO:0048015) |
| 0.1 | 0.2 | GO:0097623 | potassium ion export across plasma membrane(GO:0097623) regulation of calcium ion transmembrane transport via high voltage-gated calcium channel(GO:1902514) |
| 0.1 | 0.6 | GO:0097094 | craniofacial suture morphogenesis(GO:0097094) |
| 0.0 | 1.3 | GO:0016197 | endosomal transport(GO:0016197) |
| 0.0 | 2.1 | GO:1902653 | cholesterol biosynthetic process(GO:0006695) secondary alcohol biosynthetic process(GO:1902653) |
| 0.0 | 0.1 | GO:0006556 | S-adenosylmethionine biosynthetic process(GO:0006556) |
| 0.0 | 0.8 | GO:0043968 | histone H2A acetylation(GO:0043968) |
| 0.0 | 1.2 | GO:0006303 | double-strand break repair via nonhomologous end joining(GO:0006303) |
| 0.0 | 3.4 | GO:0050728 | negative regulation of inflammatory response(GO:0050728) |
| 0.0 | 2.9 | GO:0051225 | spindle assembly(GO:0051225) |
| 0.0 | 5.3 | GO:0000910 | cytokinesis(GO:0000910) |
| 0.0 | 0.9 | GO:0010172 | embryonic body morphogenesis(GO:0010172) |
| 0.0 | 0.2 | GO:0006529 | asparagine biosynthetic process(GO:0006529) |
| 0.0 | 0.5 | GO:0009048 | dosage compensation by inactivation of X chromosome(GO:0009048) |
| 0.0 | 2.8 | GO:0046034 | ATP metabolic process(GO:0046034) |
| 0.0 | 0.6 | GO:0001947 | heart looping(GO:0001947) |
| 0.0 | 0.5 | GO:0032148 | activation of protein kinase B activity(GO:0032148) |
| 0.0 | 1.7 | GO:0032088 | negative regulation of NF-kappaB transcription factor activity(GO:0032088) |
| 0.0 | 0.8 | GO:0048599 | oocyte development(GO:0048599) |
| 0.0 | 1.0 | GO:0000462 | maturation of SSU-rRNA from tricistronic rRNA transcript (SSU-rRNA, 5.8S rRNA, LSU-rRNA)(GO:0000462) |
| 0.0 | 0.8 | GO:0007608 | sensory perception of smell(GO:0007608) |
| 0.0 | 0.2 | GO:0000395 | mRNA 5'-splice site recognition(GO:0000395) |
| 0.0 | 1.0 | GO:0042773 | ATP synthesis coupled electron transport(GO:0042773) |
| 0.0 | 0.4 | GO:0045722 | positive regulation of gluconeogenesis(GO:0045722) |
| 0.0 | 1.7 | GO:0007156 | homophilic cell adhesion via plasma membrane adhesion molecules(GO:0007156) |
| 0.0 | 0.3 | GO:0019511 | peptidyl-proline hydroxylation(GO:0019511) |
| 0.0 | 0.8 | GO:0006730 | one-carbon metabolic process(GO:0006730) |
| 0.0 | 2.0 | GO:0007030 | Golgi organization(GO:0007030) |
| 0.0 | 1.6 | GO:0007283 | spermatogenesis(GO:0007283) male gamete generation(GO:0048232) |
| 0.0 | 0.3 | GO:1902043 | positive regulation of extrinsic apoptotic signaling pathway via death domain receptors(GO:1902043) |
| 0.0 | 0.9 | GO:0043627 | response to estrogen(GO:0043627) |
| 0.0 | 0.3 | GO:0006625 | protein targeting to peroxisome(GO:0006625) peroxisomal transport(GO:0043574) protein localization to peroxisome(GO:0072662) establishment of protein localization to peroxisome(GO:0072663) |
| 0.0 | 0.3 | GO:0001967 | suckling behavior(GO:0001967) |
| 0.0 | 1.7 | GO:0060348 | bone development(GO:0060348) |
| 0.0 | 0.5 | GO:0032092 | positive regulation of protein binding(GO:0032092) |
| 0.0 | 1.0 | GO:0016579 | protein deubiquitination(GO:0016579) |
Gene overrepresentation in cellular_component category:
| Log-likelihood per target | Total log-likelihood | Term | Description |
|---|---|---|---|
| 6.3 | 56.5 | GO:0070369 | beta-catenin-TCF7L2 complex(GO:0070369) |
| 3.5 | 17.5 | GO:0008623 | CHRAC(GO:0008623) |
| 1.7 | 10.2 | GO:0001674 | female germ cell nucleus(GO:0001674) |
| 1.5 | 6.1 | GO:0031466 | Cul5-RING ubiquitin ligase complex(GO:0031466) |
| 1.3 | 4.0 | GO:0005588 | collagen type V trimer(GO:0005588) |
| 0.8 | 4.6 | GO:0070937 | CRD-mediated mRNA stability complex(GO:0070937) |
| 0.8 | 2.3 | GO:0097058 | CRLF-CLCF1 complex(GO:0097058) |
| 0.7 | 4.1 | GO:0000444 | MIS12/MIND type complex(GO:0000444) |
| 0.6 | 2.6 | GO:0045098 | type III intermediate filament(GO:0045098) |
| 0.5 | 4.8 | GO:0031362 | anchored component of external side of plasma membrane(GO:0031362) |
| 0.5 | 12.1 | GO:0035098 | ESC/E(Z) complex(GO:0035098) |
| 0.4 | 2.9 | GO:0098554 | cytoplasmic side of endoplasmic reticulum membrane(GO:0098554) |
| 0.4 | 3.0 | GO:0046581 | intercellular canaliculus(GO:0046581) |
| 0.4 | 1.8 | GO:0005587 | collagen type IV trimer(GO:0005587) network-forming collagen trimer(GO:0098642) collagen network(GO:0098645) basement membrane collagen trimer(GO:0098651) |
| 0.4 | 2.9 | GO:0070652 | HAUS complex(GO:0070652) |
| 0.3 | 1.7 | GO:0046696 | lipopolysaccharide receptor complex(GO:0046696) |
| 0.3 | 4.0 | GO:0000164 | protein phosphatase type 1 complex(GO:0000164) |
| 0.3 | 2.0 | GO:0097197 | tetraspanin-enriched microdomain(GO:0097197) |
| 0.3 | 2.8 | GO:0032982 | myosin filament(GO:0032982) |
| 0.3 | 0.8 | GO:0036128 | CatSper complex(GO:0036128) |
| 0.3 | 2.0 | GO:0070552 | BRISC complex(GO:0070552) |
| 0.3 | 1.3 | GO:0034388 | Pwp2p-containing subcomplex of 90S preribosome(GO:0034388) |
| 0.2 | 0.9 | GO:0071942 | XPC complex(GO:0071942) |
| 0.2 | 0.9 | GO:0001652 | granular component(GO:0001652) |
| 0.2 | 24.9 | GO:0016607 | nuclear speck(GO:0016607) |
| 0.2 | 9.6 | GO:0031463 | Cul3-RING ubiquitin ligase complex(GO:0031463) |
| 0.2 | 0.3 | GO:0030981 | cortical microtubule cytoskeleton(GO:0030981) |
| 0.1 | 1.8 | GO:0001527 | microfibril(GO:0001527) |
| 0.1 | 32.4 | GO:0030426 | growth cone(GO:0030426) |
| 0.1 | 1.1 | GO:0030478 | actin cap(GO:0030478) |
| 0.1 | 9.0 | GO:0005758 | mitochondrial intermembrane space(GO:0005758) |
| 0.1 | 1.2 | GO:0098643 | fibrillar collagen trimer(GO:0005583) banded collagen fibril(GO:0098643) |
| 0.1 | 2.7 | GO:0030118 | clathrin coat(GO:0030118) |
| 0.1 | 0.9 | GO:0005664 | origin recognition complex(GO:0000808) nuclear origin of replication recognition complex(GO:0005664) |
| 0.1 | 0.4 | GO:0002189 | ribose phosphate diphosphokinase complex(GO:0002189) |
| 0.1 | 1.3 | GO:0071203 | BLOC-1 complex(GO:0031083) WASH complex(GO:0071203) |
| 0.1 | 1.7 | GO:0010369 | chromocenter(GO:0010369) |
| 0.1 | 1.2 | GO:0070419 | nonhomologous end joining complex(GO:0070419) |
| 0.1 | 0.9 | GO:0002116 | semaphorin receptor complex(GO:0002116) |
| 0.1 | 1.2 | GO:0031235 | intrinsic component of the cytoplasmic side of the plasma membrane(GO:0031235) |
| 0.1 | 0.6 | GO:0034993 | microtubule organizing center attachment site(GO:0034992) LINC complex(GO:0034993) |
| 0.1 | 0.5 | GO:0030891 | VCB complex(GO:0030891) |
| 0.1 | 7.2 | GO:0005814 | centriole(GO:0005814) |
| 0.1 | 0.6 | GO:0005742 | mitochondrial outer membrane translocase complex(GO:0005742) |
| 0.1 | 1.3 | GO:0005665 | DNA-directed RNA polymerase II, core complex(GO:0005665) |
| 0.1 | 35.8 | GO:0005912 | adherens junction(GO:0005912) |
| 0.1 | 1.3 | GO:0035102 | PRC1 complex(GO:0035102) |
| 0.1 | 0.6 | GO:0000974 | Prp19 complex(GO:0000974) |
| 0.1 | 5.2 | GO:0001669 | acrosomal vesicle(GO:0001669) |
| 0.1 | 0.4 | GO:0005853 | eukaryotic translation elongation factor 1 complex(GO:0005853) |
| 0.1 | 0.2 | GO:0034673 | inhibin-betaglycan-ActRII complex(GO:0034673) |
| 0.1 | 5.1 | GO:0005795 | Golgi stack(GO:0005795) |
| 0.1 | 0.7 | GO:0002102 | podosome(GO:0002102) |
| 0.1 | 6.5 | GO:0034399 | nuclear periphery(GO:0034399) |
| 0.1 | 2.3 | GO:0005882 | intermediate filament(GO:0005882) |
| 0.0 | 2.0 | GO:0005788 | endoplasmic reticulum lumen(GO:0005788) |
| 0.0 | 0.1 | GO:0048269 | methionine adenosyltransferase complex(GO:0048269) |
| 0.0 | 0.8 | GO:0043189 | NuA4 histone acetyltransferase complex(GO:0035267) H4/H2A histone acetyltransferase complex(GO:0043189) H4 histone acetyltransferase complex(GO:1902562) |
| 0.0 | 4.9 | GO:0030176 | integral component of endoplasmic reticulum membrane(GO:0030176) |
| 0.0 | 0.8 | GO:0005669 | transcription factor TFIID complex(GO:0005669) |
| 0.0 | 0.7 | GO:0005849 | mRNA cleavage factor complex(GO:0005849) |
| 0.0 | 3.4 | GO:0090575 | RNA polymerase II transcription factor complex(GO:0090575) |
| 0.0 | 2.2 | GO:0005902 | microvillus(GO:0005902) |
| 0.0 | 3.7 | GO:0043195 | terminal bouton(GO:0043195) |
| 0.0 | 7.0 | GO:0000775 | chromosome, centromeric region(GO:0000775) |
| 0.0 | 0.4 | GO:0048188 | Set1C/COMPASS complex(GO:0048188) |
| 0.0 | 0.3 | GO:0045275 | respiratory chain complex III(GO:0045275) |
| 0.0 | 0.5 | GO:0034706 | voltage-gated sodium channel complex(GO:0001518) sodium channel complex(GO:0034706) |
| 0.0 | 5.0 | GO:0005681 | spliceosomal complex(GO:0005681) |
| 0.0 | 0.2 | GO:0042629 | mast cell granule(GO:0042629) |
| 0.0 | 32.5 | GO:0005794 | Golgi apparatus(GO:0005794) |
| 0.0 | 3.1 | GO:0070382 | exocytic vesicle(GO:0070382) |
| 0.0 | 3.6 | GO:0005777 | peroxisome(GO:0005777) microbody(GO:0042579) |
| 0.0 | 1.4 | GO:0036126 | sperm flagellum(GO:0036126) |
| 0.0 | 0.1 | GO:0005751 | mitochondrial respiratory chain complex IV(GO:0005751) |
| 0.0 | 0.7 | GO:0000315 | organellar large ribosomal subunit(GO:0000315) mitochondrial large ribosomal subunit(GO:0005762) |
| 0.0 | 1.6 | GO:0010008 | endosome membrane(GO:0010008) |
| 0.0 | 0.4 | GO:1990391 | DNA repair complex(GO:1990391) |
| 0.0 | 0.2 | GO:0031588 | nucleotide-activated protein kinase complex(GO:0031588) |
| 0.0 | 0.6 | GO:0005581 | collagen trimer(GO:0005581) |
Gene overrepresentation in molecular_function category:
| Log-likelihood per target | Total log-likelihood | Term | Description |
|---|---|---|---|
| 4.5 | 22.4 | GO:0008449 | N-acetylglucosamine-6-sulfatase activity(GO:0008449) |
| 2.7 | 13.6 | GO:0005344 | oxygen transporter activity(GO:0005344) |
| 2.4 | 14.4 | GO:0019841 | retinol binding(GO:0019841) |
| 2.2 | 52.9 | GO:0045295 | gamma-catenin binding(GO:0045295) |
| 1.7 | 12.1 | GO:0015016 | [heparan sulfate]-glucosamine N-sulfotransferase activity(GO:0015016) |
| 1.2 | 7.0 | GO:0008597 | calcium-dependent protein serine/threonine phosphatase regulator activity(GO:0008597) |
| 1.1 | 6.6 | GO:0061505 | DNA topoisomerase type II (ATP-hydrolyzing) activity(GO:0003918) DNA topoisomerase II activity(GO:0061505) |
| 1.0 | 4.1 | GO:0019808 | polyamine binding(GO:0019808) |
| 0.9 | 3.5 | GO:0015111 | iodide transmembrane transporter activity(GO:0015111) |
| 0.9 | 9.7 | GO:0003680 | AT DNA binding(GO:0003680) |
| 0.8 | 3.3 | GO:0032896 | palmitoyl-CoA 9-desaturase activity(GO:0032896) |
| 0.8 | 4.0 | GO:0016724 | ferroxidase activity(GO:0004322) oxidoreductase activity, oxidizing metal ions, oxygen as acceptor(GO:0016724) |
| 0.8 | 15.1 | GO:0004435 | phosphatidylinositol phospholipase C activity(GO:0004435) |
| 0.7 | 16.7 | GO:0032183 | SUMO binding(GO:0032183) |
| 0.7 | 10.4 | GO:0000983 | transcription factor activity, RNA polymerase II core promoter sequence-specific(GO:0000983) |
| 0.7 | 2.1 | GO:0004769 | steroid delta-isomerase activity(GO:0004769) |
| 0.7 | 2.1 | GO:0004962 | endothelin receptor activity(GO:0004962) |
| 0.7 | 4.0 | GO:0071074 | eukaryotic initiation factor eIF2 binding(GO:0071074) |
| 0.6 | 2.6 | GO:1990254 | keratin filament binding(GO:1990254) |
| 0.6 | 14.6 | GO:0071837 | HMG box domain binding(GO:0071837) |
| 0.6 | 6.1 | GO:0005149 | interleukin-1 receptor binding(GO:0005149) |
| 0.6 | 16.7 | GO:0005112 | Notch binding(GO:0005112) |
| 0.5 | 2.7 | GO:0004594 | pantothenate kinase activity(GO:0004594) |
| 0.5 | 4.3 | GO:0050693 | LBD domain binding(GO:0050693) |
| 0.5 | 3.1 | GO:0035727 | lysophosphatidic acid binding(GO:0035727) lysophosphatidic acid receptor activity(GO:0070915) |
| 0.5 | 3.6 | GO:0043237 | laminin-1 binding(GO:0043237) |
| 0.5 | 15.6 | GO:0001106 | RNA polymerase II transcription corepressor activity(GO:0001106) |
| 0.5 | 4.8 | GO:0005167 | neurotrophin TRK receptor binding(GO:0005167) |
| 0.5 | 2.8 | GO:0000774 | adenyl-nucleotide exchange factor activity(GO:0000774) |
| 0.4 | 2.3 | GO:0005138 | interleukin-6 receptor binding(GO:0005138) |
| 0.3 | 1.7 | GO:0050265 | RNA uridylyltransferase activity(GO:0050265) |
| 0.3 | 11.9 | GO:0032452 | histone demethylase activity(GO:0032452) |
| 0.3 | 5.8 | GO:0005540 | hyaluronic acid binding(GO:0005540) |
| 0.3 | 1.9 | GO:0016936 | galactoside binding(GO:0016936) |
| 0.3 | 4.1 | GO:0043522 | leucine zipper domain binding(GO:0043522) |
| 0.3 | 1.9 | GO:0034046 | poly(G) binding(GO:0034046) |
| 0.3 | 1.8 | GO:0047276 | N-acetyllactosaminide 3-alpha-galactosyltransferase activity(GO:0047276) |
| 0.3 | 11.3 | GO:0000979 | RNA polymerase II core promoter sequence-specific DNA binding(GO:0000979) |
| 0.3 | 4.6 | GO:0048027 | mRNA 5'-UTR binding(GO:0048027) |
| 0.3 | 3.9 | GO:0004438 | phosphatidylinositol-3-phosphatase activity(GO:0004438) |
| 0.3 | 1.9 | GO:0004303 | estradiol 17-beta-dehydrogenase activity(GO:0004303) |
| 0.3 | 5.3 | GO:0071855 | neuropeptide receptor binding(GO:0071855) |
| 0.3 | 1.0 | GO:0003938 | IMP dehydrogenase activity(GO:0003938) |
| 0.3 | 12.3 | GO:0002039 | p53 binding(GO:0002039) |
| 0.3 | 4.0 | GO:0046332 | SMAD binding(GO:0046332) |
| 0.2 | 1.5 | GO:0005005 | transmembrane-ephrin receptor activity(GO:0005005) |
| 0.2 | 0.9 | GO:0004528 | phosphodiesterase I activity(GO:0004528) |
| 0.2 | 8.5 | GO:0017112 | Rab guanyl-nucleotide exchange factor activity(GO:0017112) |
| 0.2 | 2.0 | GO:0016920 | pyroglutamyl-peptidase activity(GO:0016920) |
| 0.2 | 3.4 | GO:0004653 | polypeptide N-acetylgalactosaminyltransferase activity(GO:0004653) |
| 0.2 | 1.7 | GO:0005025 | transforming growth factor beta receptor activity, type I(GO:0005025) |
| 0.2 | 0.6 | GO:0035673 | oligopeptide transmembrane transporter activity(GO:0035673) |
| 0.2 | 0.7 | GO:0038132 | neuregulin binding(GO:0038132) |
| 0.2 | 8.1 | GO:0045499 | chemorepellent activity(GO:0045499) |
| 0.2 | 2.4 | GO:0005172 | vascular endothelial growth factor receptor binding(GO:0005172) |
| 0.2 | 0.9 | GO:0004499 | N,N-dimethylaniline monooxygenase activity(GO:0004499) |
| 0.2 | 0.7 | GO:0008131 | primary amine oxidase activity(GO:0008131) |
| 0.2 | 3.0 | GO:0070888 | E-box binding(GO:0070888) |
| 0.1 | 0.8 | GO:0004984 | olfactory receptor activity(GO:0004984) |
| 0.1 | 2.8 | GO:0000146 | microfilament motor activity(GO:0000146) |
| 0.1 | 12.1 | GO:0004222 | metalloendopeptidase activity(GO:0004222) |
| 0.1 | 3.7 | GO:0008139 | nuclear localization sequence binding(GO:0008139) |
| 0.1 | 50.1 | GO:0001159 | core promoter proximal region DNA binding(GO:0001159) |
| 0.1 | 1.8 | GO:0008641 | small protein activating enzyme activity(GO:0008641) |
| 0.1 | 0.9 | GO:0032795 | heterotrimeric G-protein binding(GO:0032795) |
| 0.1 | 1.7 | GO:0001530 | lipopolysaccharide binding(GO:0001530) |
| 0.1 | 2.3 | GO:0070016 | armadillo repeat domain binding(GO:0070016) |
| 0.1 | 0.4 | GO:0016716 | oxidoreductase activity, acting on paired donors, with incorporation or reduction of molecular oxygen, another compound as one donor, and incorporation of one atom of oxygen(GO:0016716) |
| 0.1 | 2.5 | GO:0030676 | Rac guanyl-nucleotide exchange factor activity(GO:0030676) |
| 0.1 | 114.7 | GO:0008270 | zinc ion binding(GO:0008270) |
| 0.1 | 2.8 | GO:0051537 | 2 iron, 2 sulfur cluster binding(GO:0051537) |
| 0.1 | 0.9 | GO:0003688 | DNA replication origin binding(GO:0003688) |
| 0.1 | 0.4 | GO:0004749 | ribose phosphate diphosphokinase activity(GO:0004749) |
| 0.1 | 0.9 | GO:0004445 | inositol-polyphosphate 5-phosphatase activity(GO:0004445) |
| 0.1 | 20.8 | GO:0004842 | ubiquitin-protein transferase activity(GO:0004842) |
| 0.1 | 0.3 | GO:0016494 | C-X-C chemokine receptor activity(GO:0016494) |
| 0.1 | 2.8 | GO:0017017 | MAP kinase tyrosine/serine/threonine phosphatase activity(GO:0017017) |
| 0.1 | 1.0 | GO:0042923 | neuropeptide binding(GO:0042923) |
| 0.1 | 1.6 | GO:0032947 | protein complex scaffold(GO:0032947) |
| 0.1 | 0.9 | GO:0102338 | fatty acid elongase activity(GO:0009922) 3-oxo-arachidoyl-CoA synthase activity(GO:0102336) 3-oxo-cerotoyl-CoA synthase activity(GO:0102337) 3-oxo-lignoceronyl-CoA synthase activity(GO:0102338) |
| 0.1 | 3.9 | GO:0001085 | RNA polymerase II transcription factor binding(GO:0001085) |
| 0.1 | 2.6 | GO:0070491 | repressing transcription factor binding(GO:0070491) |
| 0.1 | 2.7 | GO:0042054 | histone methyltransferase activity(GO:0042054) |
| 0.1 | 0.9 | GO:0017154 | semaphorin receptor activity(GO:0017154) |
| 0.1 | 3.7 | GO:0005179 | hormone activity(GO:0005179) |
| 0.1 | 1.3 | GO:0001221 | transcription cofactor binding(GO:0001221) |
| 0.1 | 2.3 | GO:0005544 | calcium-dependent phospholipid binding(GO:0005544) |
| 0.1 | 1.7 | GO:0051059 | NF-kappaB binding(GO:0051059) |
| 0.1 | 2.1 | GO:0043621 | protein self-association(GO:0043621) |
| 0.1 | 1.2 | GO:0003785 | actin monomer binding(GO:0003785) |
| 0.1 | 0.6 | GO:0015266 | protein channel activity(GO:0015266) |
| 0.1 | 1.2 | GO:0004029 | aldehyde dehydrogenase (NAD) activity(GO:0004029) |
| 0.1 | 0.2 | GO:0005024 | transforming growth factor beta-activated receptor activity(GO:0005024) |
| 0.1 | 0.4 | GO:0030414 | peptidase inhibitor activity(GO:0030414) |
| 0.0 | 0.8 | GO:0051861 | glycolipid binding(GO:0051861) |
| 0.0 | 1.3 | GO:0030515 | snoRNA binding(GO:0030515) |
| 0.0 | 0.2 | GO:0004066 | asparagine synthase (glutamine-hydrolyzing) activity(GO:0004066) |
| 0.0 | 0.3 | GO:0008121 | ubiquinol-cytochrome-c reductase activity(GO:0008121) oxidoreductase activity, acting on diphenols and related substances as donors(GO:0016679) oxidoreductase activity, acting on diphenols and related substances as donors, cytochrome as acceptor(GO:0016681) |
| 0.0 | 0.7 | GO:0000993 | RNA polymerase II core binding(GO:0000993) |
| 0.0 | 0.3 | GO:0051010 | microtubule plus-end binding(GO:0051010) |
| 0.0 | 1.8 | GO:0019894 | kinesin binding(GO:0019894) |
| 0.0 | 0.3 | GO:0045236 | CXCR chemokine receptor binding(GO:0045236) |
| 0.0 | 0.5 | GO:0043422 | protein kinase B binding(GO:0043422) |
| 0.0 | 0.5 | GO:0031402 | sodium ion binding(GO:0031402) |
| 0.0 | 1.6 | GO:0005080 | protein kinase C binding(GO:0005080) |
| 0.0 | 0.4 | GO:0051787 | misfolded protein binding(GO:0051787) |
| 0.0 | 1.1 | GO:0048365 | Rac GTPase binding(GO:0048365) |
| 0.0 | 2.1 | GO:0003714 | transcription corepressor activity(GO:0003714) |
| 0.0 | 0.4 | GO:0003746 | translation elongation factor activity(GO:0003746) |
| 0.0 | 0.5 | GO:0003743 | translation initiation factor activity(GO:0003743) |
| 0.0 | 0.1 | GO:0035259 | glucocorticoid receptor binding(GO:0035259) |
| 0.0 | 1.5 | GO:0004252 | serine-type endopeptidase activity(GO:0004252) |
| 0.0 | 0.1 | GO:0008454 | alpha-1,3-mannosylglycoprotein 4-beta-N-acetylglucosaminyltransferase activity(GO:0008454) |
| 0.0 | 7.2 | GO:0005525 | GTP binding(GO:0005525) |
| 0.0 | 1.4 | GO:0003697 | single-stranded DNA binding(GO:0003697) |
| 0.0 | 0.2 | GO:0016208 | AMP binding(GO:0016208) |
| 0.0 | 1.6 | GO:0042393 | histone binding(GO:0042393) |
| 0.0 | 0.2 | GO:0008519 | ammonium transmembrane transporter activity(GO:0008519) |
| 0.0 | 0.5 | GO:0034945 | dihydrolipoamide branched chain acyltransferase activity(GO:0004147) palmitoleoyl [acyl-carrier-protein]-dependent acyltransferase activity(GO:0008951) serine O-acyltransferase activity(GO:0016412) O-succinyltransferase activity(GO:0016750) sinapoyltransferase activity(GO:0016752) O-sinapoyltransferase activity(GO:0016753) peptidyl-lysine N6-myristoyltransferase activity(GO:0018030) peptidyl-lysine N6-palmitoyltransferase activity(GO:0018031) benzoyl acetate-CoA thiolase activity(GO:0018711) 3-hydroxybutyryl-CoA thiolase activity(GO:0018712) 3-ketopimelyl-CoA thiolase activity(GO:0018713) N-palmitoyltransferase activity(GO:0019105) acyl-CoA N-acyltransferase activity(GO:0019186) protein-cysteine S-myristoyltransferase activity(GO:0019705) protein-cysteine S-acyltransferase activity(GO:0019707) glucosaminyl-phosphotidylinositol O-acyltransferase activity(GO:0032216) ergosterol O-acyltransferase activity(GO:0034737) lanosterol O-acyltransferase activity(GO:0034738) naphthyl-2-oxomethyl-succinyl-CoA succinyl transferase activity(GO:0034848) 2,4,4-trimethyl-3-oxopentanoyl-CoA 2-C-propanoyl transferase activity(GO:0034851) 2-methylhexanoyl-CoA C-acetyltransferase activity(GO:0034915) butyryl-CoA 2-C-propionyltransferase activity(GO:0034919) 2,6-dimethyl-5-methylene-3-oxo-heptanoyl-CoA C-acetyltransferase activity(GO:0034945) L-2-aminoadipate N-acetyltransferase activity(GO:0043741) keto acid formate lyase activity(GO:0043806) Ras palmitoyltransferase activity(GO:0043849) azetidine-2-carboxylic acid acetyltransferase activity(GO:0046941) peptidyl-lysine N-acetyltransferase activity, acting on acetyl phosphate as donor(GO:0052858) acetyl-CoA:L-lysine N6-acetyltransferase(GO:0090595) |
| 0.0 | 1.0 | GO:0101005 | thiol-dependent ubiquitinyl hydrolase activity(GO:0036459) ubiquitinyl hydrolase activity(GO:0101005) |
| 0.0 | 0.6 | GO:0004896 | cytokine receptor activity(GO:0004896) |
| 0.0 | 0.4 | GO:0050136 | NADH dehydrogenase (ubiquinone) activity(GO:0008137) NADH dehydrogenase (quinone) activity(GO:0050136) |
| 0.0 | 0.2 | GO:0070577 | lysine-acetylated histone binding(GO:0070577) |
| 0.0 | 2.6 | GO:0008022 | protein C-terminus binding(GO:0008022) |