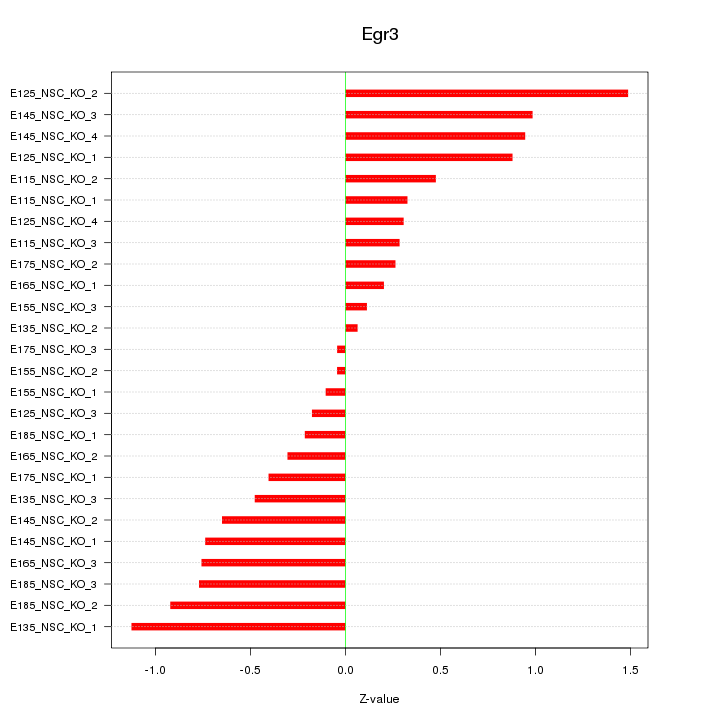
Motif ID: Egr3
Z-value: 0.630

Transcription factors associated with Egr3:
| Gene Symbol | Entrez ID | Gene Name |
|---|---|---|
| Egr3 | ENSMUSG00000033730.3 | Egr3 |
Activity-expression correlation:
| Gene Symbol | Promoter | Pearson corr. coef. | P-value | Plot |
|---|---|---|---|---|
| Egr3 | mm10_v2_chr14_+_70077375_70077445 | -0.03 | 9.0e-01 | Click! |


Top targets:
Gene overrepresentation in biological_process category:
| Log-likelihood per target | Total log-likelihood | Term | Description |
|---|---|---|---|
| 0.6 | 2.5 | GO:0070858 | negative regulation of bile acid biosynthetic process(GO:0070858) negative regulation of bile acid metabolic process(GO:1904252) |
| 0.3 | 1.0 | GO:0060084 | synaptic transmission involved in micturition(GO:0060084) |
| 0.3 | 0.9 | GO:0060010 | Sertoli cell fate commitment(GO:0060010) |
| 0.3 | 0.9 | GO:0045014 | detection of carbohydrate stimulus(GO:0009730) detection of hexose stimulus(GO:0009732) detection of monosaccharide stimulus(GO:0034287) carbon catabolite repression of transcription(GO:0045013) negative regulation of transcription by glucose(GO:0045014) detection of glucose(GO:0051594) |
| 0.3 | 1.1 | GO:0055009 | extraocular skeletal muscle development(GO:0002074) atrial cardiac muscle tissue development(GO:0003228) pulmonary myocardium development(GO:0003350) subthalamus development(GO:0021539) subthalamic nucleus development(GO:0021763) atrial cardiac muscle tissue morphogenesis(GO:0055009) left lung morphogenesis(GO:0060460) pulmonary vein morphogenesis(GO:0060577) superior vena cava morphogenesis(GO:0060578) |
| 0.3 | 1.8 | GO:0000320 | re-entry into mitotic cell cycle(GO:0000320) |
| 0.2 | 1.0 | GO:2000325 | regulation of ligand-dependent nuclear receptor transcription coactivator activity(GO:2000325) positive regulation of ligand-dependent nuclear receptor transcription coactivator activity(GO:2000327) |
| 0.2 | 1.5 | GO:0019800 | peptide cross-linking via chondroitin 4-sulfate glycosaminoglycan(GO:0019800) |
| 0.2 | 0.5 | GO:0010757 | arachidonic acid metabolite production involved in inflammatory response(GO:0002538) negative regulation of plasminogen activation(GO:0010757) regulation of vascular wound healing(GO:0061043) regulation of smooth muscle cell-matrix adhesion(GO:2000097) |
| 0.1 | 0.6 | GO:0046684 | response to pyrethroid(GO:0046684) |
| 0.1 | 0.9 | GO:0060613 | fat pad development(GO:0060613) |
| 0.1 | 0.4 | GO:0061626 | pharyngeal arch artery morphogenesis(GO:0061626) |
| 0.1 | 0.8 | GO:2000601 | positive regulation of Arp2/3 complex-mediated actin nucleation(GO:2000601) |
| 0.1 | 0.5 | GO:0015015 | heparan sulfate proteoglycan biosynthetic process, enzymatic modification(GO:0015015) |
| 0.1 | 0.2 | GO:1903334 | positive regulation of protein folding(GO:1903334) |
| 0.1 | 0.2 | GO:0045819 | positive regulation of glycogen catabolic process(GO:0045819) |
| 0.1 | 0.9 | GO:0034773 | histone H4-K20 trimethylation(GO:0034773) |
| 0.1 | 0.3 | GO:0003360 | brainstem development(GO:0003360) |
| 0.1 | 0.4 | GO:0090245 | axis elongation involved in somitogenesis(GO:0090245) |
| 0.1 | 0.2 | GO:0061110 | dense core granule biogenesis(GO:0061110) regulation of dense core granule biogenesis(GO:2000705) |
| 0.1 | 0.5 | GO:0036371 | protein localization to M-band(GO:0036309) protein localization to T-tubule(GO:0036371) |
| 0.0 | 0.2 | GO:0034196 | acylglycerol transport(GO:0034196) triglyceride transport(GO:0034197) |
| 0.0 | 0.1 | GO:0000350 | generation of catalytic spliceosome for second transesterification step(GO:0000350) |
| 0.0 | 0.8 | GO:0010763 | positive regulation of fibroblast migration(GO:0010763) |
| 0.0 | 0.4 | GO:0010650 | positive regulation of cell communication by electrical coupling(GO:0010650) positive regulation of membrane depolarization during cardiac muscle cell action potential(GO:1900827) |
| 0.0 | 0.1 | GO:0003420 | regulation of growth plate cartilage chondrocyte proliferation(GO:0003420) |
| 0.0 | 0.2 | GO:1900028 | negative regulation of ruffle assembly(GO:1900028) |
| 0.0 | 0.2 | GO:1903624 | regulation of apoptotic DNA fragmentation(GO:1902510) regulation of DNA catabolic process(GO:1903624) |
| 0.0 | 0.1 | GO:0032532 | regulation of microvillus length(GO:0032532) |
| 0.0 | 0.8 | GO:0007200 | phospholipase C-activating G-protein coupled receptor signaling pathway(GO:0007200) |
| 0.0 | 0.3 | GO:0007413 | axonal fasciculation(GO:0007413) |
| 0.0 | 0.1 | GO:0032485 | regulation of Ral protein signal transduction(GO:0032485) |
| 0.0 | 0.2 | GO:0036120 | cellular response to platelet-derived growth factor stimulus(GO:0036120) |
| 0.0 | 1.9 | GO:0051028 | mRNA transport(GO:0051028) |
| 0.0 | 0.3 | GO:0072348 | sulfur compound transport(GO:0072348) |
| 0.0 | 0.4 | GO:0006879 | cellular iron ion homeostasis(GO:0006879) |
| 0.0 | 1.0 | GO:0002088 | lens development in camera-type eye(GO:0002088) |
| 0.0 | 0.6 | GO:0015914 | phospholipid transport(GO:0015914) |
| 0.0 | 0.3 | GO:0006379 | mRNA cleavage(GO:0006379) |
| 0.0 | 0.0 | GO:1904569 | regulation of selenocysteine incorporation(GO:1904569) |
Gene overrepresentation in cellular_component category:
| Log-likelihood per target | Total log-likelihood | Term | Description |
|---|---|---|---|
| 0.1 | 0.5 | GO:0042583 | chromaffin granule(GO:0042583) |
| 0.1 | 1.0 | GO:0005892 | acetylcholine-gated channel complex(GO:0005892) |
| 0.1 | 0.3 | GO:0097059 | CNTFR-CLCF1 complex(GO:0097059) |
| 0.1 | 0.4 | GO:0005726 | perichromatin fibrils(GO:0005726) |
| 0.1 | 0.8 | GO:0031209 | SCAR complex(GO:0031209) |
| 0.0 | 0.1 | GO:0031417 | NatC complex(GO:0031417) |
| 0.0 | 0.6 | GO:0032156 | septin cytoskeleton(GO:0032156) |
| 0.0 | 0.6 | GO:0034706 | voltage-gated sodium channel complex(GO:0001518) sodium channel complex(GO:0034706) |
| 0.0 | 1.8 | GO:0000307 | cyclin-dependent protein kinase holoenzyme complex(GO:0000307) |
| 0.0 | 0.9 | GO:0000780 | condensed nuclear chromosome, centromeric region(GO:0000780) |
| 0.0 | 0.2 | GO:0042825 | TAP complex(GO:0042825) |
| 0.0 | 0.4 | GO:0030126 | COPI vesicle coat(GO:0030126) |
| 0.0 | 0.4 | GO:0031235 | intrinsic component of the cytoplasmic side of the plasma membrane(GO:0031235) |
| 0.0 | 0.4 | GO:0014731 | spectrin-associated cytoskeleton(GO:0014731) |
| 0.0 | 0.1 | GO:0070776 | H3 histone acetyltransferase complex(GO:0070775) MOZ/MORF histone acetyltransferase complex(GO:0070776) |
| 0.0 | 0.5 | GO:0031430 | M band(GO:0031430) |
| 0.0 | 0.3 | GO:1990124 | messenger ribonucleoprotein complex(GO:1990124) |
| 0.0 | 1.2 | GO:0005581 | collagen trimer(GO:0005581) |
| 0.0 | 0.2 | GO:0031528 | microvillus membrane(GO:0031528) |
| 0.0 | 0.9 | GO:0005758 | mitochondrial intermembrane space(GO:0005758) |
Gene overrepresentation in molecular_function category:
| Log-likelihood per target | Total log-likelihood | Term | Description |
|---|---|---|---|
| 0.2 | 2.4 | GO:0048027 | mRNA 5'-UTR binding(GO:0048027) |
| 0.1 | 0.9 | GO:0042799 | histone methyltransferase activity (H4-K20 specific)(GO:0042799) |
| 0.1 | 1.5 | GO:0008191 | metalloendopeptidase inhibitor activity(GO:0008191) |
| 0.1 | 2.5 | GO:0005104 | fibroblast growth factor receptor binding(GO:0005104) |
| 0.1 | 0.6 | GO:1990050 | phosphatidic acid transporter activity(GO:1990050) |
| 0.1 | 1.0 | GO:0004889 | acetylcholine-activated cation-selective channel activity(GO:0004889) |
| 0.1 | 0.3 | GO:0051032 | nucleic acid transmembrane transporter activity(GO:0051032) RNA transmembrane transporter activity(GO:0051033) |
| 0.1 | 1.8 | GO:0070064 | proline-rich region binding(GO:0070064) |
| 0.1 | 0.2 | GO:0019153 | protein-disulfide reductase (glutathione) activity(GO:0019153) |
| 0.1 | 0.2 | GO:0000402 | open form four-way junction DNA binding(GO:0000401) crossed form four-way junction DNA binding(GO:0000402) |
| 0.1 | 0.2 | GO:0016174 | NAD(P)H oxidase activity(GO:0016174) |
| 0.1 | 0.3 | GO:0005005 | transmembrane-ephrin receptor activity(GO:0005005) |
| 0.0 | 1.0 | GO:0032183 | SUMO binding(GO:0032183) |
| 0.0 | 0.8 | GO:0008188 | neuropeptide receptor activity(GO:0008188) |
| 0.0 | 0.3 | GO:0004897 | ciliary neurotrophic factor receptor activity(GO:0004897) |
| 0.0 | 0.4 | GO:0030957 | Tat protein binding(GO:0030957) |
| 0.0 | 0.2 | GO:0004652 | polynucleotide adenylyltransferase activity(GO:0004652) |
| 0.0 | 0.1 | GO:0000386 | second spliceosomal transesterification activity(GO:0000386) |
| 0.0 | 0.6 | GO:0031402 | sodium ion binding(GO:0031402) |
| 0.0 | 0.8 | GO:0008093 | cytoskeletal adaptor activity(GO:0008093) |
| 0.0 | 0.8 | GO:0004708 | MAP kinase kinase activity(GO:0004708) |
| 0.0 | 1.5 | GO:0001105 | RNA polymerase II transcription coactivator activity(GO:0001105) |
| 0.0 | 0.5 | GO:0004707 | MAP kinase activity(GO:0004707) |
| 0.0 | 0.3 | GO:0005328 | neurotransmitter:sodium symporter activity(GO:0005328) |
| 0.0 | 0.1 | GO:0004614 | phosphoglucomutase activity(GO:0004614) |
| 0.0 | 0.9 | GO:0001205 | transcriptional activator activity, RNA polymerase II distal enhancer sequence-specific binding(GO:0001205) |
| 0.0 | 0.1 | GO:0015464 | acetylcholine receptor activity(GO:0015464) |
| 0.0 | 0.1 | GO:0035242 | protein-arginine omega-N asymmetric methyltransferase activity(GO:0035242) |
| 0.0 | 0.8 | GO:0008146 | sulfotransferase activity(GO:0008146) |
| 0.0 | 0.2 | GO:0005522 | profilin binding(GO:0005522) |
| 0.0 | 0.8 | GO:0048365 | Rac GTPase binding(GO:0048365) |
| 0.0 | 0.5 | GO:0004867 | serine-type endopeptidase inhibitor activity(GO:0004867) |
| 0.0 | 0.2 | GO:0034185 | apolipoprotein binding(GO:0034185) |