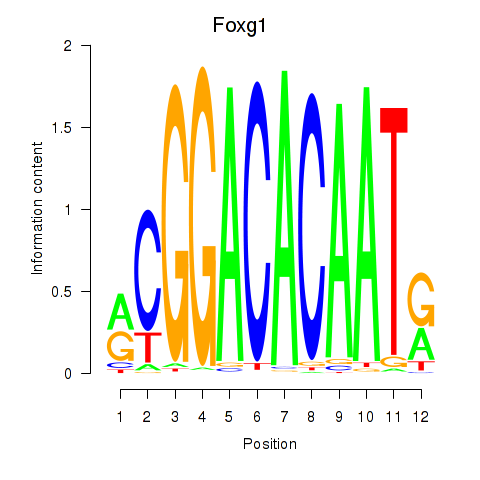
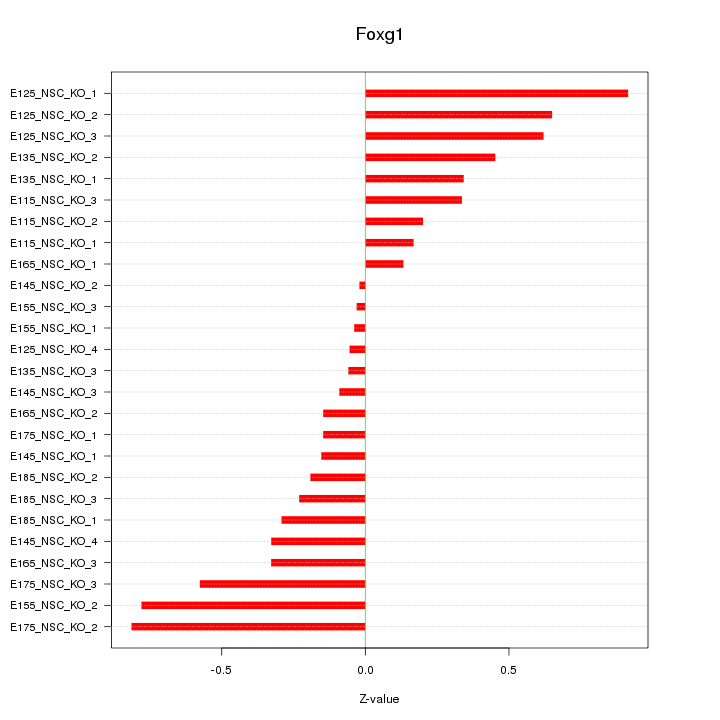
Motif ID: Foxg1
Z-value: 0.404
Transcription factors associated with Foxg1:
| Gene Symbol | Entrez ID | Gene Name |
|---|---|---|
| Foxg1 | ENSMUSG00000020950.9 | Foxg1 |
Activity-expression correlation:
| Gene Symbol | Promoter | Pearson corr. coef. | P-value | Plot |
|---|---|---|---|---|
| Foxg1 | mm10_v2_chr12_+_49383007_49383105 | -0.73 | 2.2e-05 | Click! |


Top targets:
Gene overrepresentation in biological_process category:
| Log-likelihood per target | Total log-likelihood | Term | Description |
|---|---|---|---|
| 0.5 | 4.7 | GO:0060613 | fat pad development(GO:0060613) |
| 0.3 | 1.0 | GO:2000974 | negative regulation of pro-B cell differentiation(GO:2000974) |
| 0.2 | 0.8 | GO:0051866 | general adaptation syndrome(GO:0051866) |
| 0.1 | 0.4 | GO:0090298 | positive regulation of fat cell proliferation(GO:0070346) negative regulation of mitochondrial DNA replication(GO:0090298) |
| 0.1 | 0.4 | GO:0071335 | hair follicle cell proliferation(GO:0071335) |
| 0.1 | 0.3 | GO:0072070 | establishment or maintenance of polarity of embryonic epithelium(GO:0016332) loop of Henle development(GO:0072070) metanephric loop of Henle development(GO:0072236) |
| 0.1 | 0.7 | GO:0043569 | negative regulation of insulin-like growth factor receptor signaling pathway(GO:0043569) |
| 0.1 | 1.1 | GO:0051451 | myoblast migration(GO:0051451) |
| 0.1 | 1.8 | GO:0001913 | T cell mediated cytotoxicity(GO:0001913) |
| 0.0 | 0.5 | GO:0009143 | nucleoside triphosphate catabolic process(GO:0009143) |
| 0.0 | 0.3 | GO:0050957 | equilibrioception(GO:0050957) |
| 0.0 | 0.1 | GO:0014886 | transition between slow and fast fiber(GO:0014886) |
| 0.0 | 0.1 | GO:2000832 | negative regulation of steroid hormone secretion(GO:2000832) negative regulation of corticosteroid hormone secretion(GO:2000847) negative regulation of glucocorticoid secretion(GO:2000850) |
| 0.0 | 0.1 | GO:0031509 | telomeric heterochromatin assembly(GO:0031509) negative regulation of chromosome condensation(GO:1902340) |
| 0.0 | 0.2 | GO:2000741 | positive regulation of mesenchymal stem cell differentiation(GO:2000741) |
| 0.0 | 0.3 | GO:0043248 | proteasome assembly(GO:0043248) |
Gene overrepresentation in cellular_component category:
| Log-likelihood per target | Total log-likelihood | Term | Description |
|---|---|---|---|
| 0.6 | 1.8 | GO:0089717 | spanning component of plasma membrane(GO:0044214) spanning component of membrane(GO:0089717) |
| 0.2 | 0.7 | GO:0036454 | insulin-like growth factor binding protein complex(GO:0016942) growth factor complex(GO:0036454) insulin-like growth factor ternary complex(GO:0042567) |
| 0.1 | 0.4 | GO:0070578 | RISC-loading complex(GO:0070578) |
| 0.0 | 0.7 | GO:0000315 | organellar large ribosomal subunit(GO:0000315) mitochondrial large ribosomal subunit(GO:0005762) |
| 0.0 | 0.1 | GO:0001740 | Barr body(GO:0001740) |
Gene overrepresentation in molecular_function category:
| Log-likelihood per target | Total log-likelihood | Term | Description |
|---|---|---|---|
| 0.4 | 4.7 | GO:0003680 | AT DNA binding(GO:0003680) |
| 0.2 | 1.8 | GO:0046703 | natural killer cell lectin-like receptor binding(GO:0046703) |
| 0.1 | 0.5 | GO:0004528 | phosphodiesterase I activity(GO:0004528) |
| 0.1 | 0.7 | GO:0031995 | insulin-like growth factor II binding(GO:0031995) |
| 0.1 | 0.4 | GO:0070883 | pre-miRNA binding(GO:0070883) |
| 0.1 | 0.3 | GO:1902379 | chemoattractant activity involved in axon guidance(GO:1902379) |
| 0.1 | 1.1 | GO:0017049 | GTP-Rho binding(GO:0017049) |
| 0.0 | 0.8 | GO:0035259 | glucocorticoid receptor binding(GO:0035259) |
| 0.0 | 1.0 | GO:0003690 | double-stranded DNA binding(GO:0003690) |
| 0.0 | 0.4 | GO:0008422 | beta-glucosidase activity(GO:0008422) |
| 0.0 | 0.1 | GO:0004726 | non-membrane spanning protein tyrosine phosphatase activity(GO:0004726) |