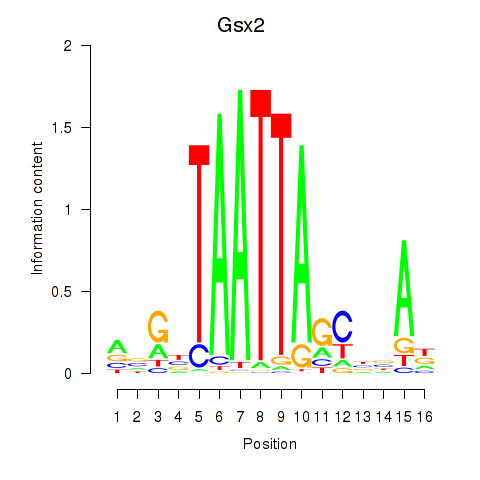
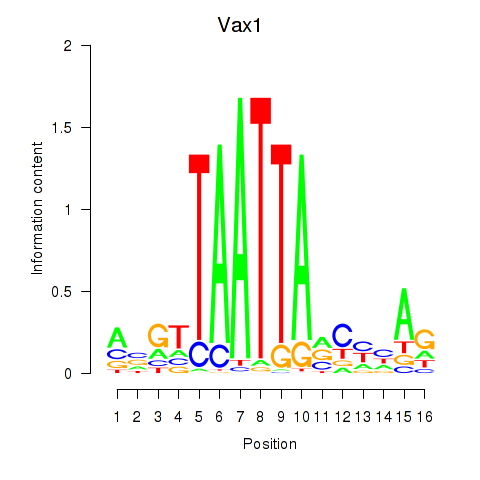
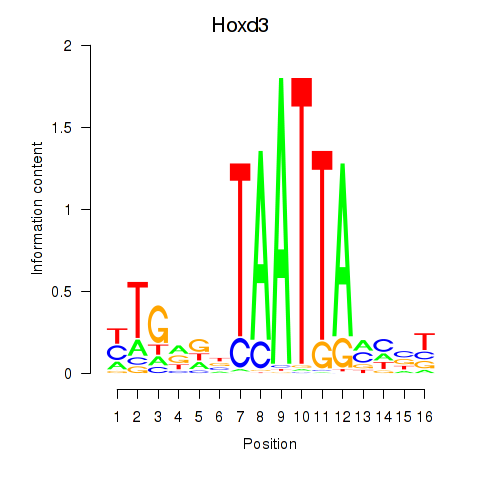
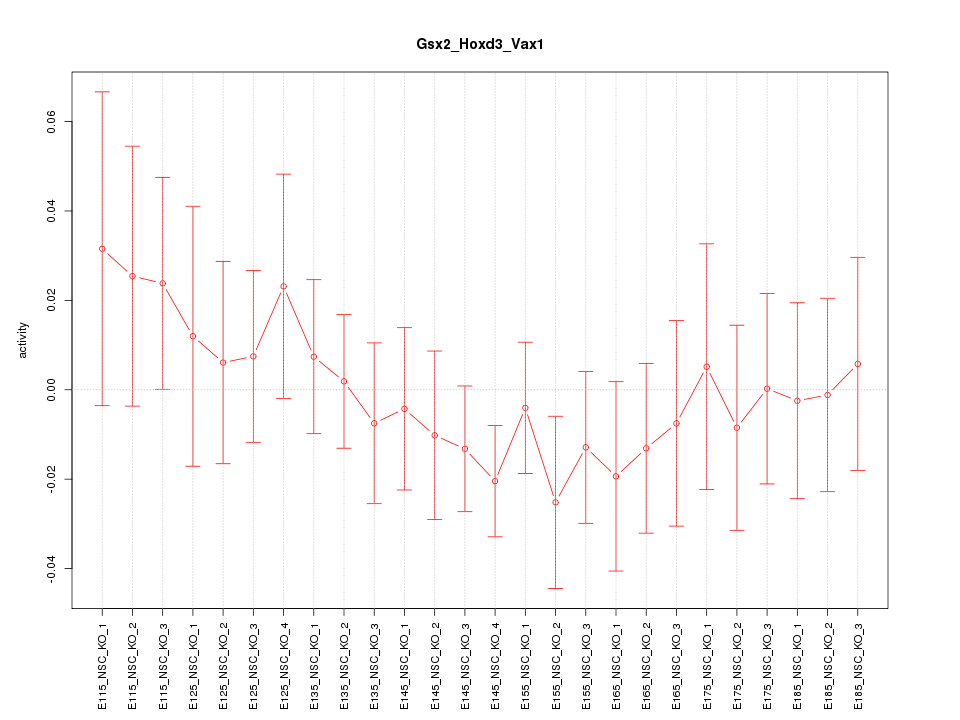
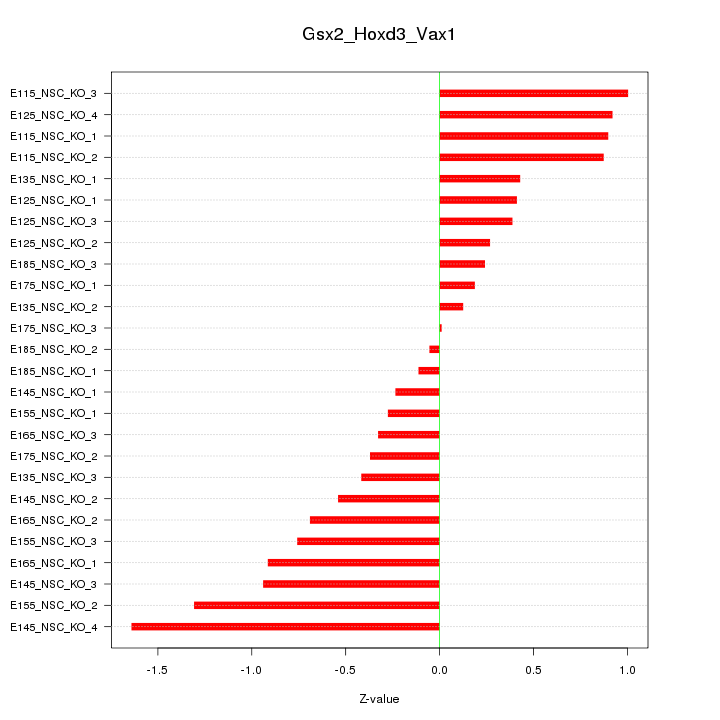
Motif ID: Gsx2_Hoxd3_Vax1
Z-value: 0.683
Transcription factors associated with Gsx2_Hoxd3_Vax1:
| Gene Symbol | Entrez ID | Gene Name |
|---|---|---|
| Gsx2 | ENSMUSG00000035946.6 | Gsx2 |
| Hoxd3 | ENSMUSG00000079277.3 | Hoxd3 |
| Vax1 | ENSMUSG00000006270.6 | Vax1 |
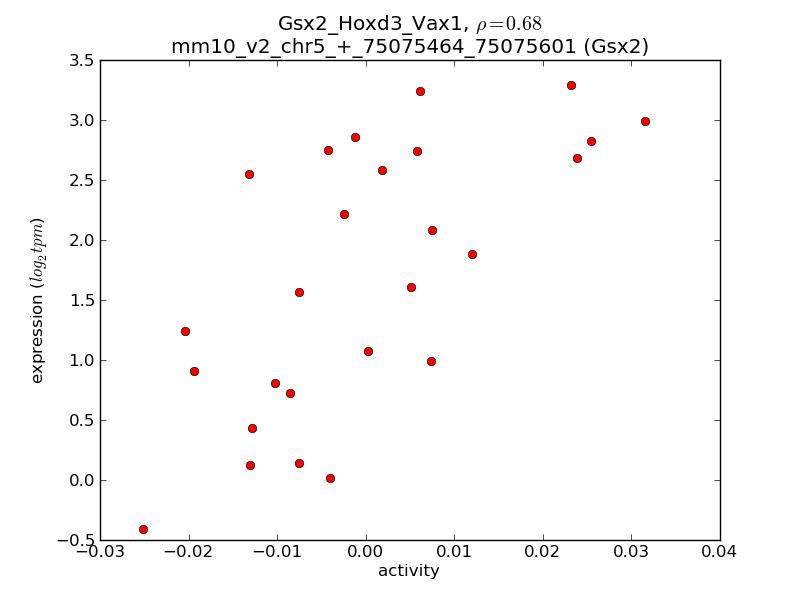
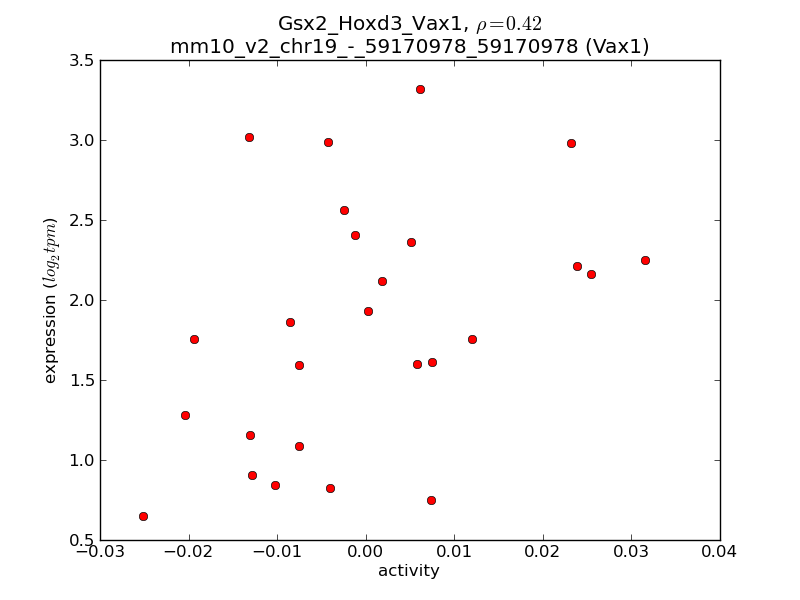
Activity-expression correlation:
| Gene Symbol | Promoter | Pearson corr. coef. | P-value | Plot |
|---|---|---|---|---|
| Gsx2 | mm10_v2_chr5_+_75075464_75075601 | 0.68 | 1.4e-04 | Click! |
| Vax1 | mm10_v2_chr19_-_59170978_59170978 | 0.42 | 3.1e-02 | Click! |

Top targets:
Gene overrepresentation in biological_process category:
| Log-likelihood per target | Total log-likelihood | Term | Description |
|---|---|---|---|
| 1.3 | 3.8 | GO:0072204 | cell-cell signaling involved in kidney development(GO:0060995) Wnt signaling pathway involved in kidney development(GO:0061289) canonical Wnt signaling pathway involved in metanephric kidney development(GO:0061290) cell-cell signaling involved in metanephros development(GO:0072204) |
| 1.1 | 4.4 | GO:0046552 | eye photoreceptor cell fate commitment(GO:0042706) photoreceptor cell fate commitment(GO:0046552) |
| 0.7 | 2.1 | GO:0035880 | embryonic nail plate morphogenesis(GO:0035880) |
| 0.7 | 2.0 | GO:0003221 | right ventricular cardiac muscle tissue morphogenesis(GO:0003221) |
| 0.3 | 1.0 | GO:0006059 | hexitol metabolic process(GO:0006059) alditol biosynthetic process(GO:0019401) |
| 0.3 | 2.6 | GO:0048625 | myoblast fate commitment(GO:0048625) |
| 0.3 | 1.6 | GO:0014719 | skeletal muscle satellite cell activation(GO:0014719) |
| 0.3 | 1.7 | GO:0021797 | forebrain anterior/posterior pattern specification(GO:0021797) |
| 0.3 | 5.1 | GO:0001833 | inner cell mass cell proliferation(GO:0001833) |
| 0.3 | 0.9 | GO:1904395 | regulation of skeletal muscle acetylcholine-gated channel clustering(GO:1904393) positive regulation of skeletal muscle acetylcholine-gated channel clustering(GO:1904395) |
| 0.2 | 0.7 | GO:1902498 | regulation of protein autoubiquitination(GO:1902498) |
| 0.2 | 0.5 | GO:0008228 | opsonization(GO:0008228) modulation of molecular function in other organism(GO:0044359) negative regulation of molecular function in other organism(GO:0044362) negative regulation of molecular function in other organism involved in symbiotic interaction(GO:0052204) modulation of molecular function in other organism involved in symbiotic interaction(GO:0052205) negative regulation by host of symbiont molecular function(GO:0052405) modification by host of symbiont molecular function(GO:0052428) |
| 0.2 | 0.8 | GO:0015819 | lysine transport(GO:0015819) |
| 0.2 | 0.6 | GO:0006933 | negative regulation of cell adhesion involved in substrate-bound cell migration(GO:0006933) |
| 0.1 | 0.7 | GO:0006348 | chromatin silencing at telomere(GO:0006348) |
| 0.1 | 0.4 | GO:0050929 | corticospinal neuron axon guidance through spinal cord(GO:0021972) positive regulation of negative chemotaxis(GO:0050924) induction of negative chemotaxis(GO:0050929) negative regulation of mononuclear cell migration(GO:0071676) negative regulation of retinal ganglion cell axon guidance(GO:0090260) |
| 0.1 | 0.4 | GO:0045819 | positive regulation of glycogen catabolic process(GO:0045819) |
| 0.1 | 1.4 | GO:0031017 | exocrine pancreas development(GO:0031017) |
| 0.1 | 0.3 | GO:0035633 | maintenance of blood-brain barrier(GO:0035633) |
| 0.1 | 0.3 | GO:0015960 | diadenosine polyphosphate biosynthetic process(GO:0015960) diadenosine tetraphosphate metabolic process(GO:0015965) diadenosine tetraphosphate biosynthetic process(GO:0015966) |
| 0.1 | 3.9 | GO:0051693 | actin filament capping(GO:0051693) |
| 0.1 | 0.5 | GO:0051461 | protein import into peroxisome matrix, docking(GO:0016560) regulation of corticotropin secretion(GO:0051459) positive regulation of corticotropin secretion(GO:0051461) |
| 0.1 | 0.2 | GO:1900149 | positive regulation of Schwann cell migration(GO:1900149) |
| 0.1 | 1.1 | GO:0048387 | negative regulation of retinoic acid receptor signaling pathway(GO:0048387) |
| 0.1 | 0.2 | GO:0010757 | arachidonic acid metabolite production involved in inflammatory response(GO:0002538) negative regulation of plasminogen activation(GO:0010757) regulation of vascular wound healing(GO:0061043) regulation of smooth muscle cell-matrix adhesion(GO:2000097) |
| 0.1 | 0.6 | GO:0045602 | negative regulation of endothelial cell differentiation(GO:0045602) |
| 0.0 | 1.2 | GO:0032331 | negative regulation of chondrocyte differentiation(GO:0032331) |
| 0.0 | 0.3 | GO:0061732 | mitochondrial acetyl-CoA biosynthetic process from pyruvate(GO:0061732) |
| 0.0 | 0.3 | GO:0060923 | cardiac muscle cell fate commitment(GO:0060923) |
| 0.0 | 0.7 | GO:0050860 | negative regulation of T cell receptor signaling pathway(GO:0050860) |
| 0.0 | 0.6 | GO:1903504 | regulation of mitotic cell cycle spindle assembly checkpoint(GO:0090266) regulation of mitotic spindle checkpoint(GO:1903504) |
| 0.0 | 1.9 | GO:0030901 | midbrain development(GO:0030901) |
| 0.0 | 0.2 | GO:0035553 | oxidative RNA demethylation(GO:0035513) oxidative single-stranded RNA demethylation(GO:0035553) |
| 0.0 | 0.2 | GO:0035428 | hexose transmembrane transport(GO:0035428) |
| 0.0 | 0.5 | GO:0006670 | sphingosine metabolic process(GO:0006670) |
| 0.0 | 0.1 | GO:0009106 | lipoate metabolic process(GO:0009106) |
| 0.0 | 1.1 | GO:0007638 | mechanosensory behavior(GO:0007638) |
| 0.0 | 0.1 | GO:0090365 | regulation of mRNA modification(GO:0090365) |
| 0.0 | 0.1 | GO:0009193 | pyrimidine ribonucleoside diphosphate metabolic process(GO:0009193) UDP metabolic process(GO:0046048) |
| 0.0 | 0.1 | GO:0071596 | ubiquitin-dependent protein catabolic process via the N-end rule pathway(GO:0071596) |
| 0.0 | 0.1 | GO:0070562 | regulation of vitamin D receptor signaling pathway(GO:0070562) |
| 0.0 | 1.6 | GO:0051489 | regulation of filopodium assembly(GO:0051489) |
| 0.0 | 0.3 | GO:0031937 | positive regulation of chromatin silencing(GO:0031937) |
| 0.0 | 0.4 | GO:0006107 | oxaloacetate metabolic process(GO:0006107) |
| 0.0 | 0.1 | GO:0061341 | non-canonical Wnt signaling pathway involved in heart development(GO:0061341) planar cell polarity pathway involved in heart morphogenesis(GO:0061346) |
| 0.0 | 0.6 | GO:0006907 | pinocytosis(GO:0006907) |
| 0.0 | 0.7 | GO:0048791 | calcium ion-regulated exocytosis of neurotransmitter(GO:0048791) |
| 0.0 | 0.1 | GO:0032512 | regulation of protein phosphatase type 2B activity(GO:0032512) positive regulation of ryanodine-sensitive calcium-release channel activity(GO:0060316) positive regulation of cAMP-dependent protein kinase activity(GO:2000481) |
| 0.0 | 0.2 | GO:1990173 | protein localization to nuclear body(GO:1903405) protein localization to Cajal body(GO:1904867) regulation of protein localization to Cajal body(GO:1904869) positive regulation of protein localization to Cajal body(GO:1904871) protein localization to nucleoplasm(GO:1990173) |
| 0.0 | 0.4 | GO:0034453 | microtubule anchoring(GO:0034453) |
| 0.0 | 0.1 | GO:1990118 | sodium ion import across plasma membrane(GO:0098719) sodium ion import into cell(GO:1990118) |
| 0.0 | 0.2 | GO:0060134 | prepulse inhibition(GO:0060134) |
| 0.0 | 0.4 | GO:0051044 | positive regulation of membrane protein ectodomain proteolysis(GO:0051044) |
| 0.0 | 0.3 | GO:0097352 | autophagosome maturation(GO:0097352) |
| 0.0 | 0.5 | GO:0031365 | N-terminal protein amino acid modification(GO:0031365) |
| 0.0 | 0.1 | GO:0003215 | cardiac right ventricle morphogenesis(GO:0003215) |
| 0.0 | 0.2 | GO:0043968 | histone H2A acetylation(GO:0043968) |
| 0.0 | 0.0 | GO:0090310 | negative regulation of methylation-dependent chromatin silencing(GO:0090310) |
Gene overrepresentation in cellular_component category:
| Log-likelihood per target | Total log-likelihood | Term | Description |
|---|---|---|---|
| 0.3 | 2.6 | GO:0070369 | beta-catenin-TCF7L2 complex(GO:0070369) |
| 0.3 | 1.0 | GO:0097454 | Schwann cell microvillus(GO:0097454) |
| 0.3 | 1.3 | GO:0008623 | CHRAC(GO:0008623) |
| 0.1 | 0.5 | GO:0017071 | intracellular cyclic nucleotide activated cation channel complex(GO:0017071) |
| 0.1 | 0.6 | GO:0045261 | mitochondrial proton-transporting ATP synthase complex, catalytic core F(1)(GO:0000275) proton-transporting ATP synthase complex, catalytic core F(1)(GO:0045261) |
| 0.1 | 0.9 | GO:0016600 | flotillin complex(GO:0016600) |
| 0.1 | 0.4 | GO:0070695 | FHF complex(GO:0070695) |
| 0.0 | 0.3 | GO:0045254 | pyruvate dehydrogenase complex(GO:0045254) |
| 0.0 | 1.4 | GO:0032839 | dendrite cytoplasm(GO:0032839) |
| 0.0 | 0.2 | GO:0042583 | chromaffin granule(GO:0042583) |
| 0.0 | 0.2 | GO:0033093 | Weibel-Palade body(GO:0033093) |
| 0.0 | 5.2 | GO:0000792 | heterochromatin(GO:0000792) |
| 0.0 | 0.1 | GO:0005726 | perichromatin fibrils(GO:0005726) |
| 0.0 | 0.3 | GO:0017101 | aminoacyl-tRNA synthetase multienzyme complex(GO:0017101) |
| 0.0 | 0.6 | GO:0016327 | apicolateral plasma membrane(GO:0016327) |
| 0.0 | 0.7 | GO:0001891 | phagocytic cup(GO:0001891) |
| 0.0 | 0.2 | GO:0060091 | kinocilium(GO:0060091) |
| 0.0 | 1.6 | GO:0016459 | myosin complex(GO:0016459) |
| 0.0 | 1.9 | GO:0005881 | cytoplasmic microtubule(GO:0005881) |
| 0.0 | 0.2 | GO:0005832 | chaperonin-containing T-complex(GO:0005832) |
| 0.0 | 0.6 | GO:0005680 | anaphase-promoting complex(GO:0005680) |
| 0.0 | 1.1 | GO:0045335 | phagocytic vesicle(GO:0045335) |
| 0.0 | 0.6 | GO:0055038 | recycling endosome membrane(GO:0055038) |
| 0.0 | 4.4 | GO:0030426 | growth cone(GO:0030426) |
| 0.0 | 0.4 | GO:0033276 | transcription factor TFTC complex(GO:0033276) |
| 0.0 | 0.1 | GO:0060187 | cell pole(GO:0060187) |
| 0.0 | 0.9 | GO:0030315 | T-tubule(GO:0030315) |
Gene overrepresentation in molecular_function category:
| Log-likelihood per target | Total log-likelihood | Term | Description |
|---|---|---|---|
| 0.3 | 3.8 | GO:0016500 | protein-hormone receptor activity(GO:0016500) |
| 0.1 | 1.4 | GO:0031852 | mu-type opioid receptor binding(GO:0031852) |
| 0.1 | 1.1 | GO:0070290 | N-acylphosphatidylethanolamine-specific phospholipase D activity(GO:0070290) |
| 0.1 | 0.4 | GO:0000402 | open form four-way junction DNA binding(GO:0000401) crossed form four-way junction DNA binding(GO:0000402) |
| 0.1 | 2.0 | GO:1990841 | promoter-specific chromatin binding(GO:1990841) |
| 0.1 | 0.5 | GO:0005052 | peroxisome matrix targeting signal-1 binding(GO:0005052) |
| 0.1 | 0.8 | GO:0015016 | [heparan sulfate]-glucosamine N-sulfotransferase activity(GO:0015016) |
| 0.1 | 0.8 | GO:0015189 | L-ornithine transmembrane transporter activity(GO:0000064) arginine transmembrane transporter activity(GO:0015181) L-lysine transmembrane transporter activity(GO:0015189) |
| 0.1 | 2.6 | GO:0045295 | gamma-catenin binding(GO:0045295) |
| 0.1 | 0.9 | GO:0031432 | titin binding(GO:0031432) |
| 0.1 | 1.6 | GO:0045125 | bioactive lipid receptor activity(GO:0045125) |
| 0.1 | 0.5 | GO:0001849 | complement component C1q binding(GO:0001849) |
| 0.1 | 0.2 | GO:0005118 | sevenless binding(GO:0005118) |
| 0.1 | 0.4 | GO:0046912 | transferase activity, transferring acyl groups, acyl groups converted into alkyl on transfer(GO:0046912) |
| 0.1 | 0.4 | GO:0043237 | laminin-1 binding(GO:0043237) |
| 0.1 | 0.3 | GO:0034604 | pyruvate dehydrogenase activity(GO:0004738) pyruvate dehydrogenase [NAD(P)+] activity(GO:0034603) pyruvate dehydrogenase (NAD+) activity(GO:0034604) |
| 0.1 | 0.4 | GO:0070191 | methionine-R-sulfoxide reductase activity(GO:0070191) |
| 0.1 | 1.1 | GO:0070410 | co-SMAD binding(GO:0070410) |
| 0.1 | 0.6 | GO:0046933 | proton-transporting ATP synthase activity, rotational mechanism(GO:0046933) |
| 0.0 | 0.2 | GO:0035515 | oxidative RNA demethylase activity(GO:0035515) |
| 0.0 | 0.7 | GO:0010485 | H4 histone acetyltransferase activity(GO:0010485) |
| 0.0 | 1.0 | GO:0004032 | alditol:NADP+ 1-oxidoreductase activity(GO:0004032) |
| 0.0 | 0.6 | GO:0042813 | Wnt-activated receptor activity(GO:0042813) |
| 0.0 | 0.9 | GO:0034185 | apolipoprotein binding(GO:0034185) |
| 0.0 | 0.6 | GO:0015129 | lactate transmembrane transporter activity(GO:0015129) |
| 0.0 | 0.1 | GO:0034056 | estrogen response element binding(GO:0034056) |
| 0.0 | 10.6 | GO:0001077 | transcriptional activator activity, RNA polymerase II core promoter proximal region sequence-specific binding(GO:0001077) |
| 0.0 | 1.2 | GO:0005109 | frizzled binding(GO:0005109) |
| 0.0 | 1.6 | GO:0030507 | spectrin binding(GO:0030507) |
| 0.0 | 0.4 | GO:0019855 | calcium channel inhibitor activity(GO:0019855) |
| 0.0 | 0.5 | GO:0017161 | phosphohistidine phosphatase activity(GO:0008969) inositol-1,3,4-trisphosphate 4-phosphatase activity(GO:0017161) NADP phosphatase activity(GO:0019178) 5-amino-6-(5-phosphoribitylamino)uracil phosphatase activity(GO:0043726) phosphatidylinositol-3,5-bisphosphate 5-phosphatase activity(GO:0043813) inositol-1,3,4,5,6-pentakisphosphate 1-phosphatase activity(GO:0052825) inositol-3,4-bisphosphate 4-phosphatase activity(GO:0052828) inositol-1,3,4-trisphosphate 1-phosphatase activity(GO:0052829) inositol-1,3,4,6-tetrakisphosphate 6-phosphatase activity(GO:0052830) inositol-1,3,4,6-tetrakisphosphate 1-phosphatase activity(GO:0052831) phosphatidylinositol-1,4,5-trisphosphate 5-phosphatase activity(GO:0052867) IDP phosphatase activity(GO:1990003) |
| 0.0 | 0.2 | GO:0019865 | immunoglobulin binding(GO:0019865) |
| 0.0 | 3.5 | GO:0000978 | RNA polymerase II core promoter proximal region sequence-specific DNA binding(GO:0000978) |
| 0.0 | 0.7 | GO:0031435 | mitogen-activated protein kinase kinase kinase binding(GO:0031435) |
| 0.0 | 0.1 | GO:0005451 | monovalent cation:proton antiporter activity(GO:0005451) sodium:proton antiporter activity(GO:0015385) potassium:proton antiporter activity(GO:0015386) |
| 0.0 | 0.7 | GO:0005544 | calcium-dependent phospholipid binding(GO:0005544) |
| 0.0 | 0.1 | GO:0022821 | calcium, potassium:sodium antiporter activity(GO:0008273) potassium ion antiporter activity(GO:0022821) |
| 0.0 | 0.2 | GO:0005355 | glucose transmembrane transporter activity(GO:0005355) |
| 0.0 | 0.1 | GO:0030292 | protein tyrosine kinase inhibitor activity(GO:0030292) |
| 0.0 | 0.1 | GO:0016594 | glycine binding(GO:0016594) |
| 0.0 | 0.2 | GO:0016805 | dipeptidase activity(GO:0016805) |
| 0.0 | 0.4 | GO:0017134 | fibroblast growth factor binding(GO:0017134) |
| 0.0 | 0.1 | GO:0045134 | uridine-diphosphatase activity(GO:0045134) |
| 0.0 | 0.2 | GO:0001103 | RNA polymerase II repressing transcription factor binding(GO:0001103) |
| 0.0 | 0.1 | GO:0043495 | protein anchor(GO:0043495) |
| 0.0 | 0.1 | GO:0034951 | pivalyl-CoA mutase activity(GO:0034784) o-hydroxylaminobenzoate mutase activity(GO:0034951) lupeol synthase activity(GO:0042299) beta-amyrin synthase activity(GO:0042300) baruol synthase activity(GO:0080011) |
| 0.0 | 0.2 | GO:0044183 | protein binding involved in protein folding(GO:0044183) |
|
|
|
|