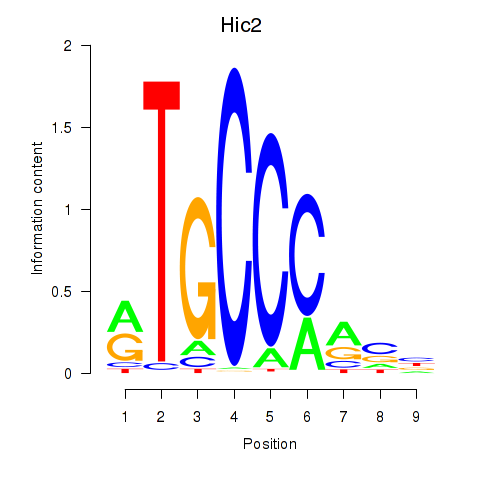
Motif ID: Hic2
Z-value: 2.550
Transcription factors associated with Hic2:
| Gene Symbol | Entrez ID | Gene Name |
|---|---|---|
| Hic2 | ENSMUSG00000050240.8 | Hic2 |
Activity-expression correlation:
| Gene Symbol | Promoter | Pearson corr. coef. | P-value | Plot |
|---|---|---|---|---|
| Hic2 | mm10_v2_chr16_+_17233560_17233664 | -0.71 | 4.7e-05 | Click! |


Top targets:
Gene overrepresentation in biological_process category:
| Log-likelihood per target | Total log-likelihood | Term | Description |
|---|---|---|---|
| 4.7 | 14.1 | GO:0032241 | positive regulation of nucleobase-containing compound transport(GO:0032241) regulation of nucleoside transport(GO:0032242) negative regulation of circadian sleep/wake cycle, non-REM sleep(GO:0042323) negative regulation of mucus secretion(GO:0070256) |
| 3.9 | 15.5 | GO:0014012 | peripheral nervous system axon regeneration(GO:0014012) |
| 3.5 | 55.7 | GO:1900454 | positive regulation of long term synaptic depression(GO:1900454) |
| 3.2 | 12.8 | GO:1901204 | positive regulation of guanylate cyclase activity(GO:0031284) regulation of adrenergic receptor signaling pathway involved in heart process(GO:1901204) |
| 2.4 | 9.5 | GO:0021586 | pons maturation(GO:0021586) |
| 2.2 | 8.7 | GO:0021564 | glossopharyngeal nerve development(GO:0021563) vagus nerve development(GO:0021564) |
| 2.2 | 34.7 | GO:0021902 | commitment of neuronal cell to specific neuron type in forebrain(GO:0021902) |
| 2.1 | 10.6 | GO:0035093 | spermatogenesis, exchange of chromosomal proteins(GO:0035093) |
| 2.1 | 4.2 | GO:0035990 | tendon cell differentiation(GO:0035990) tendon formation(GO:0035992) |
| 2.0 | 6.0 | GO:0017055 | negative regulation of RNA polymerase II transcriptional preinitiation complex assembly(GO:0017055) |
| 2.0 | 11.9 | GO:0007217 | tachykinin receptor signaling pathway(GO:0007217) |
| 1.9 | 11.6 | GO:0000160 | phosphorelay signal transduction system(GO:0000160) |
| 1.8 | 5.5 | GO:2000344 | positive regulation of acrosome reaction(GO:2000344) |
| 1.8 | 5.3 | GO:0050915 | sensory perception of sour taste(GO:0050915) |
| 1.7 | 3.4 | GO:2000852 | regulation of corticosterone secretion(GO:2000852) |
| 1.7 | 5.0 | GO:1903054 | negative regulation of extracellular matrix organization(GO:1903054) |
| 1.6 | 9.7 | GO:0060718 | chorionic trophoblast cell differentiation(GO:0060718) |
| 1.6 | 4.7 | GO:0046340 | diacylglycerol catabolic process(GO:0046340) |
| 1.5 | 4.5 | GO:0050925 | negative regulation of negative chemotaxis(GO:0050925) |
| 1.5 | 5.8 | GO:0021812 | neuronal-glial interaction involved in cerebral cortex radial glia guided migration(GO:0021812) |
| 1.4 | 5.8 | GO:1903802 | positive regulation of arachidonic acid secretion(GO:0090238) L-glutamate(1-) import into cell(GO:1903802) L-glutamate import into cell(GO:1990123) |
| 1.4 | 4.2 | GO:1900736 | regulation of phospholipase C-activating G-protein coupled receptor signaling pathway(GO:1900736) |
| 1.4 | 4.2 | GO:1904457 | positive regulation of neuronal action potential(GO:1904457) |
| 1.3 | 4.0 | GO:0030321 | transepithelial chloride transport(GO:0030321) |
| 1.3 | 1.3 | GO:2000830 | vacuolar phosphate transport(GO:0007037) vitamin D3 metabolic process(GO:0070640) positive regulation of parathyroid hormone secretion(GO:2000830) |
| 1.3 | 3.9 | GO:0071544 | diphosphoinositol polyphosphate metabolic process(GO:0071543) diphosphoinositol polyphosphate catabolic process(GO:0071544) |
| 1.3 | 3.9 | GO:1902460 | regulation of mesenchymal stem cell proliferation(GO:1902460) positive regulation of mesenchymal stem cell proliferation(GO:1902462) |
| 1.2 | 5.0 | GO:0060666 | dichotomous subdivision of terminal units involved in salivary gland branching(GO:0060666) |
| 1.2 | 1.2 | GO:0003219 | cardiac right ventricle formation(GO:0003219) |
| 1.2 | 5.8 | GO:0010624 | regulation of Schwann cell proliferation(GO:0010624) |
| 1.1 | 3.4 | GO:0042560 | 10-formyltetrahydrofolate catabolic process(GO:0009258) folic acid-containing compound catabolic process(GO:0009397) pteridine-containing compound catabolic process(GO:0042560) |
| 1.1 | 3.2 | GO:0051542 | elastin biosynthetic process(GO:0051542) |
| 1.1 | 3.2 | GO:0043988 | histone H3-S28 phosphorylation(GO:0043988) |
| 1.1 | 4.2 | GO:1904177 | regulation of adipose tissue development(GO:1904177) |
| 1.0 | 2.9 | GO:0097500 | receptor localization to nonmotile primary cilium(GO:0097500) |
| 1.0 | 2.9 | GO:0034334 | adherens junction maintenance(GO:0034334) |
| 1.0 | 3.8 | GO:2001106 | regulation of Rho guanyl-nucleotide exchange factor activity(GO:2001106) |
| 1.0 | 14.3 | GO:0021957 | corticospinal tract morphogenesis(GO:0021957) |
| 0.9 | 0.9 | GO:0046544 | development of secondary male sexual characteristics(GO:0046544) |
| 0.9 | 4.7 | GO:0070305 | response to cGMP(GO:0070305) cellular response to cGMP(GO:0071321) |
| 0.9 | 4.6 | GO:0019086 | regulation of transcription from RNA polymerase II promoter by glucose(GO:0000430) positive regulation of transcription from RNA polymerase II promoter by glucose(GO:0000432) late viral transcription(GO:0019086) |
| 0.9 | 3.7 | GO:0050913 | sensory perception of bitter taste(GO:0050913) |
| 0.9 | 4.6 | GO:0045578 | negative regulation of B cell differentiation(GO:0045578) epithelial cell differentiation involved in mammary gland alveolus development(GO:0061030) |
| 0.9 | 8.1 | GO:0060665 | regulation of branching involved in salivary gland morphogenesis by mesenchymal-epithelial signaling(GO:0060665) |
| 0.9 | 2.6 | GO:0060596 | mammary placode formation(GO:0060596) |
| 0.9 | 4.3 | GO:0021636 | trigeminal nerve morphogenesis(GO:0021636) trigeminal nerve structural organization(GO:0021637) |
| 0.9 | 1.7 | GO:0038161 | prolactin signaling pathway(GO:0038161) |
| 0.8 | 3.2 | GO:0030913 | paranodal junction assembly(GO:0030913) |
| 0.8 | 2.4 | GO:1902219 | regulation of intrinsic apoptotic signaling pathway in response to osmotic stress(GO:1902218) negative regulation of intrinsic apoptotic signaling pathway in response to osmotic stress(GO:1902219) |
| 0.8 | 7.6 | GO:2000489 | hepatic stellate cell activation(GO:0035733) regulation of hepatic stellate cell activation(GO:2000489) |
| 0.8 | 3.0 | GO:2001016 | positive regulation of skeletal muscle cell differentiation(GO:2001016) |
| 0.7 | 10.5 | GO:0045161 | neuronal ion channel clustering(GO:0045161) |
| 0.7 | 0.7 | GO:0010593 | negative regulation of lamellipodium assembly(GO:0010593) |
| 0.7 | 3.6 | GO:1900242 | regulation of synaptic vesicle endocytosis(GO:1900242) |
| 0.7 | 2.8 | GO:2000427 | positive regulation of apoptotic cell clearance(GO:2000427) |
| 0.7 | 4.2 | GO:0032796 | uropod organization(GO:0032796) |
| 0.7 | 2.1 | GO:2000170 | positive regulation of peptidyl-cysteine S-nitrosylation(GO:2000170) |
| 0.7 | 4.8 | GO:0035902 | response to immobilization stress(GO:0035902) |
| 0.7 | 2.1 | GO:2000169 | regulation of peptidyl-cysteine S-nitrosylation(GO:2000169) |
| 0.7 | 2.0 | GO:0018214 | peptidyl-glutamic acid carboxylation(GO:0017187) protein carboxylation(GO:0018214) |
| 0.7 | 11.3 | GO:0045792 | negative regulation of cell size(GO:0045792) |
| 0.7 | 3.3 | GO:0030259 | lipid glycosylation(GO:0030259) |
| 0.7 | 2.0 | GO:0048865 | stem cell fate commitment(GO:0048865) stem cell fate specification(GO:0048866) |
| 0.6 | 2.5 | GO:2000211 | regulation of glutamate metabolic process(GO:2000211) |
| 0.6 | 2.5 | GO:1903288 | regulation of potassium ion import(GO:1903286) positive regulation of potassium ion import(GO:1903288) |
| 0.6 | 3.1 | GO:0019236 | response to pheromone(GO:0019236) |
| 0.6 | 4.9 | GO:0005513 | detection of calcium ion(GO:0005513) |
| 0.6 | 5.5 | GO:0033631 | cell-cell adhesion mediated by integrin(GO:0033631) |
| 0.6 | 3.6 | GO:0046103 | ADP biosynthetic process(GO:0006172) inosine biosynthetic process(GO:0046103) |
| 0.6 | 0.6 | GO:0055119 | relaxation of cardiac muscle(GO:0055119) regulation of relaxation of cardiac muscle(GO:1901897) |
| 0.6 | 3.0 | GO:2000574 | regulation of microtubule motor activity(GO:2000574) |
| 0.6 | 4.7 | GO:0032261 | purine nucleotide salvage(GO:0032261) IMP salvage(GO:0032264) |
| 0.6 | 4.7 | GO:0016338 | calcium-independent cell-cell adhesion via plasma membrane cell-adhesion molecules(GO:0016338) |
| 0.6 | 2.3 | GO:0003430 | growth plate cartilage chondrocyte growth(GO:0003430) Harderian gland development(GO:0070384) |
| 0.6 | 2.3 | GO:1903800 | positive regulation of production of miRNAs involved in gene silencing by miRNA(GO:1903800) |
| 0.6 | 7.5 | GO:0043252 | sodium-independent organic anion transport(GO:0043252) |
| 0.6 | 4.0 | GO:0045200 | establishment or maintenance of neuroblast polarity(GO:0045196) establishment of neuroblast polarity(GO:0045200) |
| 0.6 | 10.7 | GO:0001553 | luteinization(GO:0001553) |
| 0.5 | 1.6 | GO:0070375 | ERK5 cascade(GO:0070375) |
| 0.5 | 2.7 | GO:2000310 | regulation of N-methyl-D-aspartate selective glutamate receptor activity(GO:2000310) |
| 0.5 | 1.6 | GO:0006420 | arginyl-tRNA aminoacylation(GO:0006420) |
| 0.5 | 2.2 | GO:0038145 | macrophage colony-stimulating factor signaling pathway(GO:0038145) |
| 0.5 | 2.7 | GO:0097116 | gephyrin clustering involved in postsynaptic density assembly(GO:0097116) |
| 0.5 | 4.3 | GO:0031547 | brain-derived neurotrophic factor receptor signaling pathway(GO:0031547) |
| 0.5 | 2.7 | GO:0018125 | peptidyl-cysteine methylation(GO:0018125) |
| 0.5 | 1.6 | GO:0006116 | NADH oxidation(GO:0006116) glycerol-3-phosphate catabolic process(GO:0046168) |
| 0.5 | 2.1 | GO:0032289 | central nervous system myelin formation(GO:0032289) cardiac cell fate specification(GO:0060912) |
| 0.5 | 1.0 | GO:1903244 | positive regulation of cardiac muscle adaptation(GO:0010615) positive regulation of cardiac muscle hypertrophy in response to stress(GO:1903244) |
| 0.5 | 4.7 | GO:0071318 | cellular response to ATP(GO:0071318) |
| 0.5 | 1.0 | GO:0010752 | regulation of cGMP-mediated signaling(GO:0010752) |
| 0.5 | 2.0 | GO:0034727 | lysosomal microautophagy(GO:0016237) piecemeal microautophagy of nucleus(GO:0034727) late nucleophagy(GO:0044805) |
| 0.5 | 2.0 | GO:1903265 | keratinocyte apoptotic process(GO:0097283) regulation of keratinocyte apoptotic process(GO:1902172) positive regulation of tumor necrosis factor-mediated signaling pathway(GO:1903265) |
| 0.5 | 2.5 | GO:0072429 | response to cell cycle checkpoint signaling(GO:0072396) response to DNA integrity checkpoint signaling(GO:0072402) response to DNA damage checkpoint signaling(GO:0072423) response to intra-S DNA damage checkpoint signaling(GO:0072429) |
| 0.5 | 1.5 | GO:0035435 | phosphate ion transmembrane transport(GO:0035435) |
| 0.5 | 2.5 | GO:1901678 | iron coordination entity transport(GO:1901678) |
| 0.5 | 1.0 | GO:0034372 | very-low-density lipoprotein particle remodeling(GO:0034372) |
| 0.5 | 4.3 | GO:0061088 | sequestering of zinc ion(GO:0032119) regulation of sequestering of zinc ion(GO:0061088) |
| 0.5 | 2.9 | GO:0007197 | adenylate cyclase-inhibiting G-protein coupled acetylcholine receptor signaling pathway(GO:0007197) phospholipase C-activating G-protein coupled acetylcholine receptor signaling pathway(GO:0007207) |
| 0.5 | 1.4 | GO:0060785 | regulation of apoptosis involved in tissue homeostasis(GO:0060785) |
| 0.5 | 4.7 | GO:0030388 | fructose 1,6-bisphosphate metabolic process(GO:0030388) |
| 0.5 | 1.4 | GO:0042196 | dichloromethane metabolic process(GO:0018900) chlorinated hydrocarbon metabolic process(GO:0042196) halogenated hydrocarbon metabolic process(GO:0042197) |
| 0.5 | 1.4 | GO:0032417 | olfactory learning(GO:0008355) positive regulation of sodium:proton antiporter activity(GO:0032417) |
| 0.5 | 1.9 | GO:0006842 | tricarboxylic acid transport(GO:0006842) succinate transport(GO:0015744) citrate transport(GO:0015746) |
| 0.5 | 2.7 | GO:0071435 | potassium ion export(GO:0071435) |
| 0.4 | 4.0 | GO:0042760 | very long-chain fatty acid catabolic process(GO:0042760) |
| 0.4 | 3.6 | GO:0071372 | cellular response to follicle-stimulating hormone stimulus(GO:0071372) |
| 0.4 | 3.1 | GO:2000124 | regulation of endocannabinoid signaling pathway(GO:2000124) |
| 0.4 | 3.0 | GO:0015840 | urea transport(GO:0015840) urea transmembrane transport(GO:0071918) |
| 0.4 | 2.1 | GO:1903772 | regulation of viral budding via host ESCRT complex(GO:1903772) |
| 0.4 | 1.7 | GO:0097167 | circadian regulation of translation(GO:0097167) |
| 0.4 | 4.6 | GO:0022410 | circadian sleep/wake cycle process(GO:0022410) regulation of circadian sleep/wake cycle(GO:0042749) |
| 0.4 | 1.7 | GO:0070166 | enamel mineralization(GO:0070166) |
| 0.4 | 4.9 | GO:0051481 | negative regulation of cytosolic calcium ion concentration(GO:0051481) |
| 0.4 | 0.8 | GO:0050883 | musculoskeletal movement, spinal reflex action(GO:0050883) |
| 0.4 | 1.6 | GO:2000048 | negative regulation of cell-cell adhesion mediated by cadherin(GO:2000048) |
| 0.4 | 1.6 | GO:0071072 | negative regulation of phospholipid biosynthetic process(GO:0071072) |
| 0.4 | 7.2 | GO:0048266 | behavioral response to pain(GO:0048266) |
| 0.4 | 2.2 | GO:0010759 | positive regulation of macrophage chemotaxis(GO:0010759) |
| 0.4 | 5.1 | GO:0033198 | response to ATP(GO:0033198) |
| 0.4 | 0.7 | GO:1902109 | negative regulation of mitochondrial membrane permeability involved in apoptotic process(GO:1902109) |
| 0.4 | 1.8 | GO:0070986 | left/right axis specification(GO:0070986) |
| 0.4 | 2.9 | GO:0010748 | negative regulation of plasma membrane long-chain fatty acid transport(GO:0010748) |
| 0.4 | 1.4 | GO:0070318 | positive regulation of G0 to G1 transition(GO:0070318) |
| 0.4 | 1.4 | GO:1990743 | protein sialylation(GO:1990743) |
| 0.4 | 0.7 | GO:2000040 | regulation of planar cell polarity pathway involved in axis elongation(GO:2000040) negative regulation of planar cell polarity pathway involved in axis elongation(GO:2000041) |
| 0.3 | 1.0 | GO:2000465 | regulation of glycogen (starch) synthase activity(GO:2000465) |
| 0.3 | 8.0 | GO:0032011 | ARF protein signal transduction(GO:0032011) regulation of ARF protein signal transduction(GO:0032012) |
| 0.3 | 2.0 | GO:2000672 | negative regulation of motor neuron apoptotic process(GO:2000672) |
| 0.3 | 5.1 | GO:0050901 | leukocyte tethering or rolling(GO:0050901) |
| 0.3 | 1.0 | GO:0097309 | cap1 mRNA methylation(GO:0097309) |
| 0.3 | 7.1 | GO:2000311 | regulation of alpha-amino-3-hydroxy-5-methyl-4-isoxazole propionate selective glutamate receptor activity(GO:2000311) |
| 0.3 | 1.0 | GO:0007525 | somatic muscle development(GO:0007525) |
| 0.3 | 0.3 | GO:0050859 | negative regulation of B cell receptor signaling pathway(GO:0050859) |
| 0.3 | 3.8 | GO:0000185 | activation of MAPKKK activity(GO:0000185) |
| 0.3 | 6.4 | GO:0050650 | chondroitin sulfate proteoglycan biosynthetic process(GO:0050650) |
| 0.3 | 0.6 | GO:0018199 | peptidyl-glutamine modification(GO:0018199) |
| 0.3 | 3.9 | GO:0042297 | vocal learning(GO:0042297) imitative learning(GO:0098596) learned vocalization behavior or vocal learning(GO:0098598) |
| 0.3 | 1.2 | GO:0006049 | UDP-N-acetylglucosamine catabolic process(GO:0006049) |
| 0.3 | 4.4 | GO:0045956 | positive regulation of calcium ion-dependent exocytosis(GO:0045956) |
| 0.3 | 0.3 | GO:0050912 | detection of chemical stimulus involved in sensory perception(GO:0050907) detection of chemical stimulus involved in sensory perception of taste(GO:0050912) |
| 0.3 | 1.4 | GO:0000098 | sulfur amino acid catabolic process(GO:0000098) taurine metabolic process(GO:0019530) response to glucagon(GO:0033762) |
| 0.3 | 0.3 | GO:1901187 | regulation of ephrin receptor signaling pathway(GO:1901187) |
| 0.3 | 2.2 | GO:0048149 | behavioral response to ethanol(GO:0048149) |
| 0.3 | 11.1 | GO:0035640 | exploration behavior(GO:0035640) |
| 0.3 | 0.8 | GO:0051295 | establishment of meiotic spindle localization(GO:0051295) formin-nucleated actin cable assembly(GO:0070649) |
| 0.3 | 1.3 | GO:0042535 | positive regulation of tumor necrosis factor biosynthetic process(GO:0042535) |
| 0.3 | 0.8 | GO:0071921 | establishment of sister chromatid cohesion(GO:0034085) cohesin loading(GO:0071921) regulation of cohesin loading(GO:0071922) |
| 0.3 | 2.1 | GO:0046543 | development of secondary female sexual characteristics(GO:0046543) |
| 0.3 | 0.5 | GO:0033159 | negative regulation of protein import into nucleus, translocation(GO:0033159) |
| 0.3 | 1.0 | GO:0061343 | cell adhesion involved in heart morphogenesis(GO:0061343) |
| 0.3 | 2.5 | GO:0090315 | negative regulation of protein targeting to membrane(GO:0090315) |
| 0.3 | 4.3 | GO:0050995 | negative regulation of lipid catabolic process(GO:0050995) |
| 0.3 | 3.0 | GO:1902993 | positive regulation of beta-amyloid formation(GO:1902004) positive regulation of amyloid precursor protein catabolic process(GO:1902993) |
| 0.2 | 1.0 | GO:1903898 | positive regulation of translation in response to endoplasmic reticulum stress(GO:0036493) negative regulation of PERK-mediated unfolded protein response(GO:1903898) |
| 0.2 | 2.5 | GO:0030828 | positive regulation of cGMP biosynthetic process(GO:0030828) |
| 0.2 | 1.5 | GO:0042268 | regulation of cytolysis(GO:0042268) positive regulation of TORC1 signaling(GO:1904263) |
| 0.2 | 2.7 | GO:0014051 | gamma-aminobutyric acid secretion(GO:0014051) |
| 0.2 | 1.9 | GO:0006003 | fructose 2,6-bisphosphate metabolic process(GO:0006003) |
| 0.2 | 3.4 | GO:0032438 | melanosome organization(GO:0032438) |
| 0.2 | 1.2 | GO:0006689 | ganglioside catabolic process(GO:0006689) oligosaccharide catabolic process(GO:0009313) |
| 0.2 | 1.4 | GO:0031998 | regulation of fatty acid beta-oxidation(GO:0031998) |
| 0.2 | 0.9 | GO:0033563 | dorsal/ventral axon guidance(GO:0033563) |
| 0.2 | 0.7 | GO:0072070 | loop of Henle development(GO:0072070) metanephric loop of Henle development(GO:0072236) |
| 0.2 | 1.1 | GO:0032911 | nerve growth factor production(GO:0032902) negative regulation of transforming growth factor beta1 production(GO:0032911) |
| 0.2 | 1.3 | GO:0007258 | JUN phosphorylation(GO:0007258) |
| 0.2 | 0.9 | GO:0071415 | positive regulation of ryanodine-sensitive calcium-release channel activity(GO:0060316) cellular response to caffeine(GO:0071313) cellular response to purine-containing compound(GO:0071415) |
| 0.2 | 6.4 | GO:1901385 | regulation of voltage-gated calcium channel activity(GO:1901385) |
| 0.2 | 0.7 | GO:1900042 | positive regulation of interleukin-2 secretion(GO:1900042) |
| 0.2 | 0.6 | GO:0046077 | dUDP biosynthetic process(GO:0006227) pyrimidine nucleoside diphosphate biosynthetic process(GO:0009139) pyrimidine deoxyribonucleoside diphosphate metabolic process(GO:0009196) pyrimidine deoxyribonucleoside diphosphate biosynthetic process(GO:0009197) dUDP metabolic process(GO:0046077) |
| 0.2 | 0.6 | GO:0061043 | regulation of vascular wound healing(GO:0061043) |
| 0.2 | 0.8 | GO:0006668 | sphinganine-1-phosphate metabolic process(GO:0006668) |
| 0.2 | 2.7 | GO:0070842 | aggresome assembly(GO:0070842) |
| 0.2 | 3.5 | GO:2000300 | regulation of synaptic vesicle exocytosis(GO:2000300) |
| 0.2 | 2.7 | GO:0007271 | synaptic transmission, cholinergic(GO:0007271) |
| 0.2 | 0.6 | GO:0016598 | protein arginylation(GO:0016598) |
| 0.2 | 1.2 | GO:0034058 | endosomal vesicle fusion(GO:0034058) |
| 0.2 | 1.8 | GO:2000786 | positive regulation of autophagosome assembly(GO:2000786) |
| 0.2 | 0.6 | GO:0006434 | seryl-tRNA aminoacylation(GO:0006434) |
| 0.2 | 2.2 | GO:0007413 | axonal fasciculation(GO:0007413) |
| 0.2 | 1.0 | GO:1901164 | negative regulation of trophoblast cell migration(GO:1901164) |
| 0.2 | 0.2 | GO:0035622 | intrahepatic bile duct development(GO:0035622) |
| 0.2 | 0.8 | GO:0010735 | positive regulation of transcription via serum response element binding(GO:0010735) |
| 0.2 | 1.5 | GO:0006013 | mannose metabolic process(GO:0006013) |
| 0.2 | 0.6 | GO:0050787 | glycolate metabolic process(GO:0009441) enzyme active site formation via L-cysteine sulfinic acid(GO:0018323) primary alcohol biosynthetic process(GO:0034309) cellular response to glyoxal(GO:0036471) glycolate biosynthetic process(GO:0046295) detoxification of mercury ion(GO:0050787) positive regulation of superoxide dismutase activity(GO:1901671) negative regulation of TRAIL-activated apoptotic signaling pathway(GO:1903122) regulation of pyrroline-5-carboxylate reductase activity(GO:1903167) positive regulation of pyrroline-5-carboxylate reductase activity(GO:1903168) regulation of tyrosine 3-monooxygenase activity(GO:1903176) positive regulation of tyrosine 3-monooxygenase activity(GO:1903178) L-dopa metabolic process(GO:1903184) L-dopa biosynthetic process(GO:1903185) glyoxal metabolic process(GO:1903189) glyoxal catabolic process(GO:1903190) regulation of L-dopa biosynthetic process(GO:1903195) positive regulation of L-dopa biosynthetic process(GO:1903197) regulation of L-dopa decarboxylase activity(GO:1903198) positive regulation of L-dopa decarboxylase activity(GO:1903200) positive regulation of removal of superoxide radicals(GO:1904833) positive regulation of oxidative phosphorylation uncoupler activity(GO:2000277) regulation of cellular amino acid biosynthetic process(GO:2000282) positive regulation of cellular amino acid biosynthetic process(GO:2000284) positive regulation of androgen receptor activity(GO:2000825) |
| 0.2 | 0.6 | GO:0044650 | virion attachment to host cell(GO:0019062) adhesion of symbiont to host cell(GO:0044650) |
| 0.2 | 1.3 | GO:0035116 | embryonic hindlimb morphogenesis(GO:0035116) |
| 0.2 | 2.0 | GO:0051601 | exocyst localization(GO:0051601) |
| 0.2 | 0.6 | GO:2000323 | negative regulation of glucocorticoid receptor signaling pathway(GO:2000323) |
| 0.2 | 0.2 | GO:1901252 | regulation of intracellular transport of viral material(GO:1901252) |
| 0.2 | 0.4 | GO:0060426 | lung vasculature development(GO:0060426) |
| 0.2 | 1.1 | GO:0006646 | phosphatidylethanolamine biosynthetic process(GO:0006646) |
| 0.2 | 2.0 | GO:1900273 | positive regulation of long-term synaptic potentiation(GO:1900273) |
| 0.2 | 3.6 | GO:0007214 | gamma-aminobutyric acid signaling pathway(GO:0007214) |
| 0.2 | 2.0 | GO:0035999 | tetrahydrofolate interconversion(GO:0035999) |
| 0.2 | 3.2 | GO:0019884 | antigen processing and presentation of exogenous antigen(GO:0019884) |
| 0.2 | 0.5 | GO:1903121 | regulation of TRAIL-activated apoptotic signaling pathway(GO:1903121) |
| 0.2 | 0.5 | GO:0070970 | interleukin-2 secretion(GO:0070970) |
| 0.2 | 2.1 | GO:0045725 | positive regulation of glycogen biosynthetic process(GO:0045725) |
| 0.2 | 1.2 | GO:0019254 | carnitine metabolic process, CoA-linked(GO:0019254) |
| 0.2 | 5.7 | GO:0003333 | amino acid transmembrane transport(GO:0003333) |
| 0.2 | 1.0 | GO:0071638 | negative regulation of monocyte chemotactic protein-1 production(GO:0071638) |
| 0.2 | 0.8 | GO:1901029 | negative regulation of mitochondrial outer membrane permeabilization involved in apoptotic signaling pathway(GO:1901029) |
| 0.2 | 0.7 | GO:0032275 | luteinizing hormone secretion(GO:0032275) positive regulation of gonadotropin secretion(GO:0032278) |
| 0.2 | 1.1 | GO:0090336 | positive regulation of brown fat cell differentiation(GO:0090336) |
| 0.2 | 0.5 | GO:1903715 | regulation of aerobic respiration(GO:1903715) |
| 0.2 | 2.0 | GO:0060292 | long term synaptic depression(GO:0060292) |
| 0.2 | 0.7 | GO:0039536 | negative regulation of RIG-I signaling pathway(GO:0039536) |
| 0.2 | 3.1 | GO:0002495 | antigen processing and presentation of peptide antigen via MHC class II(GO:0002495) antigen processing and presentation of peptide or polysaccharide antigen via MHC class II(GO:0002504) |
| 0.2 | 1.9 | GO:0034497 | protein localization to pre-autophagosomal structure(GO:0034497) |
| 0.2 | 1.9 | GO:0032957 | inositol trisphosphate metabolic process(GO:0032957) |
| 0.2 | 2.5 | GO:0071392 | cellular response to estradiol stimulus(GO:0071392) |
| 0.2 | 2.0 | GO:0048280 | vesicle fusion with Golgi apparatus(GO:0048280) |
| 0.2 | 5.1 | GO:0008333 | endosome to lysosome transport(GO:0008333) |
| 0.2 | 0.9 | GO:0032074 | negative regulation of nuclease activity(GO:0032074) |
| 0.2 | 5.0 | GO:1901381 | positive regulation of potassium ion transmembrane transport(GO:1901381) |
| 0.2 | 1.7 | GO:0019835 | cytolysis(GO:0019835) |
| 0.2 | 0.6 | GO:0071361 | cellular response to ethanol(GO:0071361) |
| 0.2 | 1.5 | GO:1901621 | negative regulation of smoothened signaling pathway involved in dorsal/ventral neural tube patterning(GO:1901621) |
| 0.2 | 5.6 | GO:0007200 | phospholipase C-activating G-protein coupled receptor signaling pathway(GO:0007200) |
| 0.2 | 1.8 | GO:0090503 | RNA phosphodiester bond hydrolysis, exonucleolytic(GO:0090503) |
| 0.2 | 0.9 | GO:0050716 | positive regulation of interleukin-1 secretion(GO:0050716) positive regulation of interleukin-1 beta secretion(GO:0050718) |
| 0.1 | 0.9 | GO:0050966 | detection of mechanical stimulus involved in sensory perception of pain(GO:0050966) |
| 0.1 | 0.6 | GO:0016480 | negative regulation of transcription from RNA polymerase III promoter(GO:0016480) |
| 0.1 | 1.1 | GO:0018401 | peptidyl-proline hydroxylation to 4-hydroxy-L-proline(GO:0018401) |
| 0.1 | 0.9 | GO:0048102 | autophagic cell death(GO:0048102) |
| 0.1 | 1.8 | GO:0072643 | interferon-gamma secretion(GO:0072643) |
| 0.1 | 0.5 | GO:0060179 | male mating behavior(GO:0060179) |
| 0.1 | 1.1 | GO:0030174 | regulation of DNA-dependent DNA replication initiation(GO:0030174) |
| 0.1 | 1.3 | GO:0032733 | positive regulation of interleukin-10 production(GO:0032733) |
| 0.1 | 0.8 | GO:0015015 | heparan sulfate proteoglycan biosynthetic process, enzymatic modification(GO:0015015) |
| 0.1 | 7.7 | GO:0072583 | clathrin-mediated endocytosis(GO:0072583) |
| 0.1 | 2.5 | GO:0090218 | positive regulation of lipid kinase activity(GO:0090218) |
| 0.1 | 0.4 | GO:0019043 | establishment of viral latency(GO:0019043) |
| 0.1 | 1.5 | GO:0002227 | innate immune response in mucosa(GO:0002227) |
| 0.1 | 7.6 | GO:1904893 | negative regulation of JAK-STAT cascade(GO:0046426) negative regulation of STAT cascade(GO:1904893) |
| 0.1 | 2.4 | GO:0042220 | response to cocaine(GO:0042220) |
| 0.1 | 1.3 | GO:0048172 | regulation of short-term neuronal synaptic plasticity(GO:0048172) |
| 0.1 | 3.9 | GO:0006911 | phagocytosis, engulfment(GO:0006911) |
| 0.1 | 0.5 | GO:0042276 | error-prone translesion synthesis(GO:0042276) |
| 0.1 | 1.0 | GO:0016082 | synaptic vesicle priming(GO:0016082) |
| 0.1 | 6.1 | GO:0001938 | positive regulation of endothelial cell proliferation(GO:0001938) |
| 0.1 | 1.8 | GO:0046928 | regulation of neurotransmitter secretion(GO:0046928) |
| 0.1 | 2.3 | GO:0034113 | heterotypic cell-cell adhesion(GO:0034113) |
| 0.1 | 0.8 | GO:0060294 | cilium movement involved in cell motility(GO:0060294) |
| 0.1 | 2.4 | GO:0035335 | peptidyl-tyrosine dephosphorylation(GO:0035335) |
| 0.1 | 0.3 | GO:0033615 | mitochondrial proton-transporting ATP synthase complex assembly(GO:0033615) |
| 0.1 | 0.3 | GO:0045347 | negative regulation of MHC class II biosynthetic process(GO:0045347) |
| 0.1 | 2.5 | GO:0071108 | protein K48-linked deubiquitination(GO:0071108) |
| 0.1 | 1.6 | GO:0009312 | oligosaccharide biosynthetic process(GO:0009312) |
| 0.1 | 1.8 | GO:0050805 | negative regulation of synaptic transmission(GO:0050805) |
| 0.1 | 0.8 | GO:0060972 | left/right pattern formation(GO:0060972) |
| 0.1 | 1.9 | GO:0010614 | negative regulation of cardiac muscle hypertrophy(GO:0010614) |
| 0.1 | 3.4 | GO:2000279 | negative regulation of DNA biosynthetic process(GO:2000279) |
| 0.1 | 0.5 | GO:0030948 | negative regulation of vascular endothelial growth factor receptor signaling pathway(GO:0030948) |
| 0.1 | 0.7 | GO:0043983 | histone H4-K12 acetylation(GO:0043983) |
| 0.1 | 0.4 | GO:2000035 | regulation of stem cell division(GO:2000035) |
| 0.1 | 3.9 | GO:0006890 | retrograde vesicle-mediated transport, Golgi to ER(GO:0006890) |
| 0.1 | 0.9 | GO:0018230 | peptidyl-L-cysteine S-palmitoylation(GO:0018230) peptidyl-S-diacylglycerol-L-cysteine biosynthetic process from peptidyl-cysteine(GO:0018231) |
| 0.1 | 1.1 | GO:0019243 | methylglyoxal catabolic process to D-lactate via S-lactoyl-glutathione(GO:0019243) methylglyoxal catabolic process(GO:0051596) methylglyoxal catabolic process to lactate(GO:0061727) |
| 0.1 | 2.0 | GO:2000785 | regulation of autophagosome assembly(GO:2000785) |
| 0.1 | 0.9 | GO:0018095 | protein polyglutamylation(GO:0018095) |
| 0.1 | 1.2 | GO:0048013 | ephrin receptor signaling pathway(GO:0048013) |
| 0.1 | 0.5 | GO:0002347 | response to tumor cell(GO:0002347) |
| 0.1 | 0.8 | GO:0071257 | cellular response to electrical stimulus(GO:0071257) |
| 0.1 | 1.7 | GO:0033622 | integrin activation(GO:0033622) |
| 0.1 | 0.6 | GO:0097460 | ferrous iron import into cell(GO:0097460) |
| 0.1 | 0.2 | GO:0070278 | extracellular matrix constituent secretion(GO:0070278) |
| 0.1 | 3.4 | GO:0072661 | protein targeting to plasma membrane(GO:0072661) |
| 0.1 | 0.5 | GO:1902775 | mitochondrial large ribosomal subunit assembly(GO:1902775) |
| 0.1 | 1.3 | GO:0015693 | magnesium ion transport(GO:0015693) |
| 0.1 | 0.4 | GO:0002457 | T cell antigen processing and presentation(GO:0002457) |
| 0.1 | 0.4 | GO:0032486 | Rap protein signal transduction(GO:0032486) |
| 0.1 | 0.4 | GO:0006564 | L-serine biosynthetic process(GO:0006564) |
| 0.1 | 0.5 | GO:0033564 | anterior/posterior axon guidance(GO:0033564) |
| 0.1 | 5.5 | GO:0048814 | regulation of dendrite morphogenesis(GO:0048814) |
| 0.1 | 0.6 | GO:0008090 | retrograde axonal transport(GO:0008090) |
| 0.1 | 3.6 | GO:0030593 | neutrophil chemotaxis(GO:0030593) |
| 0.1 | 0.3 | GO:0032532 | regulation of microvillus length(GO:0032532) |
| 0.1 | 0.9 | GO:0043206 | extracellular fibril organization(GO:0043206) |
| 0.1 | 0.3 | GO:0002302 | CD8-positive, alpha-beta T cell differentiation involved in immune response(GO:0002302) mesodermal to mesenchymal transition involved in gastrulation(GO:0060809) |
| 0.1 | 1.4 | GO:0046069 | cGMP catabolic process(GO:0046069) |
| 0.1 | 1.1 | GO:0014829 | vascular smooth muscle contraction(GO:0014829) |
| 0.1 | 1.3 | GO:0015813 | L-glutamate transport(GO:0015813) |
| 0.1 | 2.1 | GO:0050919 | negative chemotaxis(GO:0050919) |
| 0.1 | 0.4 | GO:0048246 | macrophage chemotaxis(GO:0048246) |
| 0.1 | 3.2 | GO:0060999 | positive regulation of dendritic spine development(GO:0060999) |
| 0.1 | 1.1 | GO:0060317 | cardiac epithelial to mesenchymal transition(GO:0060317) |
| 0.1 | 1.8 | GO:0032007 | negative regulation of TOR signaling(GO:0032007) |
| 0.1 | 0.2 | GO:0090529 | barrier septum assembly(GO:0000917) cell septum assembly(GO:0090529) |
| 0.1 | 1.0 | GO:0060074 | synapse maturation(GO:0060074) |
| 0.1 | 2.3 | GO:0035690 | cellular response to drug(GO:0035690) |
| 0.1 | 0.4 | GO:0015817 | histidine transport(GO:0015817) |
| 0.1 | 0.7 | GO:2001223 | negative regulation of neuron migration(GO:2001223) |
| 0.1 | 1.9 | GO:0007157 | heterophilic cell-cell adhesion via plasma membrane cell adhesion molecules(GO:0007157) |
| 0.1 | 2.1 | GO:0007528 | neuromuscular junction development(GO:0007528) |
| 0.1 | 0.4 | GO:0016255 | attachment of GPI anchor to protein(GO:0016255) |
| 0.1 | 1.4 | GO:0007173 | epidermal growth factor receptor signaling pathway(GO:0007173) |
| 0.1 | 1.6 | GO:0031638 | zymogen activation(GO:0031638) |
| 0.1 | 0.8 | GO:0006120 | mitochondrial electron transport, NADH to ubiquinone(GO:0006120) |
| 0.1 | 0.6 | GO:0006891 | intra-Golgi vesicle-mediated transport(GO:0006891) |
| 0.1 | 0.6 | GO:0014898 | muscle hypertrophy in response to stress(GO:0003299) cardiac muscle hypertrophy in response to stress(GO:0014898) |
| 0.1 | 1.1 | GO:0090161 | Golgi ribbon formation(GO:0090161) |
| 0.1 | 0.2 | GO:0007274 | neuromuscular synaptic transmission(GO:0007274) |
| 0.1 | 1.1 | GO:0032402 | establishment of melanosome localization(GO:0032401) melanosome transport(GO:0032402) |
| 0.1 | 0.4 | GO:0042126 | nitrate metabolic process(GO:0042126) |
| 0.1 | 1.9 | GO:0015991 | energy coupled proton transmembrane transport, against electrochemical gradient(GO:0015988) ATP hydrolysis coupled proton transport(GO:0015991) ATP hydrolysis coupled transmembrane transport(GO:0090662) |
| 0.1 | 0.6 | GO:0006471 | protein ADP-ribosylation(GO:0006471) |
| 0.1 | 0.3 | GO:0006177 | GMP biosynthetic process(GO:0006177) |
| 0.1 | 0.6 | GO:0010667 | negative regulation of cardiac muscle cell apoptotic process(GO:0010667) |
| 0.1 | 0.2 | GO:0070476 | rRNA (guanine-N7)-methylation(GO:0070476) |
| 0.1 | 1.4 | GO:0010955 | negative regulation of protein processing(GO:0010955) negative regulation of protein maturation(GO:1903318) |
| 0.1 | 0.4 | GO:0071260 | cellular response to mechanical stimulus(GO:0071260) |
| 0.1 | 0.3 | GO:1900194 | negative regulation of oocyte development(GO:0060283) negative regulation of oocyte maturation(GO:1900194) |
| 0.1 | 0.9 | GO:0051205 | protein insertion into membrane(GO:0051205) |
| 0.1 | 0.5 | GO:0046415 | urate metabolic process(GO:0046415) |
| 0.0 | 0.4 | GO:0070995 | NADPH oxidation(GO:0070995) |
| 0.0 | 0.9 | GO:0006054 | N-acetylneuraminate metabolic process(GO:0006054) |
| 0.0 | 1.2 | GO:0016578 | histone deubiquitination(GO:0016578) |
| 0.0 | 0.1 | GO:0001830 | trophectodermal cell fate commitment(GO:0001830) |
| 0.0 | 0.7 | GO:0048147 | negative regulation of fibroblast proliferation(GO:0048147) |
| 0.0 | 0.1 | GO:0010886 | positive regulation of cholesterol storage(GO:0010886) |
| 0.0 | 0.6 | GO:0050982 | detection of mechanical stimulus(GO:0050982) |
| 0.0 | 0.6 | GO:0032968 | positive regulation of transcription elongation from RNA polymerase II promoter(GO:0032968) |
| 0.0 | 0.9 | GO:0002089 | lens morphogenesis in camera-type eye(GO:0002089) |
| 0.0 | 0.3 | GO:2000601 | positive regulation of Arp2/3 complex-mediated actin nucleation(GO:2000601) |
| 0.0 | 1.1 | GO:0030199 | collagen fibril organization(GO:0030199) |
| 0.0 | 0.4 | GO:0044406 | adhesion of symbiont to host(GO:0044406) |
| 0.0 | 0.5 | GO:0070129 | regulation of mitochondrial translation(GO:0070129) |
| 0.0 | 0.6 | GO:0032469 | endoplasmic reticulum calcium ion homeostasis(GO:0032469) |
| 0.0 | 0.7 | GO:0006491 | N-glycan processing(GO:0006491) |
| 0.0 | 0.2 | GO:0031424 | keratinization(GO:0031424) |
| 0.0 | 0.4 | GO:0043087 | regulation of GTPase activity(GO:0043087) |
| 0.0 | 0.3 | GO:2001197 | regulation of basement membrane assembly involved in embryonic body morphogenesis(GO:1904259) positive regulation of basement membrane assembly involved in embryonic body morphogenesis(GO:1904261) basement membrane assembly involved in embryonic body morphogenesis(GO:2001197) |
| 0.0 | 0.9 | GO:0006024 | glycosaminoglycan biosynthetic process(GO:0006024) |
| 0.0 | 0.1 | GO:0006549 | isoleucine metabolic process(GO:0006549) |
| 0.0 | 1.1 | GO:0032760 | positive regulation of tumor necrosis factor production(GO:0032760) |
| 0.0 | 0.4 | GO:0043968 | histone H2A acetylation(GO:0043968) |
| 0.0 | 0.9 | GO:0031032 | actomyosin structure organization(GO:0031032) |
| 0.0 | 0.8 | GO:0030317 | sperm motility(GO:0030317) |
| 0.0 | 1.1 | GO:0051865 | protein autoubiquitination(GO:0051865) |
| 0.0 | 0.1 | GO:1902035 | positive regulation of hematopoietic stem cell proliferation(GO:1902035) |
| 0.0 | 0.1 | GO:0003094 | glomerular filtration(GO:0003094) renal filtration(GO:0097205) |
| 0.0 | 0.3 | GO:0019368 | fatty acid elongation, saturated fatty acid(GO:0019367) fatty acid elongation, unsaturated fatty acid(GO:0019368) fatty acid elongation, monounsaturated fatty acid(GO:0034625) fatty acid elongation, polyunsaturated fatty acid(GO:0034626) |
| 0.0 | 0.3 | GO:0043550 | regulation of lipid kinase activity(GO:0043550) |
| 0.0 | 0.5 | GO:0030970 | retrograde protein transport, ER to cytosol(GO:0030970) |
| 0.0 | 1.0 | GO:0001541 | ovarian follicle development(GO:0001541) |
| 0.0 | 0.9 | GO:0019882 | antigen processing and presentation(GO:0019882) |
| 0.0 | 0.5 | GO:0033209 | tumor necrosis factor-mediated signaling pathway(GO:0033209) |
| 0.0 | 0.5 | GO:0007020 | microtubule nucleation(GO:0007020) |
| 0.0 | 3.4 | GO:0042787 | protein ubiquitination involved in ubiquitin-dependent protein catabolic process(GO:0042787) |
| 0.0 | 0.1 | GO:0060174 | canonical Wnt signaling pathway involved in osteoblast differentiation(GO:0044339) limb bud formation(GO:0060174) |
| 0.0 | 0.1 | GO:0010801 | negative regulation of peptidyl-threonine phosphorylation(GO:0010801) |
| 0.0 | 0.1 | GO:0000715 | nucleotide-excision repair, DNA damage recognition(GO:0000715) |
| 0.0 | 0.1 | GO:0006436 | tryptophanyl-tRNA aminoacylation(GO:0006436) |
| 0.0 | 0.2 | GO:0017144 | drug metabolic process(GO:0017144) |
| 0.0 | 0.2 | GO:0071786 | endoplasmic reticulum tubular network organization(GO:0071786) |
| 0.0 | 1.0 | GO:0032526 | response to retinoic acid(GO:0032526) |
| 0.0 | 0.1 | GO:0051897 | positive regulation of protein kinase B signaling(GO:0051897) |
| 0.0 | 1.0 | GO:0030177 | positive regulation of Wnt signaling pathway(GO:0030177) |
| 0.0 | 0.7 | GO:0003382 | epithelial cell morphogenesis(GO:0003382) |
| 0.0 | 0.1 | GO:0035767 | endothelial cell chemotaxis(GO:0035767) |
| 0.0 | 0.1 | GO:0051533 | positive regulation of NFAT protein import into nucleus(GO:0051533) |
| 0.0 | 0.1 | GO:0050812 | regulation of acetyl-CoA biosynthetic process from pyruvate(GO:0010510) regulation of acyl-CoA biosynthetic process(GO:0050812) |
| 0.0 | 1.1 | GO:0000725 | double-strand break repair via homologous recombination(GO:0000724) recombinational repair(GO:0000725) |
| 0.0 | 0.1 | GO:0000083 | regulation of transcription involved in G1/S transition of mitotic cell cycle(GO:0000083) |
| 0.0 | 0.5 | GO:0045839 | negative regulation of mitotic nuclear division(GO:0045839) |
| 0.0 | 0.2 | GO:0001921 | positive regulation of receptor recycling(GO:0001921) |
Gene overrepresentation in cellular_component category:
| Log-likelihood per target | Total log-likelihood | Term | Description |
|---|---|---|---|
| 5.4 | 54.4 | GO:0045298 | tubulin complex(GO:0045298) |
| 3.2 | 9.5 | GO:0016533 | cyclin-dependent protein kinase 5 holoenzyme complex(GO:0016533) |
| 2.7 | 8.0 | GO:0005595 | collagen type XII trimer(GO:0005595) anchoring collagen complex(GO:0030934) |
| 2.3 | 7.0 | GO:0005927 | muscle tendon junction(GO:0005927) |
| 1.7 | 5.1 | GO:0008282 | ATP-sensitive potassium channel complex(GO:0008282) |
| 1.6 | 6.5 | GO:0031838 | haptoglobin-hemoglobin complex(GO:0031838) |
| 1.5 | 24.4 | GO:0005614 | interstitial matrix(GO:0005614) |
| 1.5 | 5.8 | GO:0043259 | laminin-1 complex(GO:0005606) laminin-10 complex(GO:0043259) |
| 1.4 | 5.8 | GO:0032280 | symmetric synapse(GO:0032280) |
| 1.4 | 4.1 | GO:1990682 | CSF1-CSF1R complex(GO:1990682) |
| 1.3 | 5.3 | GO:0097450 | astrocyte end-foot(GO:0097450) |
| 1.2 | 3.6 | GO:0043625 | delta DNA polymerase complex(GO:0043625) |
| 1.2 | 12.8 | GO:0042582 | primary lysosome(GO:0005766) azurophil granule(GO:0042582) |
| 1.1 | 6.8 | GO:0005853 | eukaryotic translation elongation factor 1 complex(GO:0005853) |
| 1.0 | 10.6 | GO:0031931 | TORC1 complex(GO:0031931) |
| 0.9 | 1.8 | GO:0044194 | cytolytic granule(GO:0044194) |
| 0.9 | 17.0 | GO:0032279 | asymmetric synapse(GO:0032279) |
| 0.8 | 4.2 | GO:0042583 | chromaffin granule(GO:0042583) |
| 0.8 | 4.2 | GO:0044316 | cone cell pedicle(GO:0044316) |
| 0.8 | 3.2 | GO:0008537 | proteasome activator complex(GO:0008537) |
| 0.8 | 2.3 | GO:0031983 | vesicle lumen(GO:0031983) |
| 0.8 | 8.4 | GO:0030130 | clathrin coat of trans-Golgi network vesicle(GO:0030130) |
| 0.7 | 7.4 | GO:0002116 | semaphorin receptor complex(GO:0002116) |
| 0.6 | 1.9 | GO:0097512 | cardiac myofibril(GO:0097512) |
| 0.6 | 5.1 | GO:0031315 | extrinsic component of mitochondrial outer membrane(GO:0031315) |
| 0.6 | 12.5 | GO:0044224 | juxtaparanode region of axon(GO:0044224) |
| 0.6 | 3.0 | GO:0012510 | trans-Golgi network transport vesicle membrane(GO:0012510) |
| 0.6 | 4.2 | GO:0005638 | lamin filament(GO:0005638) |
| 0.5 | 14.1 | GO:0030673 | axolemma(GO:0030673) |
| 0.5 | 2.7 | GO:1990635 | proximal dendrite(GO:1990635) |
| 0.5 | 2.1 | GO:0016035 | zeta DNA polymerase complex(GO:0016035) |
| 0.5 | 2.5 | GO:0034750 | Scrib-APC-beta-catenin complex(GO:0034750) |
| 0.5 | 2.4 | GO:0048476 | Holliday junction resolvase complex(GO:0048476) |
| 0.5 | 1.5 | GO:0044299 | C-fiber(GO:0044299) |
| 0.5 | 4.2 | GO:0000813 | ESCRT I complex(GO:0000813) |
| 0.4 | 3.6 | GO:0001520 | outer dense fiber(GO:0001520) |
| 0.4 | 1.8 | GO:0008091 | spectrin(GO:0008091) |
| 0.4 | 1.3 | GO:0044302 | dentate gyrus mossy fiber(GO:0044302) |
| 0.4 | 4.0 | GO:0032045 | guanyl-nucleotide exchange factor complex(GO:0032045) |
| 0.4 | 5.3 | GO:0017146 | NMDA selective glutamate receptor complex(GO:0017146) |
| 0.4 | 18.8 | GO:0005891 | voltage-gated calcium channel complex(GO:0005891) |
| 0.4 | 1.7 | GO:0031230 | intrinsic component of cell outer membrane(GO:0031230) integral component of cell outer membrane(GO:0045203) |
| 0.4 | 46.2 | GO:0000118 | histone deacetylase complex(GO:0000118) |
| 0.4 | 2.5 | GO:0043083 | synaptic cleft(GO:0043083) |
| 0.4 | 11.7 | GO:0032589 | neuron projection membrane(GO:0032589) |
| 0.4 | 10.4 | GO:0032281 | AMPA glutamate receptor complex(GO:0032281) |
| 0.4 | 23.5 | GO:0042734 | presynaptic membrane(GO:0042734) |
| 0.4 | 1.1 | GO:0034457 | Mpp10 complex(GO:0034457) |
| 0.4 | 1.5 | GO:1990130 | Iml1 complex(GO:1990130) |
| 0.4 | 1.1 | GO:0033596 | TSC1-TSC2 complex(GO:0033596) |
| 0.3 | 4.9 | GO:0043196 | varicosity(GO:0043196) |
| 0.3 | 6.1 | GO:0000159 | protein phosphatase type 2A complex(GO:0000159) |
| 0.3 | 2.9 | GO:0032982 | myosin filament(GO:0032982) |
| 0.3 | 0.3 | GO:0042105 | alpha-beta T cell receptor complex(GO:0042105) |
| 0.3 | 1.6 | GO:0009331 | glycerol-3-phosphate dehydrogenase complex(GO:0009331) |
| 0.3 | 3.7 | GO:0071598 | neuronal ribonucleoprotein granule(GO:0071598) |
| 0.3 | 1.5 | GO:0097361 | CIA complex(GO:0097361) |
| 0.3 | 1.2 | GO:0016602 | CCAAT-binding factor complex(GO:0016602) |
| 0.3 | 1.5 | GO:0030485 | smooth muscle contractile fiber(GO:0030485) |
| 0.3 | 2.3 | GO:0033391 | chromatoid body(GO:0033391) |
| 0.3 | 0.8 | GO:0044614 | nuclear pore cytoplasmic filaments(GO:0044614) |
| 0.3 | 3.1 | GO:0000276 | mitochondrial proton-transporting ATP synthase complex, coupling factor F(o)(GO:0000276) |
| 0.2 | 2.2 | GO:0032584 | growth cone membrane(GO:0032584) |
| 0.2 | 3.5 | GO:0000145 | exocyst(GO:0000145) |
| 0.2 | 5.6 | GO:0001891 | phagocytic cup(GO:0001891) |
| 0.2 | 3.1 | GO:0033268 | node of Ranvier(GO:0033268) |
| 0.2 | 2.4 | GO:0031464 | Cul4A-RING E3 ubiquitin ligase complex(GO:0031464) |
| 0.2 | 0.9 | GO:0031233 | intrinsic component of external side of plasma membrane(GO:0031233) |
| 0.2 | 6.6 | GO:0097038 | perinuclear endoplasmic reticulum(GO:0097038) |
| 0.2 | 3.0 | GO:0005952 | cAMP-dependent protein kinase complex(GO:0005952) |
| 0.2 | 0.9 | GO:1990111 | spermatoproteasome complex(GO:1990111) |
| 0.2 | 4.7 | GO:0005797 | Golgi medial cisterna(GO:0005797) |
| 0.2 | 6.8 | GO:0032588 | trans-Golgi network membrane(GO:0032588) |
| 0.2 | 6.6 | GO:0046658 | anchored component of plasma membrane(GO:0046658) |
| 0.2 | 3.4 | GO:0031083 | BLOC-1 complex(GO:0031083) |
| 0.2 | 1.2 | GO:0061689 | tricellular tight junction(GO:0061689) |
| 0.2 | 4.9 | GO:0005771 | multivesicular body(GO:0005771) |
| 0.2 | 1.4 | GO:0042599 | lamellar body(GO:0042599) |
| 0.2 | 0.8 | GO:0019815 | B cell receptor complex(GO:0019815) |
| 0.2 | 2.7 | GO:0042588 | zymogen granule(GO:0042588) |
| 0.2 | 2.0 | GO:0012507 | ER to Golgi transport vesicle membrane(GO:0012507) |
| 0.2 | 2.9 | GO:0032593 | insulin-responsive compartment(GO:0032593) |
| 0.2 | 3.9 | GO:0048786 | presynaptic active zone(GO:0048786) |
| 0.2 | 1.2 | GO:0033263 | CORVET complex(GO:0033263) |
| 0.2 | 1.0 | GO:0005955 | calcineurin complex(GO:0005955) |
| 0.2 | 2.5 | GO:0034045 | pre-autophagosomal structure membrane(GO:0034045) |
| 0.2 | 1.1 | GO:0070695 | FHF complex(GO:0070695) |
| 0.2 | 10.7 | GO:0043198 | dendritic shaft(GO:0043198) |
| 0.2 | 2.1 | GO:0016600 | flotillin complex(GO:0016600) |
| 0.1 | 1.0 | GO:0005890 | sodium:potassium-exchanging ATPase complex(GO:0005890) |
| 0.1 | 1.0 | GO:0034364 | high-density lipoprotein particle(GO:0034364) |
| 0.1 | 8.8 | GO:0009925 | basal plasma membrane(GO:0009925) |
| 0.1 | 1.8 | GO:0000176 | nuclear exosome (RNase complex)(GO:0000176) |
| 0.1 | 2.0 | GO:0000421 | autophagosome membrane(GO:0000421) |
| 0.1 | 1.4 | GO:0000124 | SAGA complex(GO:0000124) |
| 0.1 | 0.6 | GO:1990712 | HFE-transferrin receptor complex(GO:1990712) |
| 0.1 | 2.9 | GO:0071565 | nBAF complex(GO:0071565) |
| 0.1 | 1.2 | GO:0030867 | rough endoplasmic reticulum membrane(GO:0030867) |
| 0.1 | 8.9 | GO:0035097 | histone methyltransferase complex(GO:0035097) |
| 0.1 | 0.9 | GO:0030008 | TRAPP complex(GO:0030008) |
| 0.1 | 4.0 | GO:0005834 | heterotrimeric G-protein complex(GO:0005834) |
| 0.1 | 0.9 | GO:0002178 | palmitoyltransferase complex(GO:0002178) |
| 0.1 | 6.7 | GO:0031225 | anchored component of membrane(GO:0031225) |
| 0.1 | 5.7 | GO:0005881 | cytoplasmic microtubule(GO:0005881) |
| 0.1 | 1.9 | GO:0030137 | COPI-coated vesicle(GO:0030137) |
| 0.1 | 3.8 | GO:0005791 | rough endoplasmic reticulum(GO:0005791) |
| 0.1 | 2.0 | GO:0005901 | caveola(GO:0005901) |
| 0.1 | 27.2 | GO:0031012 | extracellular matrix(GO:0031012) |
| 0.1 | 8.3 | GO:0044309 | neuron spine(GO:0044309) |
| 0.1 | 1.5 | GO:0016529 | sarcoplasmic reticulum(GO:0016529) |
| 0.1 | 4.1 | GO:0034705 | voltage-gated potassium channel complex(GO:0008076) potassium channel complex(GO:0034705) |
| 0.1 | 1.1 | GO:0005869 | dynactin complex(GO:0005869) |
| 0.1 | 1.6 | GO:0001741 | XY body(GO:0001741) |
| 0.1 | 2.7 | GO:0031201 | SNARE complex(GO:0031201) |
| 0.1 | 0.5 | GO:0000836 | ER ubiquitin ligase complex(GO:0000835) Hrd1p ubiquitin ligase complex(GO:0000836) |
| 0.1 | 3.5 | GO:0030964 | mitochondrial respiratory chain complex I(GO:0005747) NADH dehydrogenase complex(GO:0030964) respiratory chain complex I(GO:0045271) |
| 0.1 | 0.4 | GO:0042765 | GPI-anchor transamidase complex(GO:0042765) |
| 0.1 | 1.4 | GO:0005782 | peroxisomal matrix(GO:0005782) microbody lumen(GO:0031907) |
| 0.1 | 0.9 | GO:0014704 | intercalated disc(GO:0014704) |
| 0.1 | 2.3 | GO:0031594 | neuromuscular junction(GO:0031594) |
| 0.1 | 4.1 | GO:0016324 | apical plasma membrane(GO:0016324) |
| 0.1 | 0.6 | GO:0033180 | proton-transporting V-type ATPase, V1 domain(GO:0033180) |
| 0.1 | 2.0 | GO:0009897 | external side of plasma membrane(GO:0009897) |
| 0.1 | 1.0 | GO:0017119 | Golgi transport complex(GO:0017119) |
| 0.1 | 0.3 | GO:0035032 | phosphatidylinositol 3-kinase complex, class III(GO:0035032) |
| 0.0 | 0.3 | GO:0044291 | cell-cell contact zone(GO:0044291) |
| 0.0 | 0.6 | GO:0005675 | holo TFIIH complex(GO:0005675) |
| 0.0 | 1.6 | GO:0005788 | endoplasmic reticulum lumen(GO:0005788) |
| 0.0 | 0.2 | GO:0036513 | Derlin-1 retrotranslocation complex(GO:0036513) |
| 0.0 | 0.4 | GO:0020005 | symbiont-containing vacuole membrane(GO:0020005) |
| 0.0 | 2.3 | GO:0031463 | Cul3-RING ubiquitin ligase complex(GO:0031463) |
| 0.0 | 2.0 | GO:0031526 | brush border membrane(GO:0031526) |
| 0.0 | 0.3 | GO:0008074 | guanylate cyclase complex, soluble(GO:0008074) |
| 0.0 | 2.6 | GO:0030176 | integral component of endoplasmic reticulum membrane(GO:0030176) |
| 0.0 | 0.3 | GO:0045180 | basal cortex(GO:0045180) |
| 0.0 | 0.2 | GO:0031227 | intrinsic component of endoplasmic reticulum membrane(GO:0031227) |
| 0.0 | 0.3 | GO:0072546 | ER membrane protein complex(GO:0072546) |
| 0.0 | 0.3 | GO:0032420 | stereocilium(GO:0032420) |
| 0.0 | 0.2 | GO:0071782 | endoplasmic reticulum tubular network(GO:0071782) |
| 0.0 | 0.3 | GO:0033276 | transcription factor TFTC complex(GO:0033276) |
| 0.0 | 0.3 | GO:0043240 | Fanconi anaemia nuclear complex(GO:0043240) |
| 0.0 | 0.3 | GO:0031209 | SCAR complex(GO:0031209) |
| 0.0 | 0.5 | GO:0030667 | secretory granule membrane(GO:0030667) |
| 0.0 | 3.2 | GO:0097060 | synaptic membrane(GO:0097060) |
| 0.0 | 5.0 | GO:0005768 | endosome(GO:0005768) |
| 0.0 | 0.9 | GO:0030173 | integral component of Golgi membrane(GO:0030173) intrinsic component of Golgi membrane(GO:0031228) |
| 0.0 | 0.5 | GO:0000139 | Golgi membrane(GO:0000139) |
| 0.0 | 2.4 | GO:0005769 | early endosome(GO:0005769) |
| 0.0 | 1.4 | GO:0001726 | ruffle(GO:0001726) |
| 0.0 | 0.1 | GO:0070552 | BRISC complex(GO:0070552) |
| 0.0 | 0.1 | GO:0071942 | XPC complex(GO:0071942) |
| 0.0 | 0.8 | GO:0005802 | trans-Golgi network(GO:0005802) |
Gene overrepresentation in molecular_function category:
| Log-likelihood per target | Total log-likelihood | Term | Description |
|---|---|---|---|
| 4.3 | 12.8 | GO:0004517 | nitric-oxide synthase activity(GO:0004517) |
| 2.6 | 15.5 | GO:0045545 | syndecan binding(GO:0045545) |
| 2.4 | 55.4 | GO:0034185 | apolipoprotein binding(GO:0034185) |
| 2.0 | 8.1 | GO:0005008 | hepatocyte growth factor-activated receptor activity(GO:0005008) |
| 2.0 | 14.1 | GO:0032795 | G-protein coupled adenosine receptor activity(GO:0001609) heterotrimeric G-protein binding(GO:0032795) |
| 2.0 | 6.0 | GO:0002153 | steroid receptor RNA activator RNA binding(GO:0002153) |
| 1.9 | 11.6 | GO:0000155 | phosphorelay sensor kinase activity(GO:0000155) |
| 1.9 | 7.6 | GO:0004096 | catalase activity(GO:0004096) |
| 1.7 | 5.1 | GO:0015272 | ATP-activated inward rectifier potassium channel activity(GO:0015272) |
| 1.6 | 6.5 | GO:0031721 | haptoglobin binding(GO:0031720) hemoglobin alpha binding(GO:0031721) |
| 1.4 | 4.2 | GO:0046997 | sarcosine dehydrogenase activity(GO:0008480) oxidoreductase activity, acting on the CH-NH group of donors, flavin as acceptor(GO:0046997) |
| 1.3 | 5.2 | GO:0008332 | low voltage-gated calcium channel activity(GO:0008332) |
| 1.2 | 9.7 | GO:0046974 | histone methyltransferase activity (H3-K9 specific)(GO:0046974) |
| 1.2 | 4.7 | GO:0015349 | thyroid hormone transmembrane transporter activity(GO:0015349) |
| 1.1 | 3.4 | GO:0016155 | formyltetrahydrofolate dehydrogenase activity(GO:0016155) |
| 1.1 | 10.1 | GO:0032050 | clathrin heavy chain binding(GO:0032050) |
| 1.1 | 3.3 | GO:0004658 | propionyl-CoA carboxylase activity(GO:0004658) |
| 1.1 | 6.5 | GO:0015018 | galactosylgalactosylxylosylprotein 3-beta-glucuronosyltransferase activity(GO:0015018) |
| 1.1 | 3.2 | GO:0035175 | histone kinase activity (H3-S10 specific)(GO:0035175) |
| 1.0 | 3.1 | GO:0005006 | epidermal growth factor-activated receptor activity(GO:0005006) |
| 1.0 | 3.1 | GO:0005219 | ryanodine-sensitive calcium-release channel activity(GO:0005219) calcium-induced calcium release activity(GO:0048763) |
| 1.0 | 4.0 | GO:0045028 | G-protein coupled nucleotide receptor activity(GO:0001608) G-protein coupled purinergic nucleotide receptor activity(GO:0045028) |
| 1.0 | 5.0 | GO:0004105 | choline-phosphate cytidylyltransferase activity(GO:0004105) |
| 0.9 | 4.7 | GO:0033691 | sialic acid binding(GO:0033691) |
| 0.9 | 4.7 | GO:0005222 | intracellular cAMP activated cation channel activity(GO:0005222) |
| 0.9 | 0.9 | GO:0030215 | semaphorin receptor binding(GO:0030215) |
| 0.9 | 4.3 | GO:0005030 | neurotrophin receptor activity(GO:0005030) |
| 0.9 | 2.6 | GO:0003858 | 3-hydroxybutyrate dehydrogenase activity(GO:0003858) |
| 0.8 | 2.5 | GO:0004994 | somatostatin receptor activity(GO:0004994) |
| 0.8 | 2.5 | GO:0030249 | guanylate cyclase regulator activity(GO:0030249) |
| 0.8 | 4.8 | GO:0008499 | UDP-galactose:beta-N-acetylglucosamine beta-1,3-galactosyltransferase activity(GO:0008499) |
| 0.8 | 11.1 | GO:0008331 | high voltage-gated calcium channel activity(GO:0008331) |
| 0.8 | 4.7 | GO:0004332 | fructose-bisphosphate aldolase activity(GO:0004332) |
| 0.8 | 3.1 | GO:0005004 | GPI-linked ephrin receptor activity(GO:0005004) |
| 0.8 | 1.5 | GO:0005128 | erythropoietin receptor binding(GO:0005128) |
| 0.7 | 5.8 | GO:0043208 | glycosphingolipid binding(GO:0043208) |
| 0.7 | 11.3 | GO:0008188 | neuropeptide receptor activity(GO:0008188) |
| 0.7 | 1.4 | GO:0030226 | apolipoprotein receptor activity(GO:0030226) apolipoprotein A-I receptor activity(GO:0034188) |
| 0.7 | 2.7 | GO:0097109 | neuroligin family protein binding(GO:0097109) |
| 0.7 | 4.7 | GO:0003876 | AMP deaminase activity(GO:0003876) adenosine-phosphate deaminase activity(GO:0047623) |
| 0.6 | 3.9 | GO:0008486 | diphosphoinositol-polyphosphate diphosphatase activity(GO:0008486) |
| 0.6 | 0.6 | GO:0043183 | vascular endothelial growth factor receptor 1 binding(GO:0043183) |
| 0.6 | 1.9 | GO:0017153 | sodium:dicarboxylate symporter activity(GO:0017153) |
| 0.6 | 1.8 | GO:0016309 | 1-phosphatidylinositol-5-phosphate 4-kinase activity(GO:0016309) |
| 0.6 | 2.4 | GO:0030156 | benzodiazepine receptor binding(GO:0030156) |
| 0.6 | 2.3 | GO:0005093 | Rab GDP-dissociation inhibitor activity(GO:0005093) |
| 0.5 | 1.6 | GO:0004814 | arginine-tRNA ligase activity(GO:0004814) |
| 0.5 | 2.7 | GO:0005250 | A-type (transient outward) potassium channel activity(GO:0005250) |
| 0.5 | 4.3 | GO:0008046 | axon guidance receptor activity(GO:0008046) |
| 0.5 | 1.6 | GO:0004368 | glycerol-3-phosphate dehydrogenase activity(GO:0004368) |
| 0.5 | 7.4 | GO:0017154 | semaphorin receptor activity(GO:0017154) |
| 0.5 | 2.1 | GO:0070573 | tripeptidyl-peptidase activity(GO:0008240) metallodipeptidase activity(GO:0070573) |
| 0.5 | 1.5 | GO:0036361 | racemase and epimerase activity, acting on amino acids and derivatives(GO:0016855) racemase activity, acting on amino acids and derivatives(GO:0036361) amino-acid racemase activity(GO:0047661) |
| 0.5 | 3.0 | GO:0004691 | cAMP-dependent protein kinase activity(GO:0004691) |
| 0.5 | 3.0 | GO:0015265 | urea channel activity(GO:0015265) |
| 0.5 | 3.5 | GO:0032184 | SUMO polymer binding(GO:0032184) |
| 0.5 | 10.5 | GO:0004385 | guanylate kinase activity(GO:0004385) |
| 0.5 | 6.0 | GO:0047372 | acylglycerol lipase activity(GO:0047372) |
| 0.5 | 11.2 | GO:0043539 | protein serine/threonine kinase activator activity(GO:0043539) |
| 0.5 | 1.9 | GO:0031800 | type 3 metabotropic glutamate receptor binding(GO:0031800) |
| 0.5 | 2.9 | GO:0016907 | G-protein coupled acetylcholine receptor activity(GO:0016907) |
| 0.5 | 1.4 | GO:0072541 | peroxynitrite reductase activity(GO:0072541) |
| 0.5 | 1.9 | GO:0004667 | prostaglandin-D synthase activity(GO:0004667) |
| 0.5 | 1.4 | GO:0019120 | hydrolase activity, acting on acid halide bonds(GO:0016824) hydrolase activity, acting on acid halide bonds, in C-halide compounds(GO:0019120) alkylhalidase activity(GO:0047651) |
| 0.5 | 1.4 | GO:0001588 | dopamine neurotransmitter receptor activity, coupled via Gs(GO:0001588) dopamine neurotransmitter receptor activity, coupled via Gi/Go(GO:0001591) |
| 0.5 | 5.1 | GO:0038191 | neuropilin binding(GO:0038191) |
| 0.4 | 2.5 | GO:0008821 | crossover junction endodeoxyribonuclease activity(GO:0008821) |
| 0.4 | 3.4 | GO:0004767 | sphingomyelin phosphodiesterase activity(GO:0004767) |
| 0.4 | 4.2 | GO:0032036 | myosin heavy chain binding(GO:0032036) |
| 0.4 | 10.1 | GO:0005251 | delayed rectifier potassium channel activity(GO:0005251) |
| 0.4 | 3.2 | GO:0061133 | endopeptidase activator activity(GO:0061133) |
| 0.4 | 2.8 | GO:0015198 | oligopeptide transporter activity(GO:0015198) |
| 0.4 | 1.2 | GO:0030519 | snoRNP binding(GO:0030519) |
| 0.4 | 7.2 | GO:0005245 | voltage-gated calcium channel activity(GO:0005245) |
| 0.4 | 3.4 | GO:0042043 | neurexin family protein binding(GO:0042043) |
| 0.4 | 1.5 | GO:0005315 | inorganic phosphate transmembrane transporter activity(GO:0005315) |
| 0.4 | 8.1 | GO:0005520 | insulin-like growth factor binding(GO:0005520) |
| 0.4 | 2.2 | GO:0005042 | netrin receptor activity(GO:0005042) |
| 0.4 | 5.1 | GO:0008601 | protein phosphatase type 2A regulator activity(GO:0008601) |
| 0.4 | 2.5 | GO:0031821 | G-protein coupled serotonin receptor binding(GO:0031821) |
| 0.4 | 1.5 | GO:0031727 | CCR2 chemokine receptor binding(GO:0031727) |
| 0.4 | 1.5 | GO:0001733 | galactosylceramide sulfotransferase activity(GO:0001733) |
| 0.4 | 4.7 | GO:0005388 | calcium-transporting ATPase activity(GO:0005388) |
| 0.4 | 12.4 | GO:0022839 | ion gated channel activity(GO:0022839) |
| 0.3 | 2.7 | GO:0030550 | acetylcholine receptor inhibitor activity(GO:0030550) |
| 0.3 | 3.6 | GO:0004017 | adenylate kinase activity(GO:0004017) |
| 0.3 | 0.6 | GO:0004127 | cytidylate kinase activity(GO:0004127) |
| 0.3 | 1.2 | GO:0004092 | carnitine O-acetyltransferase activity(GO:0004092) |
| 0.3 | 0.9 | GO:0004637 | phosphoribosylamine-glycine ligase activity(GO:0004637) |
| 0.3 | 1.2 | GO:0003827 | alpha-1,3-mannosylglycoprotein 2-beta-N-acetylglucosaminyltransferase activity(GO:0003827) |
| 0.3 | 5.2 | GO:0001968 | fibronectin binding(GO:0001968) |
| 0.3 | 2.0 | GO:0019869 | chloride channel inhibitor activity(GO:0019869) |
| 0.3 | 1.4 | GO:0003835 | beta-galactoside alpha-2,6-sialyltransferase activity(GO:0003835) |
| 0.3 | 1.1 | GO:0015232 | heme transporter activity(GO:0015232) |
| 0.3 | 10.2 | GO:0005086 | ARF guanyl-nucleotide exchange factor activity(GO:0005086) |
| 0.3 | 1.4 | GO:0008273 | calcium, potassium:sodium antiporter activity(GO:0008273) |
| 0.3 | 1.4 | GO:0017162 | aryl hydrocarbon receptor binding(GO:0017162) |
| 0.3 | 1.1 | GO:0004103 | choline kinase activity(GO:0004103) |
| 0.3 | 0.8 | GO:0004962 | endothelin receptor activity(GO:0004962) |
| 0.3 | 7.3 | GO:0008157 | protein phosphatase 1 binding(GO:0008157) |
| 0.3 | 1.0 | GO:2001069 | glycogen binding(GO:2001069) |
| 0.3 | 1.3 | GO:0008269 | JAK pathway signal transduction adaptor activity(GO:0008269) |
| 0.3 | 1.0 | GO:0004483 | mRNA (nucleoside-2'-O-)-methyltransferase activity(GO:0004483) |
| 0.2 | 9.0 | GO:0001540 | beta-amyloid binding(GO:0001540) |
| 0.2 | 1.2 | GO:0004839 | ubiquitin activating enzyme activity(GO:0004839) |
| 0.2 | 2.2 | GO:0019871 | sodium channel inhibitor activity(GO:0019871) |
| 0.2 | 2.6 | GO:0016500 | protein-hormone receptor activity(GO:0016500) |
| 0.2 | 3.5 | GO:0005545 | 1-phosphatidylinositol binding(GO:0005545) |
| 0.2 | 8.2 | GO:0030552 | cAMP binding(GO:0030552) |
| 0.2 | 4.8 | GO:0050750 | low-density lipoprotein particle receptor binding(GO:0050750) |
| 0.2 | 1.5 | GO:0005094 | Rho GDP-dissociation inhibitor activity(GO:0005094) |
| 0.2 | 1.9 | GO:0003873 | 6-phosphofructo-2-kinase activity(GO:0003873) fructose-2,6-bisphosphate 2-phosphatase activity(GO:0004331) |
| 0.2 | 4.9 | GO:0008330 | protein tyrosine/threonine phosphatase activity(GO:0008330) |
| 0.2 | 1.7 | GO:0016215 | acyl-CoA desaturase activity(GO:0016215) |
| 0.2 | 2.3 | GO:0034943 | acyl-CoA ligase activity(GO:0003996) 3-oxo-2-(2'-pentenyl)cyclopentane-1-octanoic acid CoA ligase activity(GO:0010435) 3-isopropenyl-6-oxoheptanoyl-CoA synthetase activity(GO:0018854) 2-oxo-delta3-4,5,5-trimethylcyclopentenylacetyl-CoA synthetase activity(GO:0018855) benzoyl acetate-CoA ligase activity(GO:0018856) 2,4-dichlorobenzoate-CoA ligase activity(GO:0018857) pivalate-CoA ligase activity(GO:0034783) cyclopropanecarboxylate-CoA ligase activity(GO:0034793) adipate-CoA ligase activity(GO:0034796) citronellyl-CoA ligase activity(GO:0034823) mentha-1,3-dione-CoA ligase activity(GO:0034841) thiophene-2-carboxylate-CoA ligase activity(GO:0034842) 2,4,4-trimethylpentanoate-CoA ligase activity(GO:0034865) cis-2-methyl-5-isopropylhexa-2,5-dienoate-CoA ligase activity(GO:0034942) trans-2-methyl-5-isopropylhexa-2,5-dienoate-CoA ligase activity(GO:0034943) branched-chain acyl-CoA synthetase (ADP-forming) activity(GO:0043759) aryl-CoA synthetase (ADP-forming) activity(GO:0043762) 3-hydroxypropionyl-CoA synthetase activity(GO:0043955) perillic acid:CoA ligase (ADP-forming) activity(GO:0052685) perillic acid:CoA ligase (AMP-forming) activity(GO:0052686) (3R)-3-isopropenyl-6-oxoheptanoate:CoA ligase (ADP-forming) activity(GO:0052687) (3R)-3-isopropenyl-6-oxoheptanoate:CoA ligase (AMP-forming) activity(GO:0052688) pristanate-CoA ligase activity(GO:0070251) malonyl-CoA synthetase activity(GO:0090409) |
| 0.2 | 1.6 | GO:0001972 | retinoic acid binding(GO:0001972) |
| 0.2 | 0.6 | GO:0005220 | inositol 1,4,5-trisphosphate-sensitive calcium-release channel activity(GO:0005220) |
| 0.2 | 0.6 | GO:0004828 | serine-tRNA ligase activity(GO:0004828) |
| 0.2 | 3.6 | GO:0004890 | GABA-A receptor activity(GO:0004890) |
| 0.2 | 0.6 | GO:0004998 | transferrin receptor activity(GO:0004998) |
| 0.2 | 0.9 | GO:0008761 | UDP-N-acetylglucosamine 2-epimerase activity(GO:0008761) |
| 0.2 | 0.6 | GO:0044388 | tyrosine 3-monooxygenase activator activity(GO:0036470) L-dopa decarboxylase activator activity(GO:0036478) small protein activating enzyme binding(GO:0044388) cupric ion binding(GO:1903135) cuprous ion binding(GO:1903136) glyoxalase (glycolic acid-forming) activity(GO:1990422) |
| 0.2 | 0.6 | GO:0001851 | complement component C3b binding(GO:0001851) proteinase activated receptor binding(GO:0031871) |
| 0.2 | 0.6 | GO:0005168 | neurotrophin TRKA receptor binding(GO:0005168) |
| 0.2 | 0.5 | GO:0008527 | taste receptor activity(GO:0008527) |
| 0.2 | 1.9 | GO:0004972 | NMDA glutamate receptor activity(GO:0004972) |
| 0.2 | 4.0 | GO:0050431 | transforming growth factor beta binding(GO:0050431) |
| 0.2 | 1.0 | GO:0033192 | calcium-dependent protein serine/threonine phosphatase activity(GO:0004723) calmodulin-dependent protein phosphatase activity(GO:0033192) |
| 0.2 | 0.5 | GO:0019002 | GMP binding(GO:0019002) |
| 0.2 | 0.5 | GO:0015143 | urate transmembrane transporter activity(GO:0015143) salt transmembrane transporter activity(GO:1901702) |
| 0.2 | 3.7 | GO:0017046 | peptide hormone binding(GO:0017046) |
| 0.2 | 3.5 | GO:0004012 | phospholipid-translocating ATPase activity(GO:0004012) |
| 0.2 | 1.8 | GO:0022841 | potassium ion leak channel activity(GO:0022841) |
| 0.2 | 1.1 | GO:0031545 | peptidyl-proline 4-dioxygenase activity(GO:0031545) |
| 0.2 | 3.1 | GO:0042287 | MHC protein binding(GO:0042287) |
| 0.2 | 2.4 | GO:0033549 | MAP kinase phosphatase activity(GO:0033549) |
| 0.2 | 4.3 | GO:0005385 | zinc ion transmembrane transporter activity(GO:0005385) |
| 0.2 | 1.4 | GO:0016701 | oxidoreductase activity, acting on single donors with incorporation of molecular oxygen(GO:0016701) oxidoreductase activity, acting on single donors with incorporation of molecular oxygen, incorporation of two atoms of oxygen(GO:0016702) |
| 0.2 | 1.1 | GO:0048406 | nerve growth factor binding(GO:0048406) |
| 0.2 | 1.1 | GO:0004351 | glutamate decarboxylase activity(GO:0004351) |
| 0.2 | 1.4 | GO:0004571 | mannosyl-oligosaccharide 1,2-alpha-mannosidase activity(GO:0004571) |
| 0.2 | 2.0 | GO:0048038 | quinone binding(GO:0048038) |
| 0.2 | 1.6 | GO:0004534 | 5'-3' exoribonuclease activity(GO:0004534) |
| 0.1 | 0.9 | GO:0003828 | alpha-N-acetylneuraminate alpha-2,8-sialyltransferase activity(GO:0003828) |
| 0.1 | 2.4 | GO:0042809 | vitamin D receptor binding(GO:0042809) |
| 0.1 | 1.2 | GO:0005003 | ephrin receptor activity(GO:0005003) |
| 0.1 | 13.4 | GO:0005178 | integrin binding(GO:0005178) |
| 0.1 | 1.3 | GO:0005007 | fibroblast growth factor-activated receptor activity(GO:0005007) |
| 0.1 | 1.0 | GO:0045703 | pinocarveol dehydrogenase activity(GO:0018446) chloral hydrate dehydrogenase activity(GO:0018447) hydroxymethylmethylsilanediol oxidase activity(GO:0018448) 1-phenylethanol dehydrogenase activity(GO:0018449) myrtenol dehydrogenase activity(GO:0018450) cis-1,2-dihydroxy-1,2-dihydro-8-carboxynaphthalene dehydrogenase activity(GO:0034522) 3-hydroxy-4-methyloctanoyl-CoA dehydrogenase activity(GO:0034582) 2-hydroxy-4-isopropenylcyclohexane-1-carboxyl-CoA dehydrogenase activity(GO:0034778) cis-9,10-dihydroanthracene-9,10-diol dehydrogenase activity(GO:0034817) citronellol dehydrogenase activity(GO:0034821) naphthyl-2-hydroxymethyl-succinyl-CoA dehydrogenase activity(GO:0034847) 2,4,4-trimethyl-1-pentanol dehydrogenase activity(GO:0034863) 2,4,4-trimethyl-3-hydroxypentanoyl-CoA dehydrogenase activity(GO:0034868) 1-hydroxy-4,4-dimethylpentan-3-one dehydrogenase activity(GO:0034871) endosulfan diol dehydrogenase activity(GO:0034891) endosulfan hydroxyether dehydrogenase activity(GO:0034901) 3-hydroxy-2-methylhexanoyl-CoA dehydrogenase activity(GO:0034918) 3-hydroxy-2,6-dimethyl-5-methylene-heptanoyl-CoA dehydrogenase activity(GO:0034944) versicolorin reductase activity(GO:0042469) ketoreductase activity(GO:0045703) |
| 0.1 | 0.4 | GO:0043546 | molybdopterin cofactor binding(GO:0043546) |
| 0.1 | 7.7 | GO:0017022 | myosin binding(GO:0017022) |
| 0.1 | 0.3 | GO:0004749 | ribose phosphate diphosphokinase activity(GO:0004749) |
| 0.1 | 4.3 | GO:0005154 | epidermal growth factor receptor binding(GO:0005154) |
| 0.1 | 3.2 | GO:0003785 | actin monomer binding(GO:0003785) |
| 0.1 | 0.8 | GO:0046912 | transferase activity, transferring acyl groups, acyl groups converted into alkyl on transfer(GO:0046912) |
| 0.1 | 0.8 | GO:0008467 | [heparan sulfate]-glucosamine 3-sulfotransferase 1 activity(GO:0008467) |
| 0.1 | 0.5 | GO:0008853 | exodeoxyribonuclease III activity(GO:0008853) |
| 0.1 | 3.1 | GO:0004714 | transmembrane receptor protein tyrosine kinase activity(GO:0004714) |
| 0.1 | 1.9 | GO:0070300 | phosphatidic acid binding(GO:0070300) |
| 0.1 | 1.0 | GO:0035612 | AP-2 adaptor complex binding(GO:0035612) |
| 0.1 | 12.3 | GO:0002020 | protease binding(GO:0002020) |
| 0.1 | 1.1 | GO:0004416 | hydroxyacylglutathione hydrolase activity(GO:0004416) |
| 0.1 | 0.9 | GO:0070628 | proteasome binding(GO:0070628) |
| 0.1 | 2.3 | GO:0051765 | inositol tetrakisphosphate kinase activity(GO:0051765) |
| 0.1 | 2.2 | GO:0034930 | N-acetylglucosamine 6-O-sulfotransferase activity(GO:0001517) heparan sulfate 2-O-sulfotransferase activity(GO:0004394) HNK-1 sulfotransferase activity(GO:0016232) heparan sulfate 6-O-sulfotransferase activity(GO:0017095) trans-9R,10R-dihydrodiolphenanthrene sulfotransferase activity(GO:0018721) 1-phenanthrol sulfotransferase activity(GO:0018722) 3-phenanthrol sulfotransferase activity(GO:0018723) 4-phenanthrol sulfotransferase activity(GO:0018724) trans-3,4-dihydrodiolphenanthrene sulfotransferase activity(GO:0018725) 9-phenanthrol sulfotransferase activity(GO:0018726) 2-phenanthrol sulfotransferase activity(GO:0018727) phenanthrol sulfotransferase activity(GO:0019111) 1-hydroxypyrene sulfotransferase activity(GO:0034930) proteoglycan sulfotransferase activity(GO:0050698) cholesterol sulfotransferase activity(GO:0051922) hydroxyjasmonate sulfotransferase activity(GO:0080131) |
| 0.1 | 0.6 | GO:0003956 | NAD(P)+-protein-arginine ADP-ribosyltransferase activity(GO:0003956) |
| 0.1 | 4.2 | GO:0045499 | chemorepellent activity(GO:0045499) |
| 0.1 | 0.6 | GO:0004719 | protein-L-isoaspartate (D-aspartate) O-methyltransferase activity(GO:0004719) |
| 0.1 | 1.9 | GO:0080025 | phosphatidylinositol-3,5-bisphosphate binding(GO:0080025) |
| 0.1 | 0.3 | GO:0051525 | NFAT protein binding(GO:0051525) |
| 0.1 | 0.9 | GO:0048495 | Roundabout binding(GO:0048495) |
| 0.1 | 1.5 | GO:0050811 | GABA receptor binding(GO:0050811) |
| 0.1 | 3.1 | GO:0003746 | translation elongation factor activity(GO:0003746) |
| 0.1 | 0.3 | GO:0019198 | transmembrane receptor protein phosphatase activity(GO:0019198) |
| 0.1 | 0.4 | GO:0032422 | purine-rich negative regulatory element binding(GO:0032422) |
| 0.1 | 3.2 | GO:0004364 | glutathione transferase activity(GO:0004364) |
| 0.1 | 2.9 | GO:0005262 | calcium channel activity(GO:0005262) |
| 0.1 | 2.5 | GO:0001671 | ATPase activator activity(GO:0001671) |
| 0.1 | 2.2 | GO:0016922 | ligand-dependent nuclear receptor binding(GO:0016922) |
| 0.1 | 2.8 | GO:0004707 | MAP kinase activity(GO:0004707) |
| 0.1 | 2.7 | GO:0017080 | sodium channel regulator activity(GO:0017080) |
| 0.1 | 0.5 | GO:0035033 | histone deacetylase regulator activity(GO:0035033) |
| 0.1 | 1.1 | GO:0042165 | neurotransmitter binding(GO:0042165) |
| 0.1 | 1.6 | GO:0097602 | cullin family protein binding(GO:0097602) |
| 0.1 | 4.5 | GO:0005518 | collagen binding(GO:0005518) |
| 0.1 | 1.3 | GO:0031434 | mitogen-activated protein kinase kinase binding(GO:0031434) |
| 0.1 | 2.3 | GO:0008093 | cytoskeletal adaptor activity(GO:0008093) |
| 0.1 | 0.9 | GO:0044653 | trehalase activity(GO:0015927) dextrin alpha-glucosidase activity(GO:0044653) starch alpha-glucosidase activity(GO:0044654) beta-glucanase activity(GO:0052736) beta-6-sulfate-N-acetylglucosaminidase activity(GO:0052769) glucan endo-1,4-beta-glucosidase activity(GO:0052859) |
| 0.1 | 5.6 | GO:0008201 | heparin binding(GO:0008201) |
| 0.1 | 1.9 | GO:0046965 | retinoid X receptor binding(GO:0046965) |
| 0.1 | 3.1 | GO:0045502 | dynein binding(GO:0045502) |
| 0.1 | 5.0 | GO:0035064 | methylated histone binding(GO:0035064) |
| 0.1 | 0.3 | GO:0003938 | IMP dehydrogenase activity(GO:0003938) |
| 0.1 | 5.2 | GO:0015179 | L-amino acid transmembrane transporter activity(GO:0015179) |
| 0.1 | 2.1 | GO:0005246 | calcium channel regulator activity(GO:0005246) |
| 0.1 | 0.8 | GO:0030957 | Tat protein binding(GO:0030957) |
| 0.1 | 1.3 | GO:0015095 | magnesium ion transmembrane transporter activity(GO:0015095) |
| 0.1 | 0.8 | GO:0005225 | volume-sensitive anion channel activity(GO:0005225) |
| 0.1 | 0.3 | GO:1902379 | chemoattractant activity involved in axon guidance(GO:1902379) |
| 0.1 | 0.7 | GO:0071855 | neuropeptide receptor binding(GO:0071855) |
| 0.1 | 1.3 | GO:0004709 | MAP kinase kinase kinase activity(GO:0004709) |
| 0.1 | 0.4 | GO:0017099 | very-long-chain-acyl-CoA dehydrogenase activity(GO:0017099) |
| 0.1 | 1.2 | GO:0042805 | actinin binding(GO:0042805) |
| 0.1 | 2.0 | GO:0017112 | Rab guanyl-nucleotide exchange factor activity(GO:0017112) |
| 0.1 | 0.2 | GO:0047066 | phospholipid-hydroperoxide glutathione peroxidase activity(GO:0047066) |
| 0.1 | 0.8 | GO:0034987 | immunoglobulin receptor binding(GO:0034987) |
| 0.1 | 0.8 | GO:0051428 | peptide hormone receptor binding(GO:0051428) |
| 0.1 | 0.5 | GO:0030332 | cyclin binding(GO:0030332) |
| 0.1 | 0.7 | GO:0016863 | intramolecular oxidoreductase activity, transposing C=C bonds(GO:0016863) |
| 0.1 | 0.4 | GO:0032453 | histone demethylase activity (H3-K4 specific)(GO:0032453) |
| 0.1 | 0.7 | GO:0016755 | transferase activity, transferring amino-acyl groups(GO:0016755) |
| 0.1 | 1.9 | GO:0001205 | transcriptional activator activity, RNA polymerase II distal enhancer sequence-specific binding(GO:0001205) |
| 0.0 | 0.6 | GO:0035255 | ionotropic glutamate receptor binding(GO:0035255) |
| 0.0 | 0.4 | GO:0050072 | m7G(5')pppN diphosphatase activity(GO:0050072) |
| 0.0 | 0.8 | GO:0070064 | proline-rich region binding(GO:0070064) |
| 0.0 | 3.5 | GO:0019210 | protein kinase inhibitor activity(GO:0004860) kinase inhibitor activity(GO:0019210) |
| 0.0 | 1.0 | GO:0017147 | Wnt-protein binding(GO:0017147) |
| 0.0 | 1.1 | GO:0050136 | NADH dehydrogenase (ubiquinone) activity(GO:0008137) NADH dehydrogenase (quinone) activity(GO:0050136) |
| 0.0 | 2.5 | GO:0004252 | serine-type endopeptidase activity(GO:0004252) |
| 0.0 | 0.9 | GO:0004298 | threonine-type endopeptidase activity(GO:0004298) threonine-type peptidase activity(GO:0070003) |
| 0.0 | 0.5 | GO:0070636 | single-strand selective uracil DNA N-glycosylase activity(GO:0017065) nicotinamide riboside hydrolase activity(GO:0070635) nicotinic acid riboside hydrolase activity(GO:0070636) deoxyribonucleoside 5'-monophosphate N-glycosidase activity(GO:0070694) |
| 0.0 | 1.1 | GO:0005201 | extracellular matrix structural constituent(GO:0005201) |
| 0.0 | 0.5 | GO:0016538 | cyclin-dependent protein serine/threonine kinase regulator activity(GO:0016538) |
| 0.0 | 1.0 | GO:0005528 | macrolide binding(GO:0005527) FK506 binding(GO:0005528) |
| 0.0 | 3.1 | GO:0015078 | hydrogen ion transmembrane transporter activity(GO:0015078) |
| 0.0 | 2.7 | GO:0043851 | rRNA (adenine-N6,N6-)-dimethyltransferase activity(GO:0000179) rRNA (uridine-2'-O-)-methyltransferase activity(GO:0008650) rRNA (adenine-N6-)-methyltransferase activity(GO:0008988) rRNA (cytosine-C5-)-methyltransferase activity(GO:0009383) selenocysteine methyltransferase activity(GO:0016205) rRNA (adenine) methyltransferase activity(GO:0016433) rRNA (cytosine) methyltransferase activity(GO:0016434) rRNA (guanine) methyltransferase activity(GO:0016435) 1-phenanthrol methyltransferase activity(GO:0018707) protein-arginine N5-methyltransferase activity(GO:0019702) dimethylarsinite methyltransferase activity(GO:0034541) 4,5-dihydroxybenzo(a)pyrene methyltransferase activity(GO:0034807) 1-hydroxypyrene methyltransferase activity(GO:0034931) 1-hydroxy-6-methoxypyrene methyltransferase activity(GO:0034933) demethylmenaquinone methyltransferase activity(GO:0043770) cobalt-precorrin-6B C5-methyltransferase activity(GO:0043776) cobalt-precorrin-7 C15-methyltransferase activity(GO:0043777) cobalt-precorrin-5B C1-methyltransferase activity(GO:0043780) cobalt-precorrin-3 C17-methyltransferase activity(GO:0043782) dimethylamine methyltransferase activity(GO:0043791) hydroxyneurosporene-O-methyltransferase activity(GO:0043803) tRNA (adenine-57, 58-N(1)-) methyltransferase activity(GO:0043827) methylamine-specific methylcobalamin:coenzyme M methyltransferase activity(GO:0043833) trimethylamine methyltransferase activity(GO:0043834) methanol-specific methylcobalamin:coenzyme M methyltransferase activity(GO:0043851) monomethylamine methyltransferase activity(GO:0043852) P-methyltransferase activity(GO:0051994) Se-methyltransferase activity(GO:0051995) 2-phytyl-1,4-naphthoquinone methyltransferase activity(GO:0052624) tRNA (uracil-2'-O-)-methyltransferase activity(GO:0052665) tRNA (cytosine-2'-O-)-methyltransferase activity(GO:0052666) phosphomethylethanolamine N-methyltransferase activity(GO:0052667) tRNA (cytosine-3-)-methyltransferase activity(GO:0052735) rRNA (cytosine-2'-O-)-methyltransferase activity(GO:0070677) rRNA (cytosine-N4-)-methyltransferase activity(GO:0071424) trihydroxyferuloyl spermidine O-methyltransferase activity(GO:0080012) |
| 0.0 | 1.1 | GO:0050699 | WW domain binding(GO:0050699) |
| 0.0 | 2.4 | GO:0030165 | PDZ domain binding(GO:0030165) |
| 0.0 | 1.1 | GO:0005484 | SNAP receptor activity(GO:0005484) |
| 0.0 | 3.7 | GO:0017124 | SH3 domain binding(GO:0017124) |
| 0.0 | 0.2 | GO:0008392 | arachidonic acid monooxygenase activity(GO:0008391) arachidonic acid epoxygenase activity(GO:0008392) |
| 0.0 | 0.5 | GO:0003950 | NAD+ ADP-ribosyltransferase activity(GO:0003950) |
| 0.0 | 1.0 | GO:0030674 | protein binding, bridging(GO:0030674) |
| 0.0 | 0.3 | GO:0071933 | Arp2/3 complex binding(GO:0071933) |
| 0.0 | 0.9 | GO:0005544 | calcium-dependent phospholipid binding(GO:0005544) |
| 0.0 | 1.0 | GO:0031369 | translation initiation factor binding(GO:0031369) |
| 0.0 | 0.6 | GO:0035254 | glutamate receptor binding(GO:0035254) |
| 0.0 | 0.7 | GO:0071889 | 14-3-3 protein binding(GO:0071889) |
| 0.0 | 7.0 | GO:0016881 | acid-amino acid ligase activity(GO:0016881) |
| 0.0 | 0.3 | GO:0102338 | fatty acid elongase activity(GO:0009922) 3-oxo-arachidoyl-CoA synthase activity(GO:0102336) 3-oxo-cerotoyl-CoA synthase activity(GO:0102337) 3-oxo-lignoceronyl-CoA synthase activity(GO:0102338) |
| 0.0 | 0.5 | GO:0031078 | histone deacetylase activity (H3-K14 specific)(GO:0031078) NAD-dependent histone deacetylase activity (H3-K14 specific)(GO:0032041) |
| 0.0 | 0.4 | GO:0005249 | voltage-gated potassium channel activity(GO:0005249) |
| 0.0 | 0.2 | GO:0031702 | angiotensin receptor binding(GO:0031701) type 1 angiotensin receptor binding(GO:0031702) |
| 0.0 | 0.5 | GO:0004712 | protein serine/threonine/tyrosine kinase activity(GO:0004712) |
| 0.0 | 0.1 | GO:0004830 | tryptophan-tRNA ligase activity(GO:0004830) |
| 0.0 | 1.8 | GO:0001664 | G-protein coupled receptor binding(GO:0001664) |
| 0.0 | 0.0 | GO:0016635 | oxidoreductase activity, acting on the CH-CH group of donors, quinone or related compound as acceptor(GO:0016635) |
| 0.0 | 0.3 | GO:0070577 | lysine-acetylated histone binding(GO:0070577) |
| 0.0 | 0.6 | GO:0019003 | GDP binding(GO:0019003) |
| 0.0 | 0.1 | GO:0003836 | beta-galactoside (CMP) alpha-2,3-sialyltransferase activity(GO:0003836) |
| 0.0 | 0.1 | GO:0004740 | pyruvate dehydrogenase (acetyl-transferring) kinase activity(GO:0004740) |
| 0.0 | 0.7 | GO:0004702 | receptor signaling protein serine/threonine kinase activity(GO:0004702) |
| 0.0 | 0.5 | GO:0031490 | chromatin DNA binding(GO:0031490) |
| 0.0 | 0.3 | GO:0019209 | kinase activator activity(GO:0019209) |
| 0.0 | 0.1 | GO:0005217 | intracellular ligand-gated ion channel activity(GO:0005217) |
| 0.0 | 0.3 | GO:0046875 | ephrin receptor binding(GO:0046875) |