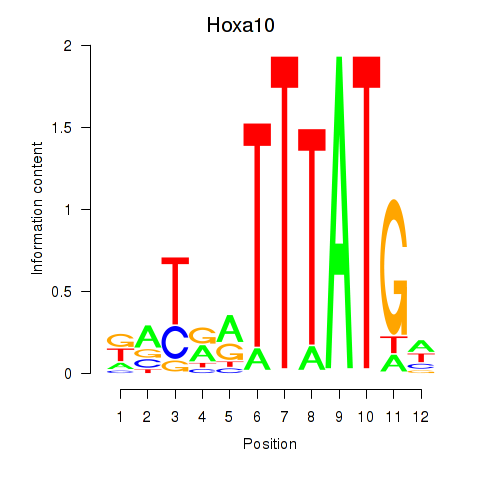
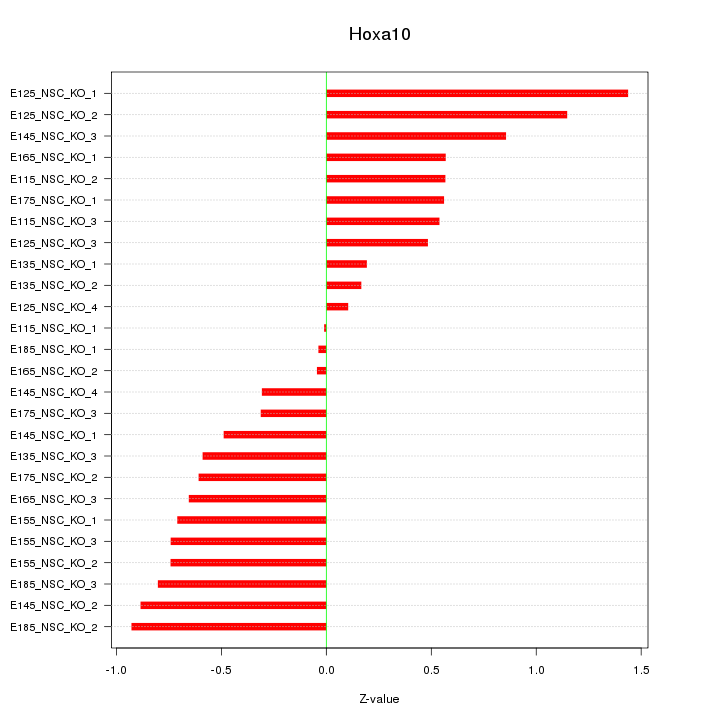
Motif ID: Hoxa10
Z-value: 0.655
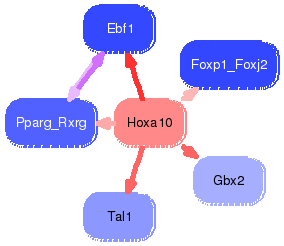
Transcription factors associated with Hoxa10:
| Gene Symbol | Entrez ID | Gene Name |
|---|---|---|
| Hoxa10 | ENSMUSG00000000938.11 | Hoxa10 |


Top targets:
Gene overrepresentation in biological_process category:
| Log-likelihood per target | Total log-likelihood | Term | Description |
|---|---|---|---|
| 1.1 | 3.4 | GO:0060217 | hemangioblast cell differentiation(GO:0060217) |
| 0.7 | 2.2 | GO:0016095 | polyprenol catabolic process(GO:0016095) terpenoid catabolic process(GO:0016115) primary alcohol catabolic process(GO:0034310) |
| 0.4 | 1.3 | GO:2000562 | negative regulation of interferon-gamma secretion(GO:1902714) negative regulation of CD4-positive, alpha-beta T cell proliferation(GO:2000562) |
| 0.3 | 2.0 | GO:0021555 | midbrain-hindbrain boundary morphogenesis(GO:0021555) |
| 0.3 | 1.9 | GO:0060923 | cardiac muscle cell fate commitment(GO:0060923) |
| 0.2 | 0.6 | GO:0050929 | corticospinal neuron axon guidance through spinal cord(GO:0021972) positive regulation of negative chemotaxis(GO:0050924) induction of negative chemotaxis(GO:0050929) negative regulation of mononuclear cell migration(GO:0071676) negative regulation of retinal ganglion cell axon guidance(GO:0090260) |
| 0.2 | 0.7 | GO:1903898 | positive regulation of translation in response to endoplasmic reticulum stress(GO:0036493) negative regulation of PERK-mediated unfolded protein response(GO:1903898) |
| 0.2 | 1.4 | GO:0071493 | cellular response to UV-B(GO:0071493) replicative senescence(GO:0090399) |
| 0.1 | 0.8 | GO:0089711 | L-glutamate transmembrane transport(GO:0089711) |
| 0.1 | 0.4 | GO:0044861 | protein transport into plasma membrane raft(GO:0044861) |
| 0.1 | 0.4 | GO:1903998 | regulation of eating behavior(GO:1903998) |
| 0.1 | 0.7 | GO:0032625 | interleukin-21 production(GO:0032625) interleukin-21 secretion(GO:0072619) |
| 0.1 | 2.0 | GO:0006825 | copper ion transport(GO:0006825) |
| 0.1 | 0.6 | GO:0031508 | pericentric heterochromatin assembly(GO:0031508) |
| 0.1 | 1.0 | GO:0021942 | radial glia guided migration of Purkinje cell(GO:0021942) |
| 0.1 | 0.2 | GO:1900275 | negative regulation of phospholipase C activity(GO:1900275) |
| 0.1 | 0.5 | GO:0007258 | JUN phosphorylation(GO:0007258) |
| 0.1 | 0.5 | GO:0001887 | selenium compound metabolic process(GO:0001887) |
| 0.1 | 2.0 | GO:0007617 | mating behavior(GO:0007617) multi-organism reproductive behavior(GO:0044705) |
| 0.1 | 0.7 | GO:0051574 | positive regulation of histone H3-K9 methylation(GO:0051574) |
| 0.1 | 0.5 | GO:0034638 | phosphatidylcholine catabolic process(GO:0034638) |
| 0.1 | 0.3 | GO:0032914 | positive regulation of transforming growth factor beta1 production(GO:0032914) |
| 0.0 | 0.1 | GO:0002430 | complement receptor mediated signaling pathway(GO:0002430) |
| 0.0 | 0.4 | GO:0071420 | cellular response to histamine(GO:0071420) |
| 0.0 | 0.2 | GO:0034184 | positive regulation of maintenance of sister chromatid cohesion(GO:0034093) positive regulation of maintenance of mitotic sister chromatid cohesion(GO:0034184) |
| 0.0 | 0.1 | GO:0006419 | alanyl-tRNA aminoacylation(GO:0006419) |
| 0.0 | 0.2 | GO:0070125 | mitochondrial translational elongation(GO:0070125) |
| 0.0 | 0.3 | GO:0030263 | apoptotic chromosome condensation(GO:0030263) |
| 0.0 | 0.2 | GO:0006957 | complement activation, alternative pathway(GO:0006957) |
| 0.0 | 0.2 | GO:1990118 | sodium ion import across plasma membrane(GO:0098719) sodium ion import into cell(GO:1990118) |
| 0.0 | 0.6 | GO:0010603 | regulation of cytoplasmic mRNA processing body assembly(GO:0010603) |
| 0.0 | 0.1 | GO:0038108 | negative regulation of appetite by leptin-mediated signaling pathway(GO:0038108) |
| 0.0 | 0.3 | GO:0006120 | mitochondrial electron transport, NADH to ubiquinone(GO:0006120) |
| 0.0 | 0.2 | GO:0038032 | termination of G-protein coupled receptor signaling pathway(GO:0038032) |
| 0.0 | 0.2 | GO:0048254 | snoRNA localization(GO:0048254) |
| 0.0 | 0.6 | GO:0034643 | establishment of mitochondrion localization, microtubule-mediated(GO:0034643) mitochondrion transport along microtubule(GO:0047497) |
| 0.0 | 0.2 | GO:0060662 | tube lumen cavitation(GO:0060605) salivary gland cavitation(GO:0060662) |
| 0.0 | 0.4 | GO:0034390 | smooth muscle cell apoptotic process(GO:0034390) regulation of smooth muscle cell apoptotic process(GO:0034391) |
| 0.0 | 0.6 | GO:1901522 | positive regulation of transcription from RNA polymerase II promoter involved in cellular response to chemical stimulus(GO:1901522) |
| 0.0 | 0.3 | GO:0044539 | long-chain fatty acid import(GO:0044539) |
| 0.0 | 0.8 | GO:0051930 | regulation of sensory perception of pain(GO:0051930) regulation of sensory perception(GO:0051931) |
| 0.0 | 0.3 | GO:0001539 | cilium or flagellum-dependent cell motility(GO:0001539) cilium-dependent cell motility(GO:0060285) |
| 0.0 | 0.3 | GO:0097062 | dendritic spine maintenance(GO:0097062) |
| 0.0 | 0.1 | GO:1902268 | negative regulation of polyamine transmembrane transport(GO:1902268) |
| 0.0 | 0.1 | GO:0019695 | choline metabolic process(GO:0019695) |
| 0.0 | 1.2 | GO:0008203 | cholesterol metabolic process(GO:0008203) |
Gene overrepresentation in cellular_component category:
| Log-likelihood per target | Total log-likelihood | Term | Description |
|---|---|---|---|
| 1.1 | 3.4 | GO:0033193 | Lsd1/2 complex(GO:0033193) |
| 0.5 | 1.4 | GO:0070557 | PCNA-p21 complex(GO:0070557) |
| 0.3 | 1.0 | GO:0043224 | nuclear SCF ubiquitin ligase complex(GO:0043224) |
| 0.2 | 0.6 | GO:0044299 | C-fiber(GO:0044299) |
| 0.2 | 0.8 | GO:0071006 | U2-type catalytic step 1 spliceosome(GO:0071006) |
| 0.1 | 0.7 | GO:0000164 | protein phosphatase type 1 complex(GO:0000164) |
| 0.0 | 0.1 | GO:0038037 | G-protein coupled receptor dimeric complex(GO:0038037) G-protein coupled receptor complex(GO:0097648) |
| 0.0 | 0.4 | GO:0044352 | pinosome(GO:0044352) macropinosome(GO:0044354) |
| 0.0 | 0.2 | GO:0044308 | axonal spine(GO:0044308) |
| 0.0 | 0.3 | GO:0097442 | CA3 pyramidal cell dendrite(GO:0097442) |
| 0.0 | 0.3 | GO:0061574 | ASAP complex(GO:0061574) |
| 0.0 | 0.4 | GO:0043196 | varicosity(GO:0043196) |
| 0.0 | 0.7 | GO:0035098 | ESC/E(Z) complex(GO:0035098) |
| 0.0 | 1.1 | GO:0032420 | stereocilium(GO:0032420) |
| 0.0 | 0.8 | GO:0030673 | axolemma(GO:0030673) |
| 0.0 | 0.1 | GO:0030015 | CCR4-NOT core complex(GO:0030015) |
| 0.0 | 0.4 | GO:1902710 | GABA receptor complex(GO:1902710) GABA-A receptor complex(GO:1902711) |
| 0.0 | 0.2 | GO:0030915 | Smc5-Smc6 complex(GO:0030915) |
| 0.0 | 0.2 | GO:0031428 | box C/D snoRNP complex(GO:0031428) |
| 0.0 | 0.2 | GO:1990023 | mitotic spindle midzone(GO:1990023) |
| 0.0 | 0.3 | GO:0000940 | condensed chromosome outer kinetochore(GO:0000940) |
| 0.0 | 0.3 | GO:0098643 | fibrillar collagen trimer(GO:0005583) banded collagen fibril(GO:0098643) |
| 0.0 | 0.6 | GO:0005721 | pericentric heterochromatin(GO:0005721) |
| 0.0 | 0.3 | GO:0005852 | eukaryotic translation initiation factor 3 complex(GO:0005852) |
| 0.0 | 0.1 | GO:0005786 | signal recognition particle, endoplasmic reticulum targeting(GO:0005786) signal recognition particle(GO:0048500) |
Gene overrepresentation in molecular_function category:
| Log-likelihood per target | Total log-likelihood | Term | Description |
|---|---|---|---|
| 0.4 | 2.0 | GO:0016724 | ferroxidase activity(GO:0004322) oxidoreductase activity, oxidizing metal ions, oxygen as acceptor(GO:0016724) |
| 0.4 | 2.2 | GO:0001758 | retinal dehydrogenase activity(GO:0001758) |
| 0.2 | 1.3 | GO:0016936 | galactoside binding(GO:0016936) |
| 0.2 | 2.9 | GO:0070742 | C2H2 zinc finger domain binding(GO:0070742) |
| 0.2 | 0.8 | GO:0015501 | glutamate:sodium symporter activity(GO:0015501) |
| 0.1 | 1.0 | GO:0019788 | NEDD8 transferase activity(GO:0019788) |
| 0.1 | 1.2 | GO:0008395 | steroid hydroxylase activity(GO:0008395) |
| 0.1 | 0.7 | GO:0071074 | eukaryotic initiation factor eIF2 binding(GO:0071074) |
| 0.1 | 0.5 | GO:0004528 | phosphodiesterase I activity(GO:0004528) |
| 0.1 | 1.4 | GO:0004861 | cyclin-dependent protein serine/threonine kinase inhibitor activity(GO:0004861) |
| 0.1 | 0.8 | GO:0005519 | cytoskeletal regulatory protein binding(GO:0005519) |
| 0.1 | 0.3 | GO:0043758 | acetate-CoA ligase (ADP-forming) activity(GO:0043758) |
| 0.1 | 0.6 | GO:0043237 | laminin-1 binding(GO:0043237) |
| 0.1 | 3.4 | GO:0070888 | E-box binding(GO:0070888) |
| 0.1 | 0.2 | GO:0001851 | complement component C3b binding(GO:0001851) |
| 0.1 | 0.6 | GO:0004886 | 9-cis retinoic acid receptor activity(GO:0004886) |
| 0.1 | 0.4 | GO:0048101 | calcium- and calmodulin-regulated 3',5'-cyclic-GMP phosphodiesterase activity(GO:0048101) |
| 0.1 | 0.5 | GO:0050692 | DBD domain binding(GO:0050692) |
| 0.0 | 0.4 | GO:0070290 | N-acylphosphatidylethanolamine-specific phospholipase D activity(GO:0070290) |
| 0.0 | 0.1 | GO:0004942 | anaphylatoxin receptor activity(GO:0004942) |
| 0.0 | 0.1 | GO:0004813 | alanine-tRNA ligase activity(GO:0004813) |
| 0.0 | 0.1 | GO:0033883 | pyridoxal phosphatase activity(GO:0033883) |
| 0.0 | 2.0 | GO:0098811 | transcriptional activator activity, RNA polymerase II transcription factor binding(GO:0001190) transcriptional repressor activity, RNA polymerase II activating transcription factor binding(GO:0098811) |
| 0.0 | 2.0 | GO:0001102 | RNA polymerase II activating transcription factor binding(GO:0001102) |
| 0.0 | 0.1 | GO:0001639 | PLC activating G-protein coupled glutamate receptor activity(GO:0001639) |
| 0.0 | 0.5 | GO:0008430 | selenium binding(GO:0008430) |
| 0.0 | 0.2 | GO:0005451 | monovalent cation:proton antiporter activity(GO:0005451) sodium:proton antiporter activity(GO:0015385) potassium:proton antiporter activity(GO:0015386) |
| 0.0 | 0.6 | GO:1905030 | voltage-gated sodium channel activity(GO:0005248) voltage-gated ion channel activity involved in regulation of postsynaptic membrane potential(GO:1905030) |
| 0.0 | 0.5 | GO:0016909 | JUN kinase activity(GO:0004705) SAP kinase activity(GO:0016909) |
| 0.0 | 0.4 | GO:0051010 | microtubule plus-end binding(GO:0051010) |
| 0.0 | 0.2 | GO:0001094 | RNA polymerase II basal transcription factor binding(GO:0001091) TFIID-class transcription factor binding(GO:0001094) |
| 0.0 | 0.4 | GO:0004890 | GABA-A receptor activity(GO:0004890) |
| 0.0 | 0.3 | GO:0042556 | cobinamide kinase activity(GO:0008819) phytol kinase activity(GO:0010276) phenol kinase activity(GO:0018720) cyclin-dependent protein kinase activating kinase regulator activity(GO:0019914) inositol tetrakisphosphate 2-kinase activity(GO:0032942) heptose 7-phosphate kinase activity(GO:0033785) aminoglycoside phosphotransferase activity(GO:0034071) eukaryotic elongation factor-2 kinase regulator activity(GO:0042556) eukaryotic elongation factor-2 kinase activator activity(GO:0042557) LPPG:FO 2-phospho-L-lactate transferase activity(GO:0043743) cytidine kinase activity(GO:0043771) glycerate 2-kinase activity(GO:0043798) (S)-lactate 2-kinase activity(GO:0043841) phosphoserine:homoserine phosphotransferase activity(GO:0043899) L-seryl-tRNA(Sec) kinase activity(GO:0043915) phosphocholine transferase activity(GO:0044605) GTP-dependent polynucleotide kinase activity(GO:0051735) farnesol kinase activity(GO:0052668) CTP:2-trans,-6-trans-farnesol kinase activity(GO:0052669) geraniol kinase activity(GO:0052670) geranylgeraniol kinase activity(GO:0052671) CTP:geranylgeraniol kinase activity(GO:0052672) prenol kinase activity(GO:0052673) 1-phosphatidylinositol-5-kinase activity(GO:0052810) 1-phosphatidylinositol-3-phosphate 4-kinase activity(GO:0052811) phosphatidylinositol-3,4-bisphosphate 5-kinase activity(GO:0052812) inositol-3,4,6-trisphosphate 1-kinase activity(GO:0052835) inositol 5-diphosphate pentakisphosphate 5-kinase activity(GO:0052836) inositol diphosphate tetrakisphosphate kinase activity(GO:0052839) |
| 0.0 | 0.2 | GO:0070097 | delta-catenin binding(GO:0070097) |
| 0.0 | 0.6 | GO:0050136 | NADH dehydrogenase (ubiquinone) activity(GO:0008137) NADH dehydrogenase (quinone) activity(GO:0050136) |
| 0.0 | 0.7 | GO:0032452 | histone demethylase activity(GO:0032452) |
| 0.0 | 0.1 | GO:0030942 | endoplasmic reticulum signal peptide binding(GO:0030942) |
| 0.0 | 0.2 | GO:0070181 | small ribosomal subunit rRNA binding(GO:0070181) |
| 0.0 | 0.2 | GO:0005522 | profilin binding(GO:0005522) |
| 0.0 | 0.1 | GO:0001226 | RNA polymerase II transcription corepressor binding(GO:0001226) |
| 0.0 | 0.1 | GO:0071532 | ornithine decarboxylase inhibitor activity(GO:0008073) ankyrin repeat binding(GO:0071532) |
| 0.0 | 0.1 | GO:0030550 | acetylcholine receptor inhibitor activity(GO:0030550) |
| 0.0 | 0.1 | GO:0004724 | magnesium-dependent protein serine/threonine phosphatase activity(GO:0004724) |