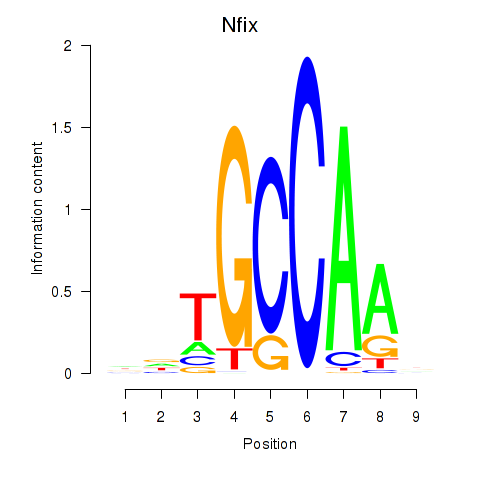
Motif ID: Nfix
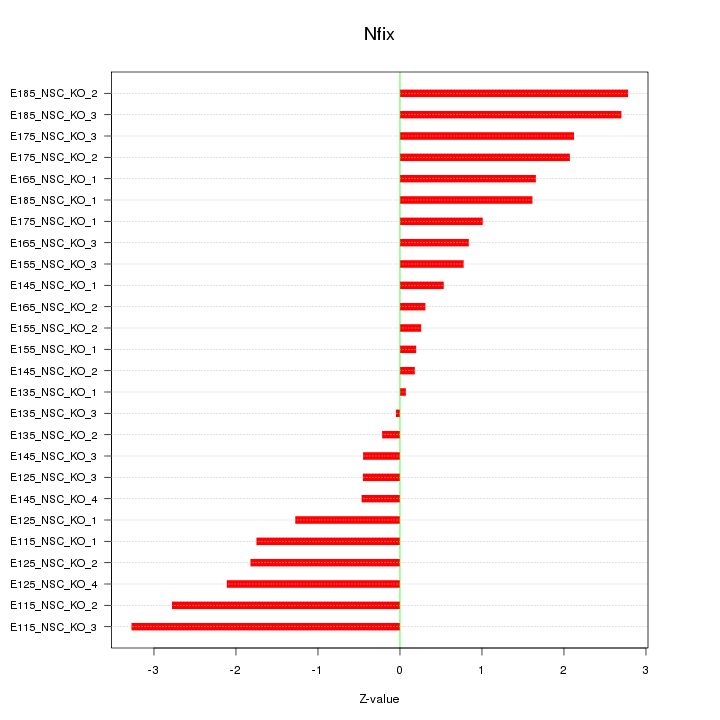
Z-value: 1.565
Transcription factors associated with Nfix:
| Gene Symbol | Entrez ID | Gene Name |
|---|---|---|
| Nfix | ENSMUSG00000001911.10 | Nfix |
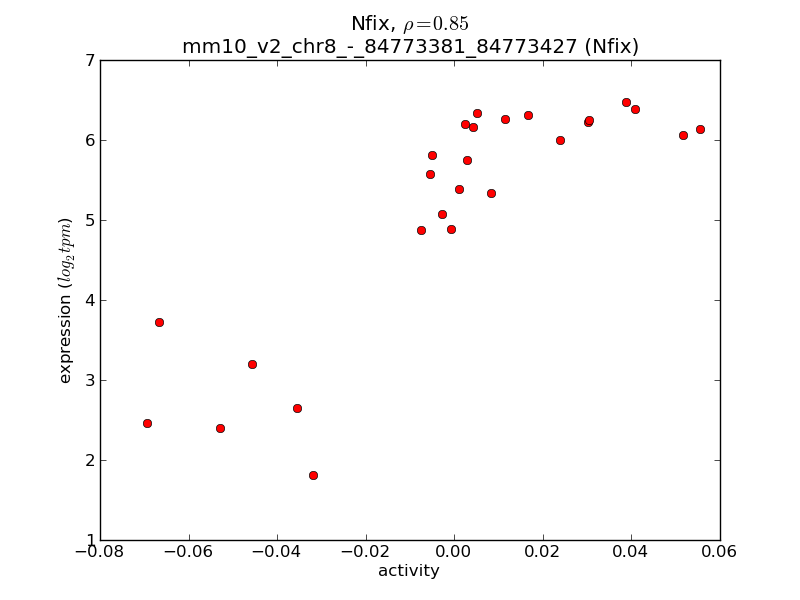
Activity-expression correlation:
| Gene Symbol | Promoter | Pearson corr. coef. | P-value | Plot |
|---|---|---|---|---|
| Nfix | mm10_v2_chr8_-_84773381_84773427 | 0.85 | 4.3e-08 | Click! |


Top targets:
Gene overrepresentation in biological_process category:
| Log-likelihood per target | Total log-likelihood | Term | Description |
|---|---|---|---|
| 2.5 | 7.4 | GO:0038095 | positive regulation of mast cell cytokine production(GO:0032765) Fc-epsilon receptor signaling pathway(GO:0038095) |
| 2.2 | 6.7 | GO:0007521 | muscle cell fate determination(GO:0007521) cellular response to parathyroid hormone stimulus(GO:0071374) positive regulation of macrophage apoptotic process(GO:2000111) |
| 1.8 | 18.2 | GO:0015721 | bile acid and bile salt transport(GO:0015721) |
| 1.6 | 9.6 | GO:0010624 | regulation of Schwann cell proliferation(GO:0010624) |
| 1.6 | 4.7 | GO:0014809 | regulation of skeletal muscle contraction by regulation of release of sequestered calcium ion(GO:0014809) |
| 1.3 | 6.6 | GO:0007403 | glial cell fate determination(GO:0007403) |
| 1.3 | 6.5 | GO:0042636 | negative regulation of hair cycle(GO:0042636) progesterone secretion(GO:0042701) negative regulation of hair follicle development(GO:0051799) positive regulation of ovulation(GO:0060279) |
| 1.2 | 7.4 | GO:0060718 | chorionic trophoblast cell differentiation(GO:0060718) |
| 1.1 | 6.6 | GO:0015840 | urea transport(GO:0015840) urea transmembrane transport(GO:0071918) |
| 1.0 | 6.2 | GO:1903056 | regulation of lens fiber cell differentiation(GO:1902746) positive regulation of lens fiber cell differentiation(GO:1902748) regulation of melanosome organization(GO:1903056) |
| 1.0 | 15.8 | GO:0021902 | commitment of neuronal cell to specific neuron type in forebrain(GO:0021902) |
| 0.9 | 3.6 | GO:1903966 | monounsaturated fatty acid metabolic process(GO:1903964) monounsaturated fatty acid biosynthetic process(GO:1903966) |
| 0.8 | 4.1 | GO:0015671 | oxygen transport(GO:0015671) |
| 0.6 | 1.8 | GO:1903054 | negative regulation of extracellular matrix organization(GO:1903054) |
| 0.6 | 1.7 | GO:0061588 | calcium activated phospholipid scrambling(GO:0061588) calcium activated phosphatidylserine scrambling(GO:0061589) calcium activated phosphatidylcholine scrambling(GO:0061590) calcium activated galactosylceramide scrambling(GO:0061591) |
| 0.6 | 4.0 | GO:0019532 | oxalate transport(GO:0019532) |
| 0.5 | 2.7 | GO:0051045 | negative regulation of membrane protein ectodomain proteolysis(GO:0051045) |
| 0.5 | 6.4 | GO:1904321 | response to forskolin(GO:1904321) cellular response to forskolin(GO:1904322) |
| 0.5 | 8.4 | GO:0060134 | prepulse inhibition(GO:0060134) |
| 0.4 | 5.8 | GO:1901898 | negative regulation of relaxation of muscle(GO:1901078) negative regulation of relaxation of cardiac muscle(GO:1901898) |
| 0.4 | 3.1 | GO:0016584 | nucleosome positioning(GO:0016584) |
| 0.4 | 2.2 | GO:0047484 | regulation of response to osmotic stress(GO:0047484) |
| 0.4 | 7.2 | GO:0032060 | bleb assembly(GO:0032060) |
| 0.4 | 2.5 | GO:0043415 | positive regulation of skeletal muscle tissue regeneration(GO:0043415) |
| 0.4 | 1.6 | GO:0019372 | lipoxygenase pathway(GO:0019372) |
| 0.4 | 1.6 | GO:0006668 | sphinganine-1-phosphate metabolic process(GO:0006668) |
| 0.4 | 1.2 | GO:0003289 | atrial septum primum morphogenesis(GO:0003289) noradrenergic neuron differentiation(GO:0003357) ascending aorta development(GO:0035905) ascending aorta morphogenesis(GO:0035910) |
| 0.4 | 10.2 | GO:0010866 | regulation of triglyceride biosynthetic process(GO:0010866) |
| 0.3 | 1.6 | GO:0030643 | cellular phosphate ion homeostasis(GO:0030643) cellular trivalent inorganic anion homeostasis(GO:0072502) |
| 0.3 | 1.2 | GO:1901475 | pyruvate transmembrane transport(GO:1901475) |
| 0.3 | 0.5 | GO:0003195 | tricuspid valve development(GO:0003175) tricuspid valve morphogenesis(GO:0003186) tricuspid valve formation(GO:0003195) |
| 0.3 | 1.0 | GO:0097167 | circadian regulation of translation(GO:0097167) |
| 0.2 | 4.5 | GO:0035020 | regulation of Rac protein signal transduction(GO:0035020) |
| 0.2 | 2.2 | GO:0036371 | protein localization to M-band(GO:0036309) protein localization to T-tubule(GO:0036371) |
| 0.2 | 4.8 | GO:0050650 | chondroitin sulfate proteoglycan biosynthetic process(GO:0050650) |
| 0.2 | 1.7 | GO:0051611 | negative regulation of neurotransmitter uptake(GO:0051581) serotonin uptake(GO:0051610) regulation of serotonin uptake(GO:0051611) negative regulation of serotonin uptake(GO:0051612) |
| 0.2 | 1.2 | GO:2000574 | regulation of microtubule motor activity(GO:2000574) |
| 0.2 | 0.9 | GO:2000211 | regulation of glutamate metabolic process(GO:2000211) |
| 0.2 | 0.8 | GO:0006049 | UDP-N-acetylglucosamine catabolic process(GO:0006049) |
| 0.2 | 7.3 | GO:0032728 | positive regulation of interferon-beta production(GO:0032728) |
| 0.2 | 1.4 | GO:0045200 | establishment or maintenance of neuroblast polarity(GO:0045196) establishment of neuroblast polarity(GO:0045200) |
| 0.2 | 4.8 | GO:0014829 | vascular smooth muscle contraction(GO:0014829) |
| 0.2 | 5.4 | GO:0000027 | ribosomal large subunit assembly(GO:0000027) |
| 0.2 | 1.5 | GO:0097460 | ferrous iron import into cell(GO:0097460) |
| 0.2 | 0.8 | GO:0038128 | ERBB2 signaling pathway(GO:0038128) |
| 0.2 | 1.5 | GO:0005513 | detection of calcium ion(GO:0005513) |
| 0.2 | 0.9 | GO:0070427 | nucleotide-binding oligomerization domain containing 1 signaling pathway(GO:0070427) |
| 0.2 | 4.7 | GO:0007214 | gamma-aminobutyric acid signaling pathway(GO:0007214) |
| 0.2 | 2.2 | GO:0002115 | store-operated calcium entry(GO:0002115) |
| 0.2 | 1.1 | GO:1904217 | regulation of CDP-diacylglycerol-serine O-phosphatidyltransferase activity(GO:1904217) positive regulation of CDP-diacylglycerol-serine O-phosphatidyltransferase activity(GO:1904219) regulation of serine C-palmitoyltransferase activity(GO:1904220) positive regulation of serine C-palmitoyltransferase activity(GO:1904222) |
| 0.1 | 0.7 | GO:0006689 | ganglioside catabolic process(GO:0006689) |
| 0.1 | 4.9 | GO:0061003 | positive regulation of dendritic spine morphogenesis(GO:0061003) |
| 0.1 | 2.3 | GO:0021860 | pyramidal neuron development(GO:0021860) |
| 0.1 | 2.1 | GO:0019369 | arachidonic acid metabolic process(GO:0019369) |
| 0.1 | 7.8 | GO:0002181 | cytoplasmic translation(GO:0002181) |
| 0.1 | 1.8 | GO:0045792 | negative regulation of cell size(GO:0045792) |
| 0.1 | 0.3 | GO:0097500 | receptor localization to nonmotile primary cilium(GO:0097500) |
| 0.1 | 5.1 | GO:0060612 | adipose tissue development(GO:0060612) |
| 0.1 | 0.3 | GO:1903441 | protein localization to ciliary membrane(GO:1903441) |
| 0.1 | 0.8 | GO:0036506 | maintenance of unfolded protein(GO:0036506) protein insertion into ER membrane(GO:0045048) tail-anchored membrane protein insertion into ER membrane(GO:0071816) maintenance of unfolded protein involved in ERAD pathway(GO:1904378) |
| 0.1 | 0.5 | GO:0045006 | DNA deamination(GO:0045006) |
| 0.1 | 2.4 | GO:0070306 | lens fiber cell differentiation(GO:0070306) |
| 0.1 | 1.1 | GO:0051894 | positive regulation of focal adhesion assembly(GO:0051894) |
| 0.1 | 1.6 | GO:0007095 | mitotic G2 DNA damage checkpoint(GO:0007095) |
| 0.1 | 1.2 | GO:0071378 | growth hormone receptor signaling pathway(GO:0060396) cellular response to growth hormone stimulus(GO:0071378) |
| 0.1 | 12.5 | GO:0031032 | actomyosin structure organization(GO:0031032) |
| 0.1 | 3.2 | GO:0045599 | negative regulation of fat cell differentiation(GO:0045599) |
| 0.1 | 0.6 | GO:0035898 | parathyroid hormone secretion(GO:0035898) |
| 0.1 | 0.9 | GO:0048520 | positive regulation of behavior(GO:0048520) |
| 0.1 | 0.6 | GO:0010457 | centriole-centriole cohesion(GO:0010457) |
| 0.1 | 1.8 | GO:0006024 | glycosaminoglycan biosynthetic process(GO:0006024) |
| 0.0 | 0.4 | GO:0046415 | urate metabolic process(GO:0046415) |
| 0.0 | 0.9 | GO:0044550 | secondary metabolite biosynthetic process(GO:0044550) |
| 0.0 | 2.9 | GO:0061077 | chaperone-mediated protein folding(GO:0061077) |
| 0.0 | 1.2 | GO:0036075 | endochondral ossification(GO:0001958) replacement ossification(GO:0036075) |
| 0.0 | 1.0 | GO:0035335 | peptidyl-tyrosine dephosphorylation(GO:0035335) |
| 0.0 | 3.7 | GO:0045834 | positive regulation of lipid metabolic process(GO:0045834) |
| 0.0 | 0.5 | GO:0050910 | detection of mechanical stimulus involved in sensory perception of sound(GO:0050910) |
| 0.0 | 0.8 | GO:0007340 | acrosome reaction(GO:0007340) |
| 0.0 | 0.6 | GO:0030500 | regulation of bone mineralization(GO:0030500) |
| 0.0 | 2.3 | GO:0010811 | positive regulation of cell-substrate adhesion(GO:0010811) |
| 0.0 | 0.8 | GO:0071480 | cellular response to gamma radiation(GO:0071480) |
| 0.0 | 0.2 | GO:0022028 | tangential migration from the subventricular zone to the olfactory bulb(GO:0022028) dorsal/ventral axon guidance(GO:0033563) |
| 0.0 | 0.8 | GO:1904030 | negative regulation of cyclin-dependent protein serine/threonine kinase activity(GO:0045736) negative regulation of cyclin-dependent protein kinase activity(GO:1904030) |
| 0.0 | 0.6 | GO:0044342 | type B pancreatic cell proliferation(GO:0044342) |
| 0.0 | 2.4 | GO:0007605 | sensory perception of sound(GO:0007605) |
| 0.0 | 0.2 | GO:0071225 | cellular response to muramyl dipeptide(GO:0071225) |
| 0.0 | 0.1 | GO:0034316 | negative regulation of Arp2/3 complex-mediated actin nucleation(GO:0034316) |
| 0.0 | 0.3 | GO:0043011 | myeloid dendritic cell differentiation(GO:0043011) |
| 0.0 | 0.5 | GO:0042462 | eye photoreceptor cell development(GO:0042462) |
| 0.0 | 0.4 | GO:0045648 | positive regulation of erythrocyte differentiation(GO:0045648) |
| 0.0 | 0.0 | GO:0060745 | prostate glandular acinus morphogenesis(GO:0060526) prostate epithelial cord arborization involved in prostate glandular acinus morphogenesis(GO:0060527) mammary gland branching involved in pregnancy(GO:0060745) |
| 0.0 | 1.2 | GO:0009063 | cellular amino acid catabolic process(GO:0009063) |
| 0.0 | 1.2 | GO:0014065 | phosphatidylinositol 3-kinase signaling(GO:0014065) |
| 0.0 | 0.1 | GO:0045896 | regulation of transcription during mitosis(GO:0045896) positive regulation of transcription during mitosis(GO:0045897) |
| 0.0 | 0.1 | GO:0048251 | elastic fiber assembly(GO:0048251) |
| 0.0 | 1.4 | GO:0019722 | calcium-mediated signaling(GO:0019722) |
| 0.0 | 0.1 | GO:0007253 | cytoplasmic sequestering of NF-kappaB(GO:0007253) |
| 0.0 | 1.1 | GO:0098792 | xenophagy(GO:0098792) |
Gene overrepresentation in cellular_component category:
| Log-likelihood per target | Total log-likelihood | Term | Description |
|---|---|---|---|
| 2.4 | 9.6 | GO:0097450 | astrocyte end-foot(GO:0097450) |
| 2.2 | 8.9 | GO:0031838 | haptoglobin-hemoglobin complex(GO:0031838) |
| 2.2 | 6.5 | GO:0043512 | inhibin A complex(GO:0043512) |
| 1.6 | 4.7 | GO:0014802 | terminal cisterna(GO:0014802) |
| 1.0 | 4.8 | GO:0030485 | smooth muscle contractile fiber(GO:0030485) |
| 0.9 | 4.7 | GO:0038039 | G-protein coupled receptor heterodimeric complex(GO:0038039) |
| 0.4 | 3.4 | GO:0097433 | dense body(GO:0097433) |
| 0.3 | 5.8 | GO:0000930 | gamma-tubulin complex(GO:0000930) |
| 0.2 | 4.6 | GO:0016327 | apicolateral plasma membrane(GO:0016327) |
| 0.2 | 13.4 | GO:0022625 | cytosolic large ribosomal subunit(GO:0022625) |
| 0.2 | 3.9 | GO:0043218 | compact myelin(GO:0043218) |
| 0.2 | 1.8 | GO:0031931 | TORC1 complex(GO:0031931) |
| 0.1 | 13.7 | GO:0000118 | histone deacetylase complex(GO:0000118) |
| 0.1 | 0.9 | GO:0034750 | Scrib-APC-beta-catenin complex(GO:0034750) |
| 0.1 | 0.8 | GO:0071818 | BAT3 complex(GO:0071818) ER membrane insertion complex(GO:0072379) |
| 0.1 | 1.1 | GO:0043083 | synaptic cleft(GO:0043083) |
| 0.1 | 1.5 | GO:0031045 | dense core granule(GO:0031045) |
| 0.1 | 4.1 | GO:0005790 | smooth endoplasmic reticulum(GO:0005790) |
| 0.1 | 3.7 | GO:0000315 | organellar large ribosomal subunit(GO:0000315) mitochondrial large ribosomal subunit(GO:0005762) |
| 0.1 | 2.2 | GO:0031430 | M band(GO:0031430) |
| 0.1 | 1.8 | GO:0005797 | Golgi medial cisterna(GO:0005797) |
| 0.1 | 1.9 | GO:0071565 | nBAF complex(GO:0071565) |
| 0.1 | 0.7 | GO:0042582 | primary lysosome(GO:0005766) azurophil granule(GO:0042582) |
| 0.1 | 2.9 | GO:0005834 | heterotrimeric G-protein complex(GO:0005834) |
| 0.1 | 3.6 | GO:0005791 | rough endoplasmic reticulum(GO:0005791) |
| 0.1 | 17.8 | GO:0031012 | extracellular matrix(GO:0031012) |
| 0.0 | 6.3 | GO:0016607 | nuclear speck(GO:0016607) |
| 0.0 | 3.1 | GO:0000786 | nucleosome(GO:0000786) |
| 0.0 | 0.3 | GO:0030991 | intraciliary transport particle A(GO:0030991) |
| 0.0 | 0.7 | GO:0033270 | paranode region of axon(GO:0033270) |
| 0.0 | 0.5 | GO:0035327 | transcriptionally active chromatin(GO:0035327) |
| 0.0 | 1.4 | GO:0014704 | intercalated disc(GO:0014704) |
| 0.0 | 9.8 | GO:0005911 | cell-cell junction(GO:0005911) |
| 0.0 | 24.7 | GO:0005887 | integral component of plasma membrane(GO:0005887) |
| 0.0 | 1.2 | GO:0045121 | membrane raft(GO:0045121) membrane microdomain(GO:0098857) |
| 0.0 | 1.8 | GO:0005905 | clathrin-coated pit(GO:0005905) |
| 0.0 | 2.1 | GO:0031225 | anchored component of membrane(GO:0031225) |
| 0.0 | 2.2 | GO:0005814 | centriole(GO:0005814) |
| 0.0 | 0.4 | GO:0002102 | podosome(GO:0002102) |
| 0.0 | 2.1 | GO:0031227 | intrinsic component of endoplasmic reticulum membrane(GO:0031227) |
| 0.0 | 1.0 | GO:0031463 | Cul3-RING ubiquitin ligase complex(GO:0031463) |
| 0.0 | 0.4 | GO:0005685 | U1 snRNP(GO:0005685) |
| 0.0 | 2.9 | GO:0005789 | endoplasmic reticulum membrane(GO:0005789) |
| 0.0 | 0.5 | GO:0001750 | photoreceptor outer segment(GO:0001750) |
| 0.0 | 2.4 | GO:0014069 | postsynaptic density(GO:0014069) postsynaptic specialization(GO:0099572) |
| 0.0 | 2.3 | GO:0045202 | synapse(GO:0045202) |
| 0.0 | 4.7 | GO:0036477 | somatodendritic compartment(GO:0036477) |
Gene overrepresentation in molecular_function category:
| Log-likelihood per target | Total log-likelihood | Term | Description |
|---|---|---|---|
| 4.6 | 18.2 | GO:0015349 | thyroid hormone transmembrane transporter activity(GO:0015349) |
| 2.2 | 8.9 | GO:0031721 | haptoglobin binding(GO:0031720) hemoglobin alpha binding(GO:0031721) |
| 1.6 | 4.9 | GO:0004686 | elongation factor-2 kinase activity(GO:0004686) |
| 1.4 | 4.1 | GO:0005344 | oxygen transporter activity(GO:0005344) |
| 1.3 | 6.6 | GO:0005166 | neurotrophin p75 receptor binding(GO:0005166) |
| 1.1 | 6.6 | GO:0015265 | urea channel activity(GO:0015265) |
| 1.1 | 6.4 | GO:0070699 | type II activin receptor binding(GO:0070699) |
| 0.9 | 3.6 | GO:0032896 | palmitoyl-CoA 9-desaturase activity(GO:0032896) |
| 0.8 | 4.8 | GO:0015018 | galactosylgalactosylxylosylprotein 3-beta-glucuronosyltransferase activity(GO:0015018) |
| 0.8 | 2.4 | GO:0001716 | L-amino-acid oxidase activity(GO:0001716) |
| 0.8 | 4.7 | GO:0004965 | G-protein coupled GABA receptor activity(GO:0004965) |
| 0.6 | 6.7 | GO:0003680 | AT DNA binding(GO:0003680) |
| 0.5 | 3.4 | GO:0015091 | ferric iron transmembrane transporter activity(GO:0015091) trivalent inorganic cation transmembrane transporter activity(GO:0072510) |
| 0.5 | 7.4 | GO:0001223 | transcription coactivator binding(GO:0001223) |
| 0.4 | 3.6 | GO:0005004 | GPI-linked ephrin receptor activity(GO:0005004) |
| 0.4 | 2.1 | GO:0008392 | arachidonic acid monooxygenase activity(GO:0008391) arachidonic acid epoxygenase activity(GO:0008392) |
| 0.4 | 2.9 | GO:0031821 | G-protein coupled serotonin receptor binding(GO:0031821) |
| 0.4 | 4.0 | GO:0019531 | oxalate transmembrane transporter activity(GO:0019531) |
| 0.3 | 7.4 | GO:0005520 | insulin-like growth factor binding(GO:0005520) |
| 0.3 | 1.2 | GO:0050833 | pyruvate transmembrane transporter activity(GO:0050833) |
| 0.3 | 1.8 | GO:0008499 | UDP-galactose:beta-N-acetylglucosamine beta-1,3-galactosyltransferase activity(GO:0008499) |
| 0.3 | 1.4 | GO:0097322 | 7SK snRNA binding(GO:0097322) |
| 0.2 | 1.2 | GO:0008269 | JAK pathway signal transduction adaptor activity(GO:0008269) |
| 0.2 | 0.7 | GO:0035614 | snRNA stem-loop binding(GO:0035614) |
| 0.2 | 0.8 | GO:0003827 | alpha-1,3-mannosylglycoprotein 2-beta-N-acetylglucosaminyltransferase activity(GO:0003827) |
| 0.2 | 6.2 | GO:0070412 | R-SMAD binding(GO:0070412) |
| 0.2 | 2.7 | GO:0008191 | metalloendopeptidase inhibitor activity(GO:0008191) |
| 0.2 | 1.6 | GO:0001618 | virus receptor activity(GO:0001618) |
| 0.2 | 3.3 | GO:0008599 | protein phosphatase type 1 regulator activity(GO:0008599) |
| 0.2 | 7.6 | GO:0005504 | fatty acid binding(GO:0005504) |
| 0.2 | 2.2 | GO:0015279 | store-operated calcium channel activity(GO:0015279) |
| 0.2 | 1.7 | GO:0005229 | intracellular calcium activated chloride channel activity(GO:0005229) |
| 0.1 | 0.7 | GO:0004563 | beta-N-acetylhexosaminidase activity(GO:0004563) |
| 0.1 | 5.8 | GO:0043015 | gamma-tubulin binding(GO:0043015) |
| 0.1 | 8.8 | GO:0005200 | structural constituent of cytoskeleton(GO:0005200) |
| 0.1 | 0.4 | GO:0015143 | urate transmembrane transporter activity(GO:0015143) salt transmembrane transporter activity(GO:1901702) |
| 0.1 | 2.2 | GO:0008093 | cytoskeletal adaptor activity(GO:0008093) |
| 0.1 | 2.9 | GO:0005528 | macrolide binding(GO:0005527) FK506 binding(GO:0005528) |
| 0.1 | 3.9 | GO:0017017 | MAP kinase tyrosine/serine/threonine phosphatase activity(GO:0017017) |
| 0.1 | 0.9 | GO:0052872 | 3-(3-hydroxyphenyl)propionate hydroxylase activity(GO:0008688) 4-chlorobenzaldehyde oxidase activity(GO:0018471) 3,5-xylenol methylhydroxylase activity(GO:0018630) phenylacetate hydroxylase activity(GO:0018631) 4-nitrophenol 4-monooxygenase activity(GO:0018632) dimethyl sulfide monooxygenase activity(GO:0018633) alpha-pinene monooxygenase [NADH] activity(GO:0018634) phenanthrene 9,10-monooxygenase activity(GO:0018636) 1-hydroxy-2-naphthoate hydroxylase activity(GO:0018637) toluene 4-monooxygenase activity(GO:0018638) xylene monooxygenase activity(GO:0018639) dibenzothiophene monooxygenase activity(GO:0018640) 6-hydroxy-3-methyl-2-oxo-1,2-dihydroquinoline 6-monooxygenase activity(GO:0018641) chlorophenol 4-monooxygenase activity(GO:0018642) carbon disulfide oxygenase activity(GO:0018643) toluene 2-monooxygenase activity(GO:0018644) 1-hydroxy-2-oxolimonene 1,2-monooxygenase activity(GO:0018646) phenanthrene 1,2-monooxygenase activity(GO:0018647) tetrahydrofuran hydroxylase activity(GO:0018649) styrene monooxygenase activity(GO:0018650) toluene-4-sulfonate monooxygenase activity(GO:0018651) toluene-sulfonate methyl-monooxygenase activity(GO:0018652) 3-methyl-2-oxo-1,2-dihydroquinoline 6-monooxygenase activity(GO:0018653) 2-hydroxy-phenylacetate hydroxylase activity(GO:0018654) 2-oxo-delta3-4,5,5-trimethylcyclopentenylacetyl-CoA 1,2-monooxygenase activity(GO:0018655) phenanthrene 3,4-monooxygenase activity(GO:0018656) toluene 3-monooxygenase activity(GO:0018657) 4-hydroxyphenylacetate,NADH:oxygen oxidoreductase (3-hydroxylating) activity(GO:0018660) limonene monooxygenase activity(GO:0019113) 2-methylnaphthalene hydroxylase activity(GO:0034526) 1-methylnaphthalene hydroxylase activity(GO:0034534) bisphenol A hydroxylase A activity(GO:0034560) salicylate 5-hydroxylase activity(GO:0034785) isobutylamine N-hydroxylase activity(GO:0034791) branched-chain dodecylbenzene sulfonate monooxygenase activity(GO:0034802) 3-HSA hydroxylase activity(GO:0034819) 4-hydroxypyridine-3-hydroxylase activity(GO:0034894) 2-octaprenyl-3-methyl-6-methoxy-1,4-benzoquinol hydroxylase activity(GO:0043719) 6-hydroxynicotinate 3-monooxygenase activity(GO:0043731) tocotrienol omega-hydroxylase activity(GO:0052872) thalianol hydroxylase activity(GO:0080014) |
| 0.1 | 2.3 | GO:0009931 | calcium-dependent protein serine/threonine kinase activity(GO:0009931) |
| 0.1 | 2.9 | GO:0005201 | extracellular matrix structural constituent(GO:0005201) |
| 0.1 | 1.1 | GO:0022889 | L-serine transmembrane transporter activity(GO:0015194) serine transmembrane transporter activity(GO:0022889) |
| 0.1 | 3.8 | GO:0004712 | protein serine/threonine/tyrosine kinase activity(GO:0004712) |
| 0.1 | 0.6 | GO:0005519 | cytoskeletal regulatory protein binding(GO:0005519) |
| 0.1 | 1.3 | GO:0004435 | phosphatidylinositol phospholipase C activity(GO:0004435) |
| 0.1 | 0.9 | GO:0051010 | microtubule plus-end binding(GO:0051010) |
| 0.1 | 1.5 | GO:0017075 | syntaxin-1 binding(GO:0017075) low-density lipoprotein particle receptor binding(GO:0050750) |
| 0.1 | 3.2 | GO:0030971 | receptor tyrosine kinase binding(GO:0030971) |
| 0.1 | 14.1 | GO:0003735 | structural constituent of ribosome(GO:0003735) |
| 0.1 | 1.1 | GO:0005044 | scavenger receptor activity(GO:0005044) |
| 0.0 | 1.4 | GO:0043014 | alpha-tubulin binding(GO:0043014) |
| 0.0 | 0.7 | GO:0034450 | ubiquitin-ubiquitin ligase activity(GO:0034450) |
| 0.0 | 0.8 | GO:0070628 | proteasome binding(GO:0070628) ubiquitin-specific protease binding(GO:1990381) |
| 0.0 | 0.3 | GO:0045703 | pinocarveol dehydrogenase activity(GO:0018446) chloral hydrate dehydrogenase activity(GO:0018447) hydroxymethylmethylsilanediol oxidase activity(GO:0018448) 1-phenylethanol dehydrogenase activity(GO:0018449) myrtenol dehydrogenase activity(GO:0018450) cis-1,2-dihydroxy-1,2-dihydro-8-carboxynaphthalene dehydrogenase activity(GO:0034522) 3-hydroxy-4-methyloctanoyl-CoA dehydrogenase activity(GO:0034582) 2-hydroxy-4-isopropenylcyclohexane-1-carboxyl-CoA dehydrogenase activity(GO:0034778) cis-9,10-dihydroanthracene-9,10-diol dehydrogenase activity(GO:0034817) citronellol dehydrogenase activity(GO:0034821) naphthyl-2-hydroxymethyl-succinyl-CoA dehydrogenase activity(GO:0034847) 2,4,4-trimethyl-1-pentanol dehydrogenase activity(GO:0034863) 2,4,4-trimethyl-3-hydroxypentanoyl-CoA dehydrogenase activity(GO:0034868) 1-hydroxy-4,4-dimethylpentan-3-one dehydrogenase activity(GO:0034871) endosulfan diol dehydrogenase activity(GO:0034891) endosulfan hydroxyether dehydrogenase activity(GO:0034901) 3-hydroxy-2-methylhexanoyl-CoA dehydrogenase activity(GO:0034918) 3-hydroxy-2,6-dimethyl-5-methylene-heptanoyl-CoA dehydrogenase activity(GO:0034944) versicolorin reductase activity(GO:0042469) ketoreductase activity(GO:0045703) |
| 0.0 | 1.4 | GO:0048487 | beta-tubulin binding(GO:0048487) |
| 0.0 | 3.4 | GO:0008565 | protein transporter activity(GO:0008565) |
| 0.0 | 0.3 | GO:0031749 | D2 dopamine receptor binding(GO:0031749) |
| 0.0 | 0.9 | GO:0008139 | nuclear localization sequence binding(GO:0008139) |
| 0.0 | 1.7 | GO:0005518 | collagen binding(GO:0005518) |
| 0.0 | 1.0 | GO:0070888 | E-box binding(GO:0070888) |
| 0.0 | 0.2 | GO:0048495 | Roundabout binding(GO:0048495) |
| 0.0 | 0.1 | GO:0034739 | histone deacetylase activity (H4-K16 specific)(GO:0034739) |
| 0.0 | 0.3 | GO:0005035 | tumor necrosis factor-activated receptor activity(GO:0005031) death receptor activity(GO:0005035) |
| 0.0 | 6.6 | GO:0003779 | actin binding(GO:0003779) |
| 0.0 | 0.9 | GO:0003707 | steroid hormone receptor activity(GO:0003707) |
| 0.0 | 0.4 | GO:0045502 | dynein binding(GO:0045502) |
| 0.0 | 0.6 | GO:0005262 | calcium channel activity(GO:0005262) |
| 0.0 | 0.7 | GO:0003777 | microtubule motor activity(GO:0003777) |