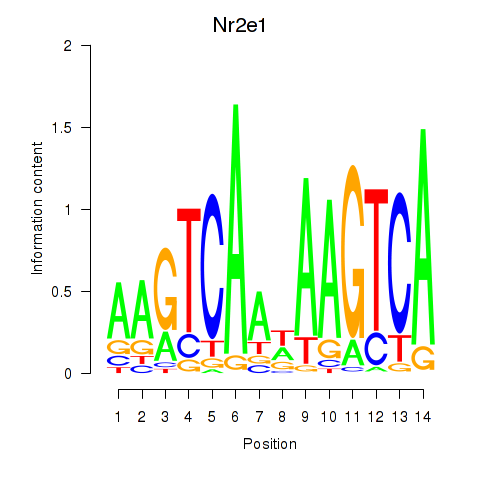
|
chr4_+_33924632
|
0.678
|
ENSMUST00000057188.6
|
Cnr1
|
cannabinoid receptor 1 (brain)
|
|
chr4_+_32238950
|
0.271
|
ENSMUST00000037416.6
|
Bach2
|
BTB and CNC homology 2
|
|
chr3_+_26331150
|
0.198
|
ENSMUST00000099182.2
|
A830092H15Rik
|
RIKEN cDNA A830092H15 gene
|
|
chr2_-_73386396
|
0.179
|
ENSMUST00000112044.1
ENSMUST00000112043.1
ENSMUST00000076463.5
|
Gpr155
|
G protein-coupled receptor 155
|
|
chr14_+_32028989
|
0.155
|
ENSMUST00000022460.4
|
Galnt15
|
UDP-N-acetyl-alpha-D-galactosamine:polypeptide N-acetylgalactosaminyltransferase 15
|
|
chrX_-_139998519
|
0.143
|
ENSMUST00000113007.1
ENSMUST00000033810.7
ENSMUST00000113011.2
ENSMUST00000087400.5
|
Rbm41
|
RNA binding motif protein 41
|
|
chr4_-_63403330
|
0.138
|
ENSMUST00000035724.4
|
Akna
|
AT-hook transcription factor
|
|
chr9_-_71163224
|
0.112
|
ENSMUST00000074465.2
|
Aqp9
|
aquaporin 9
|
|
chr10_+_18469958
|
0.111
|
ENSMUST00000162891.1
ENSMUST00000100054.3
|
Nhsl1
|
NHS-like 1
|
|
chr4_-_35845204
|
0.097
|
ENSMUST00000164772.1
ENSMUST00000065173.2
|
Lingo2
|
leucine rich repeat and Ig domain containing 2
|
|
chr15_+_41830921
|
0.084
|
ENSMUST00000166917.1
|
Oxr1
|
oxidation resistance 1
|
|
chr15_-_10485385
|
0.071
|
ENSMUST00000168690.1
|
Brix1
|
BRX1, biogenesis of ribosomes, homolog (S. cerevisiae)
|
|
chrX_-_95658379
|
0.071
|
ENSMUST00000119640.1
|
Zc4h2
|
zinc finger, C4H2 domain containing
|
|
chr2_-_23040137
|
0.071
|
ENSMUST00000091394.6
ENSMUST00000093171.6
|
Abi1
|
abl-interactor 1
|
|
chr7_-_80405425
|
0.057
|
ENSMUST00000107362.3
ENSMUST00000135306.1
|
Furin
|
furin (paired basic amino acid cleaving enzyme)
|
|
chr2_-_23040177
|
0.057
|
ENSMUST00000114544.3
ENSMUST00000139038.1
ENSMUST00000126112.1
ENSMUST00000178908.1
ENSMUST00000078977.7
ENSMUST00000140164.1
ENSMUST00000149719.1
|
Abi1
|
abl-interactor 1
|
|
chrX_-_95658392
|
0.053
|
ENSMUST00000120620.1
|
Zc4h2
|
zinc finger, C4H2 domain containing
|
|
chrX_-_95658416
|
0.050
|
ENSMUST00000044382.6
|
Zc4h2
|
zinc finger, C4H2 domain containing
|
|
chr8_+_36489191
|
0.049
|
ENSMUST00000171777.1
|
6430573F11Rik
|
RIKEN cDNA 6430573F11 gene
|
|
chr15_-_10485890
|
0.048
|
ENSMUST00000169050.1
ENSMUST00000022855.5
|
Brix1
|
BRX1, biogenesis of ribosomes, homolog (S. cerevisiae)
|
|
chrX_-_143827391
|
0.047
|
ENSMUST00000087316.5
|
Capn6
|
calpain 6
|
|
chr8_-_61902669
|
0.046
|
ENSMUST00000121785.1
ENSMUST00000034057.7
|
Palld
|
palladin, cytoskeletal associated protein
|
|
chr4_+_28813152
|
0.041
|
ENSMUST00000108194.2
ENSMUST00000108191.1
|
Epha7
|
Eph receptor A7
|
|
chr12_+_111166485
|
0.041
|
ENSMUST00000139162.1
|
Traf3
|
TNF receptor-associated factor 3
|
|
chr2_-_23040092
|
0.036
|
ENSMUST00000153931.1
ENSMUST00000123948.1
|
Abi1
|
abl-interactor 1
|
|
chr1_-_132390301
|
0.033
|
ENSMUST00000132435.1
|
Tmcc2
|
transmembrane and coiled-coil domains 2
|
|
chr4_+_28813125
|
0.024
|
ENSMUST00000029964.5
ENSMUST00000080934.4
|
Epha7
|
Eph receptor A7
|
|
chr6_-_126939524
|
0.024
|
ENSMUST00000144954.1
ENSMUST00000112221.1
ENSMUST00000112220.1
|
Rad51ap1
|
RAD51 associated protein 1
|
|
chr1_-_53785214
|
0.014
|
ENSMUST00000027263.7
|
Stk17b
|
serine/threonine kinase 17b (apoptosis-inducing)
|
|
chr12_+_111166349
|
0.013
|
ENSMUST00000117269.1
|
Traf3
|
TNF receptor-associated factor 3
|
|
chr12_+_111166413
|
0.012
|
ENSMUST00000021706.4
|
Traf3
|
TNF receptor-associated factor 3
|
|
chr15_-_97705787
|
0.011
|
ENSMUST00000023104.5
|
Rpap3
|
RNA polymerase II associated protein 3
|
|
chr4_+_136347286
|
0.011
|
ENSMUST00000140052.2
|
9130020K20Rik
|
RIKEN cDNA 9130020K20 gene
|
|
chr9_-_42457594
|
0.005
|
ENSMUST00000125995.1
|
Tbcel
|
tubulin folding cofactor E-like
|
|
chrM_+_7005
|
0.005
|
ENSMUST00000082405.1
|
mt-Co2
|
mitochondrially encoded cytochrome c oxidase II
|
|
chr5_-_88527841
|
0.003
|
ENSMUST00000087033.3
|
Igj
|
immunoglobulin joining chain
|


