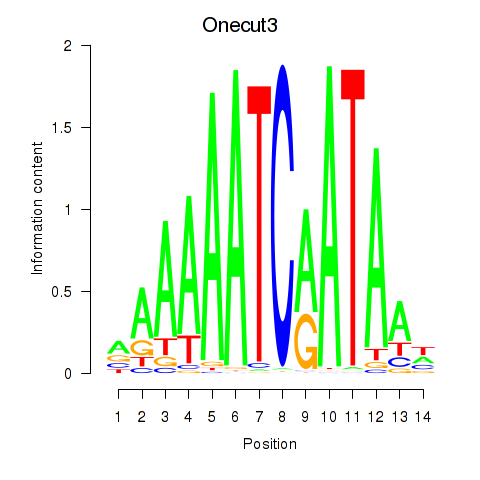
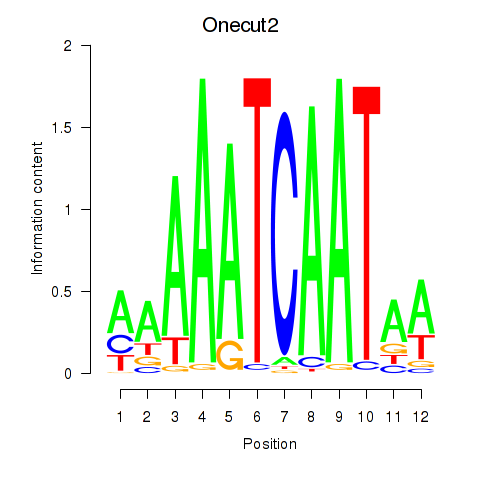
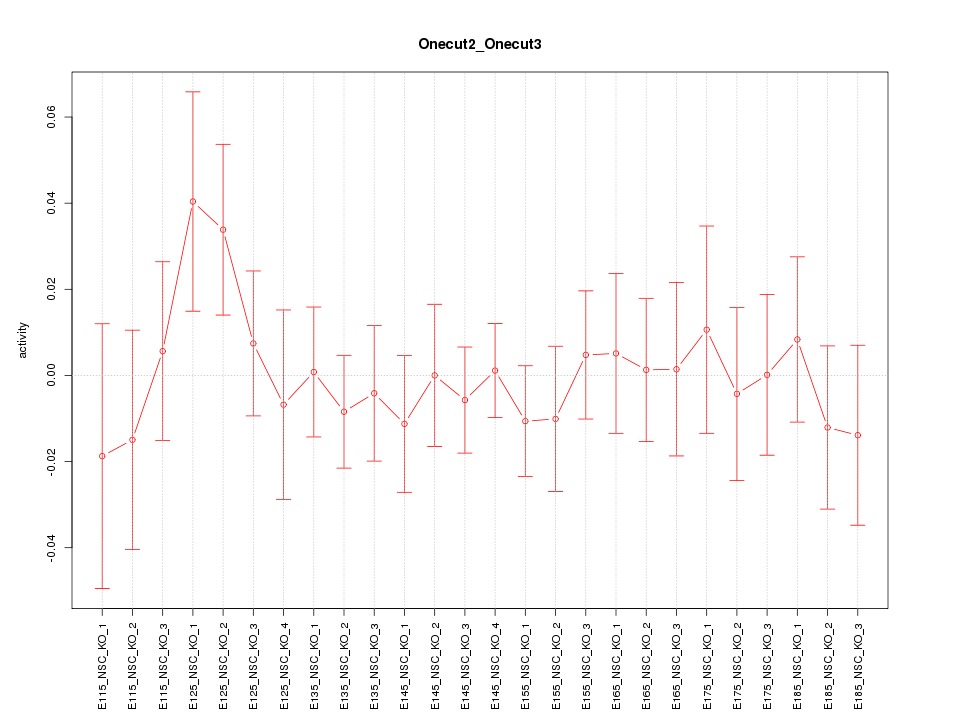
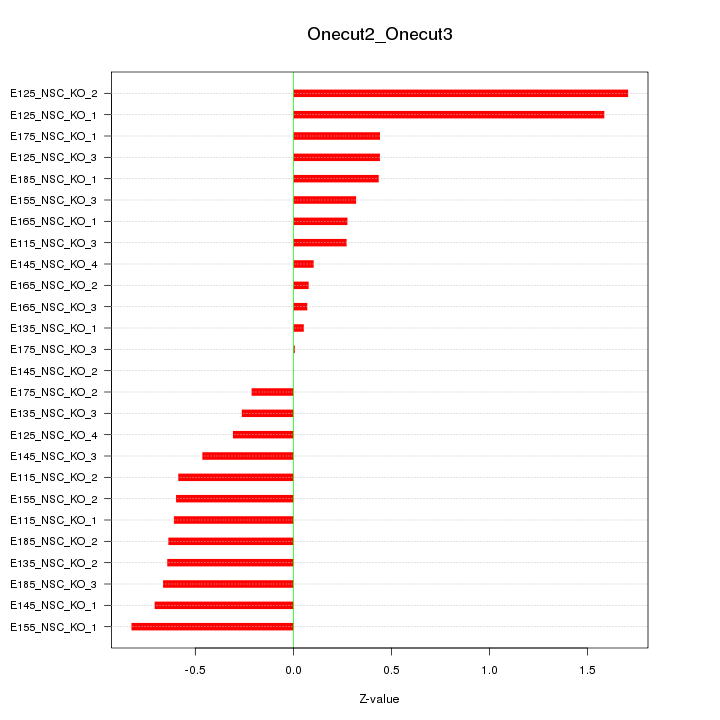
Motif ID: Onecut2_Onecut3
Z-value: 0.627
Transcription factors associated with Onecut2_Onecut3:
| Gene Symbol | Entrez ID | Gene Name |
|---|---|---|
| Onecut2 | ENSMUSG00000045991.12 | Onecut2 |
| Onecut3 | ENSMUSG00000045518.8 | Onecut3 |
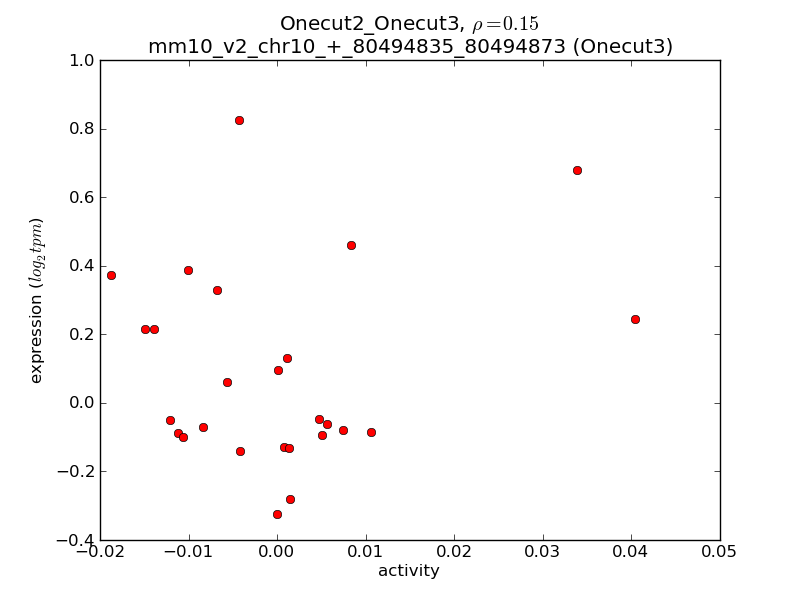
Activity-expression correlation:
| Gene Symbol | Promoter | Pearson corr. coef. | P-value | Plot |
|---|---|---|---|---|
| Onecut2 | mm10_v2_chr18_+_64340225_64340364 | 0.45 | 2.0e-02 | Click! |
| Onecut3 | mm10_v2_chr10_+_80494835_80494873 | 0.15 | 4.7e-01 | Click! |

Top targets:
Gene overrepresentation in biological_process category:
| Log-likelihood per target | Total log-likelihood | Term | Description |
|---|---|---|---|
| 0.9 | 2.8 | GO:0045014 | detection of carbohydrate stimulus(GO:0009730) detection of hexose stimulus(GO:0009732) detection of monosaccharide stimulus(GO:0034287) carbon catabolite repression of transcription(GO:0045013) negative regulation of transcription by glucose(GO:0045014) detection of glucose(GO:0051594) |
| 0.4 | 3.5 | GO:0048625 | myoblast fate commitment(GO:0048625) |
| 0.3 | 3.8 | GO:0010650 | positive regulation of cell communication by electrical coupling(GO:0010650) positive regulation of membrane depolarization during cardiac muscle cell action potential(GO:1900827) |
| 0.3 | 1.9 | GO:0021797 | forebrain anterior/posterior pattern specification(GO:0021797) |
| 0.3 | 4.7 | GO:0021521 | ventral spinal cord interneuron specification(GO:0021521) cell fate specification involved in pattern specification(GO:0060573) |
| 0.2 | 0.5 | GO:0001830 | trophectodermal cell fate commitment(GO:0001830) |
| 0.1 | 0.6 | GO:0019919 | peptidyl-arginine methylation, to asymmetrical-dimethyl arginine(GO:0019919) |
| 0.1 | 0.5 | GO:0060715 | syncytiotrophoblast cell differentiation involved in labyrinthine layer development(GO:0060715) |
| 0.1 | 1.1 | GO:2001214 | positive regulation of vasculogenesis(GO:2001214) |
| 0.1 | 0.3 | GO:0038165 | oncostatin-M-mediated signaling pathway(GO:0038165) regulation of interleukin-6-mediated signaling pathway(GO:0070103) negative regulation of interleukin-6-mediated signaling pathway(GO:0070104) |
| 0.1 | 0.9 | GO:0038028 | insulin receptor signaling pathway via phosphatidylinositol 3-kinase(GO:0038028) |
| 0.1 | 1.1 | GO:0097421 | liver regeneration(GO:0097421) |
| 0.1 | 0.4 | GO:0090238 | positive regulation of arachidonic acid secretion(GO:0090238) |
| 0.1 | 2.1 | GO:0008340 | determination of adult lifespan(GO:0008340) |
| 0.1 | 0.2 | GO:0070543 | response to linoleic acid(GO:0070543) |
| 0.1 | 0.3 | GO:0097116 | gephyrin clustering involved in postsynaptic density assembly(GO:0097116) |
| 0.1 | 0.2 | GO:0030210 | heparin biosynthetic process(GO:0030210) Tie signaling pathway(GO:0048014) |
| 0.1 | 0.3 | GO:0008655 | pyrimidine-containing compound salvage(GO:0008655) pyrimidine nucleoside salvage(GO:0043097) |
| 0.0 | 0.4 | GO:0016081 | synaptic vesicle docking(GO:0016081) |
| 0.0 | 0.4 | GO:0051152 | positive regulation of smooth muscle cell differentiation(GO:0051152) |
| 0.0 | 0.2 | GO:0097118 | neuroligin clustering involved in postsynaptic membrane assembly(GO:0097118) |
| 0.0 | 0.4 | GO:1903847 | regulation of aorta morphogenesis(GO:1903847) positive regulation of aorta morphogenesis(GO:1903849) |
| 0.0 | 0.2 | GO:0018343 | protein farnesylation(GO:0018343) |
| 0.0 | 0.1 | GO:0097309 | cap1 mRNA methylation(GO:0097309) |
| 0.0 | 0.2 | GO:0046684 | response to pyrethroid(GO:0046684) |
| 0.0 | 0.6 | GO:0033690 | positive regulation of osteoblast proliferation(GO:0033690) |
| 0.0 | 0.4 | GO:0048681 | negative regulation of axon regeneration(GO:0048681) |
| 0.0 | 0.1 | GO:0019478 | D-amino acid catabolic process(GO:0019478) |
| 0.0 | 1.2 | GO:0007617 | mating behavior(GO:0007617) multi-organism reproductive behavior(GO:0044705) |
| 0.0 | 0.3 | GO:0010587 | miRNA catabolic process(GO:0010587) |
| 0.0 | 0.5 | GO:0051764 | actin crosslink formation(GO:0051764) |
| 0.0 | 0.9 | GO:1901522 | positive regulation of transcription from RNA polymerase II promoter involved in cellular response to chemical stimulus(GO:1901522) |
| 0.0 | 0.2 | GO:0006680 | glucosylceramide catabolic process(GO:0006680) |
| 0.0 | 0.2 | GO:1901727 | positive regulation of histone deacetylase activity(GO:1901727) |
| 0.0 | 0.1 | GO:1900028 | negative regulation of ruffle assembly(GO:1900028) |
| 0.0 | 0.1 | GO:1902071 | regulation of hypoxia-inducible factor-1alpha signaling pathway(GO:1902071) |
| 0.0 | 0.1 | GO:0002430 | complement receptor mediated signaling pathway(GO:0002430) |
| 0.0 | 1.1 | GO:0045744 | negative regulation of G-protein coupled receptor protein signaling pathway(GO:0045744) |
| 0.0 | 0.3 | GO:0048813 | dendrite morphogenesis(GO:0048813) |
| 0.0 | 0.1 | GO:0033353 | S-adenosylmethionine cycle(GO:0033353) |
| 0.0 | 0.4 | GO:0045063 | T-helper 1 cell differentiation(GO:0045063) |
| 0.0 | 0.0 | GO:0006788 | heme oxidation(GO:0006788) |
| 0.0 | 0.1 | GO:0006004 | fucose metabolic process(GO:0006004) glycoside catabolic process(GO:0016139) |
| 0.0 | 0.1 | GO:0045541 | negative regulation of cholesterol biosynthetic process(GO:0045541) negative regulation of cholesterol metabolic process(GO:0090206) |
| 0.0 | 0.2 | GO:0000380 | alternative mRNA splicing, via spliceosome(GO:0000380) |
| 0.0 | 0.1 | GO:0030432 | peristalsis(GO:0030432) |
| 0.0 | 0.1 | GO:0010825 | positive regulation of centrosome duplication(GO:0010825) |
Gene overrepresentation in cellular_component category:
| Log-likelihood per target | Total log-likelihood | Term | Description |
|---|---|---|---|
| 0.4 | 3.5 | GO:0070369 | beta-catenin-TCF7L2 complex(GO:0070369) |
| 0.3 | 1.1 | GO:0031466 | Cul5-RING ubiquitin ligase complex(GO:0031466) |
| 0.2 | 1.1 | GO:0048237 | rough endoplasmic reticulum lumen(GO:0048237) |
| 0.2 | 3.8 | GO:0014731 | spectrin-associated cytoskeleton(GO:0014731) |
| 0.1 | 0.3 | GO:0005896 | interleukin-6 receptor complex(GO:0005896) |
| 0.1 | 1.0 | GO:0030285 | integral component of synaptic vesicle membrane(GO:0030285) intrinsic component of synaptic vesicle membrane(GO:0098563) |
| 0.1 | 0.5 | GO:0060293 | P granule(GO:0043186) pole plasm(GO:0045495) germ plasm(GO:0060293) |
| 0.1 | 0.2 | GO:0014802 | terminal cisterna(GO:0014802) |
| 0.1 | 0.2 | GO:0005965 | protein farnesyltransferase complex(GO:0005965) |
| 0.0 | 0.2 | GO:0043202 | lysosomal lumen(GO:0043202) |
| 0.0 | 0.2 | GO:0036056 | filtration diaphragm(GO:0036056) slit diaphragm(GO:0036057) |
| 0.0 | 0.5 | GO:0016327 | apicolateral plasma membrane(GO:0016327) |
| 0.0 | 0.2 | GO:0019773 | proteasome core complex, alpha-subunit complex(GO:0019773) |
| 0.0 | 0.2 | GO:0034706 | voltage-gated sodium channel complex(GO:0001518) sodium channel complex(GO:0034706) |
| 0.0 | 0.1 | GO:0035867 | alphav-beta3 integrin-IGF-1-IGF1R complex(GO:0035867) |
| 0.0 | 0.5 | GO:0031941 | filamentous actin(GO:0031941) |
Gene overrepresentation in molecular_function category:
| Log-likelihood per target | Total log-likelihood | Term | Description |
|---|---|---|---|
| 0.1 | 0.5 | GO:0035374 | chondroitin sulfate binding(GO:0035374) |
| 0.1 | 3.1 | GO:0045295 | gamma-catenin binding(GO:0045295) |
| 0.1 | 3.8 | GO:0008093 | cytoskeletal adaptor activity(GO:0008093) |
| 0.1 | 0.6 | GO:0035241 | protein-arginine omega-N monomethyltransferase activity(GO:0035241) |
| 0.1 | 0.3 | GO:0004923 | leukemia inhibitory factor receptor activity(GO:0004923) oncostatin-M receptor activity(GO:0004924) |
| 0.1 | 0.9 | GO:0004886 | 9-cis retinoic acid receptor activity(GO:0004886) |
| 0.1 | 0.2 | GO:0070892 | lipoteichoic acid receptor activity(GO:0070892) |
| 0.1 | 2.8 | GO:0001205 | transcriptional activator activity, RNA polymerase II distal enhancer sequence-specific binding(GO:0001205) |
| 0.1 | 0.3 | GO:0004849 | uridine kinase activity(GO:0004849) |
| 0.1 | 1.1 | GO:0001871 | pattern binding(GO:0001871) polysaccharide binding(GO:0030247) |
| 0.1 | 0.2 | GO:0004660 | protein farnesyltransferase activity(GO:0004660) |
| 0.1 | 0.2 | GO:0004348 | glucosylceramidase activity(GO:0004348) |
| 0.0 | 0.2 | GO:0070699 | type II activin receptor binding(GO:0070699) |
| 0.0 | 0.4 | GO:0047499 | calcium-independent phospholipase A2 activity(GO:0047499) |
| 0.0 | 2.6 | GO:0005179 | hormone activity(GO:0005179) |
| 0.0 | 0.4 | GO:0019992 | diacylglycerol binding(GO:0019992) |
| 0.0 | 0.1 | GO:0004483 | mRNA (nucleoside-2'-O-)-methyltransferase activity(GO:0004483) |
| 0.0 | 0.1 | GO:0016724 | ferroxidase activity(GO:0004322) oxidoreductase activity, oxidizing metal ions, oxygen as acceptor(GO:0016724) |
| 0.0 | 0.3 | GO:0097109 | neuroligin family protein binding(GO:0097109) |
| 0.0 | 0.5 | GO:0044183 | protein binding involved in protein folding(GO:0044183) |
| 0.0 | 0.1 | GO:0004560 | alpha-L-fucosidase activity(GO:0004560) |
| 0.0 | 0.1 | GO:0004887 | thyroid hormone receptor activity(GO:0004887) |
| 0.0 | 0.4 | GO:0015026 | coreceptor activity(GO:0015026) |
| 0.0 | 0.1 | GO:0004942 | anaphylatoxin receptor activity(GO:0004942) |
| 0.0 | 0.1 | GO:0004013 | adenosylhomocysteinase activity(GO:0004013) trialkylsulfonium hydrolase activity(GO:0016802) |
| 0.0 | 0.2 | GO:0015279 | store-operated calcium channel activity(GO:0015279) |
| 0.0 | 1.2 | GO:0001102 | RNA polymerase II activating transcription factor binding(GO:0001102) |
| 0.0 | 0.2 | GO:0016443 | bidentate ribonuclease III activity(GO:0016443) |
| 0.0 | 0.5 | GO:0017147 | Wnt-protein binding(GO:0017147) |
| 0.0 | 0.1 | GO:0004983 | neuropeptide Y receptor activity(GO:0004983) |
| 0.0 | 2.4 | GO:0017137 | Rab GTPase binding(GO:0017137) |
| 0.0 | 0.2 | GO:0005172 | vascular endothelial growth factor receptor binding(GO:0005172) |
| 0.0 | 0.0 | GO:0004140 | dephospho-CoA kinase activity(GO:0004140) |
| 0.0 | 0.2 | GO:0004190 | aspartic-type endopeptidase activity(GO:0004190) aspartic-type peptidase activity(GO:0070001) |
| 0.0 | 0.0 | GO:0004392 | heme oxygenase (decyclizing) activity(GO:0004392) |
| 0.0 | 0.4 | GO:0005112 | Notch binding(GO:0005112) |
| 0.0 | 0.2 | GO:0003950 | NAD+ ADP-ribosyltransferase activity(GO:0003950) |
| 0.0 | 0.1 | GO:0005522 | profilin binding(GO:0005522) |
| 0.0 | 0.2 | GO:0031402 | sodium ion binding(GO:0031402) |
|
|
|
|