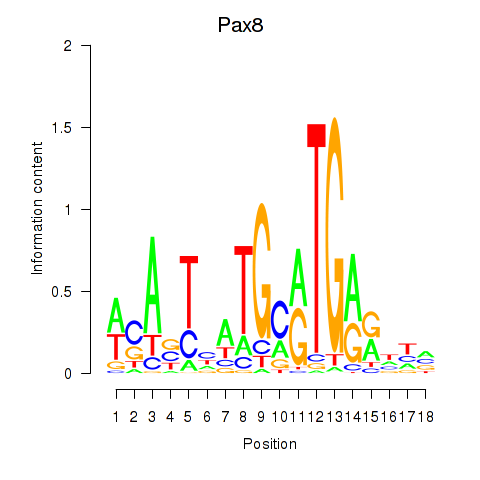
Motif ID: Pax8
Z-value: 0.342
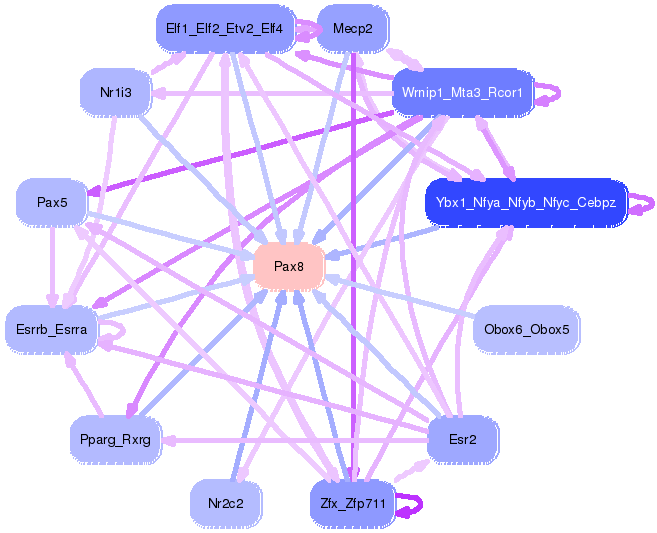
Transcription factors associated with Pax8:
| Gene Symbol | Entrez ID | Gene Name |
|---|---|---|
| Pax8 | ENSMUSG00000026976.9 | Pax8 |
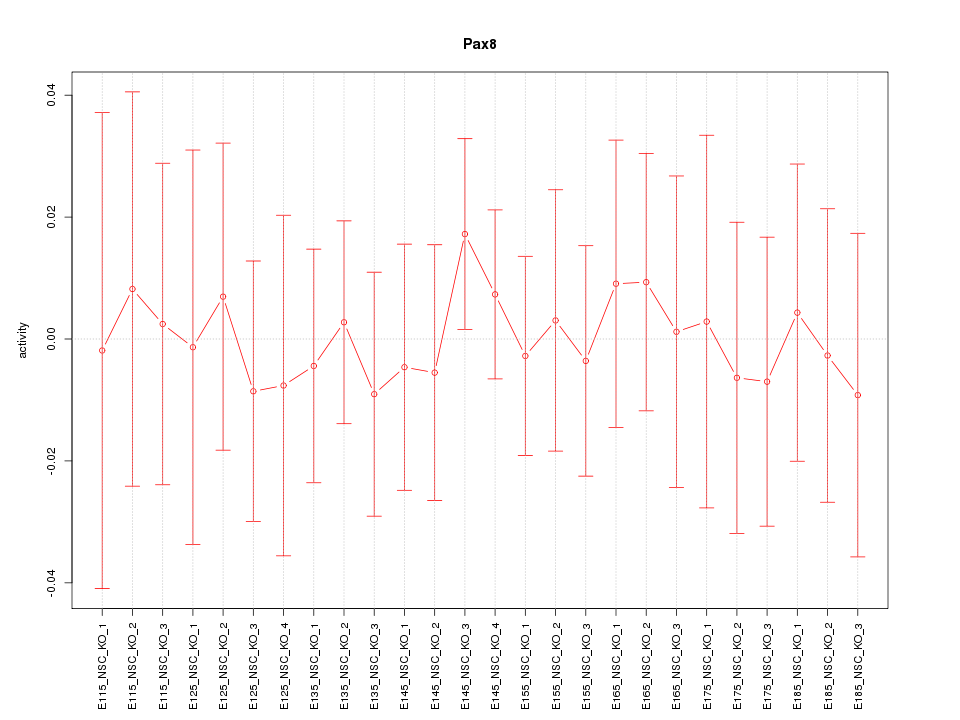
Activity-expression correlation:
| Gene Symbol | Promoter | Pearson corr. coef. | P-value | Plot |
|---|---|---|---|---|
| Pax8 | mm10_v2_chr2_-_24475097_24475215 | -0.09 | 6.5e-01 | Click! |

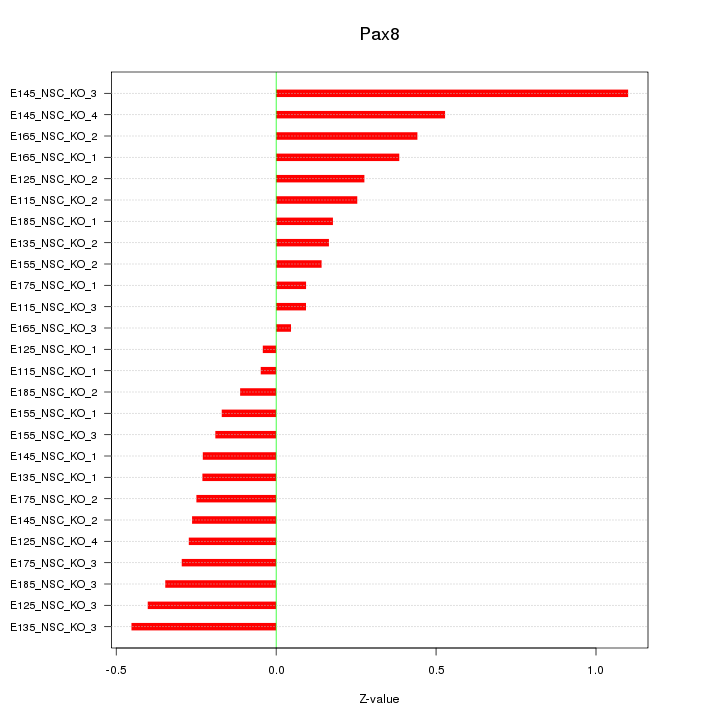
Top targets:
Gene overrepresentation in biological_process category:
| Log-likelihood per target | Total log-likelihood | Term | Description |
|---|---|---|---|
| 0.1 | 0.7 | GO:0002024 | diet induced thermogenesis(GO:0002024) adaptive thermogenesis(GO:1990845) |
| 0.0 | 0.2 | GO:0097421 | liver regeneration(GO:0097421) |
| 0.0 | 0.1 | GO:0007000 | nucleolus organization(GO:0007000) |
| 0.0 | 0.2 | GO:2000465 | regulation of glycogen (starch) synthase activity(GO:2000465) |
| 0.0 | 0.1 | GO:0042940 | D-amino acid transport(GO:0042940) |
Gene overrepresentation in cellular_component category:
| Log-likelihood per target | Total log-likelihood | Term | Description |
|---|---|---|---|
| 0.0 | 0.2 | GO:0048237 | rough endoplasmic reticulum lumen(GO:0048237) |
Gene overrepresentation in molecular_function category:
| Log-likelihood per target | Total log-likelihood | Term | Description |
|---|---|---|---|
| 0.2 | 0.6 | GO:0004980 | melanocortin receptor activity(GO:0004977) melanocyte-stimulating hormone receptor activity(GO:0004980) |
| 0.0 | 0.2 | GO:2001069 | glycogen binding(GO:2001069) |
| 0.0 | 0.2 | GO:0001871 | pattern binding(GO:0001871) polysaccharide binding(GO:0030247) |
| 0.0 | 0.1 | GO:0015091 | ferric iron transmembrane transporter activity(GO:0015091) trivalent inorganic cation transmembrane transporter activity(GO:0072510) |