| 1.4 |
4.3 |
GO:0001803 |
type III hypersensitivity(GO:0001802) regulation of type III hypersensitivity(GO:0001803) positive regulation of type III hypersensitivity(GO:0001805) |
| 0.9 |
2.8 |
GO:0002586 |
positive regulation of antigen processing and presentation of peptide or polysaccharide antigen via MHC class II(GO:0002582) regulation of antigen processing and presentation of peptide antigen via MHC class II(GO:0002586) positive regulation of antigen processing and presentation of peptide antigen via MHC class II(GO:0002588) |
| 0.9 |
8.1 |
GO:0019800 |
peptide cross-linking via chondroitin 4-sulfate glycosaminoglycan(GO:0019800) |
| 0.7 |
0.7 |
GO:1900121 |
negative regulation of receptor binding(GO:1900121) |
| 0.7 |
2.8 |
GO:2000551 |
regulation of T-helper 2 cell cytokine production(GO:2000551) positive regulation of T-helper 2 cell cytokine production(GO:2000553) |
| 0.6 |
1.8 |
GO:1901552 |
positive regulation of endothelial cell development(GO:1901552) positive regulation of establishment of endothelial barrier(GO:1903142) |
| 0.5 |
1.6 |
GO:0045410 |
positive regulation of interleukin-6 biosynthetic process(GO:0045410) |
| 0.5 |
2.1 |
GO:0071280 |
cellular response to copper ion(GO:0071280) |
| 0.5 |
1.6 |
GO:0046110 |
xanthine metabolic process(GO:0046110) |
| 0.5 |
1.0 |
GO:0032765 |
positive regulation of mast cell cytokine production(GO:0032765) |
| 0.5 |
0.9 |
GO:0071625 |
vocalization behavior(GO:0071625) |
| 0.5 |
1.4 |
GO:0003104 |
positive regulation of glomerular filtration(GO:0003104) |
| 0.5 |
2.2 |
GO:2000255 |
negative regulation of male germ cell proliferation(GO:2000255) |
| 0.4 |
2.7 |
GO:1902847 |
macrophage proliferation(GO:0061517) microglial cell proliferation(GO:0061518) regulation of neuronal signal transduction(GO:1902847) positive regulation of tau-protein kinase activity(GO:1902949) |
| 0.4 |
0.8 |
GO:0010751 |
negative regulation of nitric oxide mediated signal transduction(GO:0010751) |
| 0.4 |
0.8 |
GO:0051784 |
negative regulation of mitotic nuclear division(GO:0045839) negative regulation of nuclear division(GO:0051784) |
| 0.4 |
2.0 |
GO:0090292 |
nuclear matrix organization(GO:0043578) nuclear matrix anchoring at nuclear membrane(GO:0090292) |
| 0.4 |
2.0 |
GO:0070327 |
thyroid hormone transport(GO:0070327) |
| 0.4 |
1.2 |
GO:0032650 |
regulation of interleukin-1 alpha production(GO:0032650) positive regulation of interleukin-1 alpha production(GO:0032730) interleukin-1 alpha secretion(GO:0050703) |
| 0.4 |
1.2 |
GO:0002430 |
complement receptor mediated signaling pathway(GO:0002430) |
| 0.4 |
1.6 |
GO:0002924 |
negative regulation of humoral immune response mediated by circulating immunoglobulin(GO:0002924) |
| 0.4 |
0.4 |
GO:2000823 |
regulation of androgen receptor activity(GO:2000823) |
| 0.4 |
1.1 |
GO:1904177 |
regulation of adipose tissue development(GO:1904177) |
| 0.4 |
3.0 |
GO:0018149 |
peptide cross-linking(GO:0018149) |
| 0.4 |
1.1 |
GO:0072071 |
mesangial cell differentiation(GO:0072007) kidney interstitial fibroblast differentiation(GO:0072071) renal interstitial fibroblast development(GO:0072141) mesangial cell development(GO:0072143) |
| 0.4 |
1.1 |
GO:2000501 |
natural killer cell chemotaxis(GO:0035747) regulation of natural killer cell chemotaxis(GO:2000501) |
| 0.4 |
1.4 |
GO:0042373 |
vitamin K metabolic process(GO:0042373) |
| 0.4 |
0.7 |
GO:2000987 |
positive regulation of fear response(GO:1903367) positive regulation of behavioral fear response(GO:2000987) |
| 0.4 |
1.4 |
GO:0006780 |
uroporphyrinogen III biosynthetic process(GO:0006780) |
| 0.3 |
1.0 |
GO:1902630 |
regulation of membrane hyperpolarization(GO:1902630) |
| 0.3 |
1.0 |
GO:0014738 |
regulation of muscle hyperplasia(GO:0014738) muscle hyperplasia(GO:0014900) |
| 0.3 |
1.4 |
GO:2000427 |
positive regulation of apoptotic cell clearance(GO:2000427) |
| 0.3 |
1.7 |
GO:0006957 |
complement activation, alternative pathway(GO:0006957) |
| 0.3 |
2.3 |
GO:0019370 |
leukotriene biosynthetic process(GO:0019370) |
| 0.3 |
4.0 |
GO:2000480 |
negative regulation of cAMP-dependent protein kinase activity(GO:2000480) |
| 0.3 |
1.3 |
GO:0051582 |
positive regulation of neurotransmitter uptake(GO:0051582) positive regulation of dopamine uptake involved in synaptic transmission(GO:0051586) positive regulation of catecholamine uptake involved in synaptic transmission(GO:0051944) |
| 0.3 |
1.3 |
GO:0006481 |
C-terminal protein methylation(GO:0006481) |
| 0.3 |
0.9 |
GO:0003032 |
detection of oxygen(GO:0003032) |
| 0.3 |
1.3 |
GO:0071220 |
response to bacterial lipopeptide(GO:0070339) cellular response to bacterial lipoprotein(GO:0071220) cellular response to bacterial lipopeptide(GO:0071221) response to diacyl bacterial lipopeptide(GO:0071724) cellular response to diacyl bacterial lipopeptide(GO:0071726) |
| 0.3 |
1.8 |
GO:0019346 |
homoserine metabolic process(GO:0009092) transsulfuration(GO:0019346) |
| 0.3 |
0.6 |
GO:0010512 |
negative regulation of phosphatidylinositol biosynthetic process(GO:0010512) |
| 0.3 |
0.9 |
GO:0045869 |
negative regulation of single stranded viral RNA replication via double stranded DNA intermediate(GO:0045869) |
| 0.3 |
0.9 |
GO:0010989 |
negative regulation of low-density lipoprotein particle clearance(GO:0010989) |
| 0.3 |
0.9 |
GO:0043181 |
vacuolar sequestering(GO:0043181) |
| 0.3 |
1.2 |
GO:0003011 |
involuntary skeletal muscle contraction(GO:0003011) |
| 0.3 |
0.6 |
GO:0007210 |
serotonin receptor signaling pathway(GO:0007210) |
| 0.3 |
1.1 |
GO:2000483 |
negative regulation of interleukin-8 secretion(GO:2000483) |
| 0.3 |
1.7 |
GO:0046103 |
ADP biosynthetic process(GO:0006172) inosine biosynthetic process(GO:0046103) |
| 0.3 |
2.2 |
GO:0097460 |
ferrous iron import into cell(GO:0097460) |
| 0.3 |
0.8 |
GO:0051031 |
tRNA transport(GO:0051031) |
| 0.3 |
0.5 |
GO:1904058 |
positive regulation of sensory perception of pain(GO:1904058) |
| 0.3 |
0.8 |
GO:0008228 |
opsonization(GO:0008228) |
| 0.3 |
0.5 |
GO:0060160 |
negative regulation of dopamine receptor signaling pathway(GO:0060160) |
| 0.3 |
1.8 |
GO:0015862 |
uridine transport(GO:0015862) |
| 0.3 |
0.3 |
GO:2000346 |
negative regulation of hepatocyte proliferation(GO:2000346) regulation of integrin-mediated signaling pathway(GO:2001044) positive regulation of integrin-mediated signaling pathway(GO:2001046) |
| 0.3 |
2.8 |
GO:0032482 |
Rab protein signal transduction(GO:0032482) |
| 0.3 |
1.0 |
GO:0061718 |
NADH regeneration(GO:0006735) canonical glycolysis(GO:0061621) glucose catabolic process to pyruvate(GO:0061718) |
| 0.3 |
1.0 |
GO:1900740 |
regulation of protein insertion into mitochondrial membrane involved in apoptotic signaling pathway(GO:1900739) positive regulation of protein insertion into mitochondrial membrane involved in apoptotic signaling pathway(GO:1900740) |
| 0.3 |
0.5 |
GO:1901386 |
negative regulation of voltage-gated calcium channel activity(GO:1901386) |
| 0.3 |
0.8 |
GO:0032513 |
negative regulation of protein phosphatase type 2B activity(GO:0032513) |
| 0.2 |
0.5 |
GO:0045963 |
negative regulation of catecholamine metabolic process(GO:0045914) negative regulation of dopamine metabolic process(GO:0045963) |
| 0.2 |
1.0 |
GO:0007039 |
protein catabolic process in the vacuole(GO:0007039) |
| 0.2 |
0.7 |
GO:0044650 |
virion attachment to host cell(GO:0019062) adhesion of symbiont to host cell(GO:0044650) |
| 0.2 |
0.7 |
GO:1902083 |
negative regulation of peptidyl-cysteine S-nitrosylation(GO:1902083) |
| 0.2 |
2.1 |
GO:0014824 |
artery smooth muscle contraction(GO:0014824) |
| 0.2 |
0.9 |
GO:0006624 |
vacuolar protein processing(GO:0006624) |
| 0.2 |
2.3 |
GO:0006002 |
fructose 6-phosphate metabolic process(GO:0006002) |
| 0.2 |
0.7 |
GO:0042196 |
dichloromethane metabolic process(GO:0018900) chlorinated hydrocarbon metabolic process(GO:0042196) halogenated hydrocarbon metabolic process(GO:0042197) |
| 0.2 |
1.4 |
GO:0000160 |
phosphorelay signal transduction system(GO:0000160) |
| 0.2 |
0.7 |
GO:0070625 |
zymogen granule exocytosis(GO:0070625) |
| 0.2 |
0.5 |
GO:0048818 |
positive regulation of hair follicle maturation(GO:0048818) positive regulation of catagen(GO:0051795) |
| 0.2 |
0.7 |
GO:1903795 |
regulation of inorganic anion transmembrane transport(GO:1903795) |
| 0.2 |
0.9 |
GO:0032914 |
positive regulation of transforming growth factor beta1 production(GO:0032914) |
| 0.2 |
4.4 |
GO:0015812 |
gamma-aminobutyric acid transport(GO:0015812) |
| 0.2 |
0.7 |
GO:0042822 |
vitamin B6 metabolic process(GO:0042816) pyridoxal phosphate metabolic process(GO:0042822) pyridoxal phosphate biosynthetic process(GO:0042823) |
| 0.2 |
0.2 |
GO:0010543 |
regulation of platelet activation(GO:0010543) |
| 0.2 |
3.6 |
GO:0019835 |
cytolysis(GO:0019835) |
| 0.2 |
0.6 |
GO:0070459 |
prolactin secretion(GO:0070459) |
| 0.2 |
0.6 |
GO:1902310 |
positive regulation of peptidyl-serine dephosphorylation(GO:1902310) |
| 0.2 |
0.4 |
GO:0010752 |
regulation of cGMP-mediated signaling(GO:0010752) |
| 0.2 |
1.0 |
GO:0034441 |
plasma lipoprotein particle oxidation(GO:0034441) |
| 0.2 |
0.4 |
GO:0014735 |
regulation of muscle atrophy(GO:0014735) |
| 0.2 |
1.2 |
GO:0060718 |
chorionic trophoblast cell differentiation(GO:0060718) |
| 0.2 |
0.8 |
GO:1900110 |
negative regulation of histone H3-K9 dimethylation(GO:1900110) |
| 0.2 |
0.6 |
GO:0010992 |
ubiquitin homeostasis(GO:0010992) |
| 0.2 |
1.2 |
GO:0050861 |
positive regulation of B cell receptor signaling pathway(GO:0050861) |
| 0.2 |
1.0 |
GO:0010624 |
regulation of Schwann cell proliferation(GO:0010624) |
| 0.2 |
0.8 |
GO:0035617 |
stress granule disassembly(GO:0035617) |
| 0.2 |
0.2 |
GO:0034372 |
very-low-density lipoprotein particle remodeling(GO:0034372) |
| 0.2 |
0.6 |
GO:0071374 |
cellular response to parathyroid hormone stimulus(GO:0071374) |
| 0.2 |
0.6 |
GO:0090241 |
negative regulation of histone H4 acetylation(GO:0090241) |
| 0.2 |
1.2 |
GO:0043654 |
recognition of apoptotic cell(GO:0043654) |
| 0.2 |
0.6 |
GO:0060075 |
regulation of resting membrane potential(GO:0060075) |
| 0.2 |
0.6 |
GO:1904742 |
regulation of telomeric DNA binding(GO:1904742) |
| 0.2 |
0.6 |
GO:0034145 |
positive regulation of toll-like receptor 4 signaling pathway(GO:0034145) |
| 0.2 |
0.6 |
GO:1900122 |
positive regulation of receptor binding(GO:1900122) |
| 0.2 |
0.4 |
GO:0009298 |
GDP-mannose biosynthetic process(GO:0009298) |
| 0.2 |
1.5 |
GO:0043312 |
neutrophil degranulation(GO:0043312) |
| 0.2 |
0.6 |
GO:0032811 |
negative regulation of epinephrine secretion(GO:0032811) |
| 0.2 |
1.0 |
GO:2000252 |
negative regulation of feeding behavior(GO:2000252) |
| 0.2 |
0.2 |
GO:0033159 |
negative regulation of protein import into nucleus, translocation(GO:0033159) |
| 0.2 |
0.8 |
GO:0015786 |
UDP-glucose transport(GO:0015786) |
| 0.2 |
0.8 |
GO:0060083 |
smooth muscle contraction involved in micturition(GO:0060083) |
| 0.2 |
0.6 |
GO:0019074 |
viral genome packaging(GO:0019072) viral RNA genome packaging(GO:0019074) |
| 0.2 |
0.6 |
GO:0007621 |
negative regulation of female receptivity(GO:0007621) |
| 0.2 |
0.6 |
GO:0048611 |
ectodermal digestive tract development(GO:0007439) embryonic ectodermal digestive tract development(GO:0048611) |
| 0.2 |
0.9 |
GO:0070166 |
enamel mineralization(GO:0070166) |
| 0.2 |
0.6 |
GO:0008612 |
peptidyl-lysine modification to peptidyl-hypusine(GO:0008612) |
| 0.2 |
0.7 |
GO:0031509 |
telomeric heterochromatin assembly(GO:0031509) negative regulation of chromosome condensation(GO:1902340) |
| 0.2 |
0.7 |
GO:0042228 |
interleukin-8 biosynthetic process(GO:0042228) |
| 0.2 |
0.2 |
GO:2001268 |
negative regulation of cysteine-type endopeptidase activity involved in apoptotic signaling pathway(GO:2001268) |
| 0.2 |
0.9 |
GO:0010387 |
COP9 signalosome assembly(GO:0010387) |
| 0.2 |
0.5 |
GO:0097500 |
receptor localization to nonmotile primary cilium(GO:0097500) |
| 0.2 |
1.3 |
GO:0051958 |
methotrexate transport(GO:0051958) |
| 0.2 |
1.1 |
GO:0071955 |
recycling endosome to Golgi transport(GO:0071955) |
| 0.2 |
0.7 |
GO:2000830 |
vacuolar phosphate transport(GO:0007037) vitamin D3 metabolic process(GO:0070640) positive regulation of parathyroid hormone secretion(GO:2000830) |
| 0.2 |
0.5 |
GO:0010693 |
negative regulation of alkaline phosphatase activity(GO:0010693) |
| 0.2 |
1.1 |
GO:2000672 |
negative regulation of motor neuron apoptotic process(GO:2000672) |
| 0.2 |
0.5 |
GO:0010896 |
regulation of triglyceride catabolic process(GO:0010896) positive regulation of triglyceride catabolic process(GO:0010898) |
| 0.2 |
1.4 |
GO:0021894 |
cerebral cortex GABAergic interneuron development(GO:0021894) |
| 0.2 |
0.5 |
GO:0006436 |
tryptophanyl-tRNA aminoacylation(GO:0006436) |
| 0.2 |
0.2 |
GO:0000727 |
double-strand break repair via break-induced replication(GO:0000727) |
| 0.2 |
0.9 |
GO:0032713 |
negative regulation of interleukin-4 production(GO:0032713) |
| 0.2 |
0.7 |
GO:0048711 |
positive regulation of astrocyte differentiation(GO:0048711) |
| 0.2 |
0.5 |
GO:0050925 |
negative regulation of negative chemotaxis(GO:0050925) |
| 0.2 |
0.5 |
GO:0061588 |
calcium activated phospholipid scrambling(GO:0061588) calcium activated phosphatidylserine scrambling(GO:0061589) calcium activated phosphatidylcholine scrambling(GO:0061590) calcium activated galactosylceramide scrambling(GO:0061591) |
| 0.2 |
0.3 |
GO:0048289 |
isotype switching to IgE isotypes(GO:0048289) regulation of isotype switching to IgE isotypes(GO:0048293) |
| 0.2 |
0.3 |
GO:0071677 |
positive regulation of mononuclear cell migration(GO:0071677) |
| 0.2 |
1.4 |
GO:0051152 |
positive regulation of smooth muscle cell differentiation(GO:0051152) |
| 0.2 |
0.5 |
GO:1900060 |
negative regulation of ceramide biosynthetic process(GO:1900060) |
| 0.2 |
0.7 |
GO:0032804 |
negative regulation of low-density lipoprotein particle receptor catabolic process(GO:0032804) |
| 0.2 |
0.8 |
GO:0005513 |
detection of calcium ion(GO:0005513) |
| 0.2 |
0.8 |
GO:0023041 |
neuronal signal transduction(GO:0023041) |
| 0.2 |
1.3 |
GO:0038028 |
insulin receptor signaling pathway via phosphatidylinositol 3-kinase(GO:0038028) |
| 0.2 |
0.7 |
GO:1901252 |
regulation of intracellular transport of viral material(GO:1901252) |
| 0.2 |
0.5 |
GO:0006030 |
chitin metabolic process(GO:0006030) chitin catabolic process(GO:0006032) |
| 0.2 |
0.8 |
GO:0045657 |
positive regulation of monocyte differentiation(GO:0045657) |
| 0.2 |
2.2 |
GO:0031340 |
positive regulation of vesicle fusion(GO:0031340) |
| 0.2 |
0.5 |
GO:1903774 |
positive regulation of viral budding via host ESCRT complex(GO:1903774) |
| 0.2 |
0.5 |
GO:0072070 |
establishment or maintenance of polarity of embryonic epithelium(GO:0016332) loop of Henle development(GO:0072070) metanephric loop of Henle development(GO:0072236) |
| 0.2 |
1.0 |
GO:0035188 |
blastocyst hatching(GO:0001835) hatching(GO:0035188) organism emergence from protective structure(GO:0071684) |
| 0.2 |
2.2 |
GO:0050765 |
negative regulation of phagocytosis(GO:0050765) |
| 0.2 |
2.4 |
GO:0050832 |
defense response to fungus(GO:0050832) |
| 0.2 |
0.5 |
GO:0034162 |
toll-like receptor 9 signaling pathway(GO:0034162) |
| 0.2 |
1.1 |
GO:0016480 |
negative regulation of transcription from RNA polymerase III promoter(GO:0016480) |
| 0.2 |
0.5 |
GO:0060267 |
positive regulation of respiratory burst(GO:0060267) |
| 0.1 |
1.0 |
GO:1903301 |
positive regulation of glucokinase activity(GO:0033133) positive regulation of hexokinase activity(GO:1903301) |
| 0.1 |
0.4 |
GO:0032224 |
positive regulation of synaptic transmission, cholinergic(GO:0032224) |
| 0.1 |
0.4 |
GO:0046341 |
CDP-diacylglycerol metabolic process(GO:0046341) |
| 0.1 |
0.7 |
GO:0046598 |
positive regulation of viral entry into host cell(GO:0046598) |
| 0.1 |
1.4 |
GO:0007042 |
lysosomal lumen acidification(GO:0007042) |
| 0.1 |
0.3 |
GO:1903772 |
regulation of viral budding via host ESCRT complex(GO:1903772) |
| 0.1 |
0.9 |
GO:0036233 |
glycine import(GO:0036233) |
| 0.1 |
1.4 |
GO:0051386 |
regulation of neurotrophin TRK receptor signaling pathway(GO:0051386) |
| 0.1 |
0.6 |
GO:1900533 |
medium-chain fatty-acyl-CoA catabolic process(GO:0036114) long-chain fatty-acyl-CoA catabolic process(GO:0036116) palmitic acid metabolic process(GO:1900533) palmitic acid biosynthetic process(GO:1900535) |
| 0.1 |
0.6 |
GO:0000379 |
tRNA-type intron splice site recognition and cleavage(GO:0000379) |
| 0.1 |
1.2 |
GO:0043117 |
positive regulation of vascular permeability(GO:0043117) |
| 0.1 |
0.4 |
GO:0050904 |
diapedesis(GO:0050904) |
| 0.1 |
1.5 |
GO:0097034 |
mitochondrial respiratory chain complex IV assembly(GO:0033617) mitochondrial respiratory chain complex IV biogenesis(GO:0097034) |
| 0.1 |
0.8 |
GO:0015817 |
histidine transport(GO:0015817) |
| 0.1 |
1.7 |
GO:0070842 |
aggresome assembly(GO:0070842) |
| 0.1 |
0.8 |
GO:1900029 |
positive regulation of ruffle assembly(GO:1900029) |
| 0.1 |
0.8 |
GO:0036444 |
calcium ion transmembrane import into mitochondrion(GO:0036444) |
| 0.1 |
0.4 |
GO:1990034 |
calcium ion export from cell(GO:1990034) |
| 0.1 |
0.4 |
GO:0006116 |
NADH oxidation(GO:0006116) |
| 0.1 |
0.5 |
GO:0010759 |
positive regulation of macrophage chemotaxis(GO:0010759) |
| 0.1 |
1.3 |
GO:0060081 |
membrane hyperpolarization(GO:0060081) |
| 0.1 |
0.4 |
GO:0010668 |
ectodermal cell differentiation(GO:0010668) |
| 0.1 |
0.4 |
GO:0032959 |
inositol trisphosphate biosynthetic process(GO:0032959) |
| 0.1 |
0.1 |
GO:0002408 |
myeloid dendritic cell chemotaxis(GO:0002408) |
| 0.1 |
1.3 |
GO:0036376 |
sodium ion export from cell(GO:0036376) |
| 0.1 |
0.8 |
GO:0046880 |
regulation of follicle-stimulating hormone secretion(GO:0046880) follicle-stimulating hormone secretion(GO:0046884) |
| 0.1 |
0.5 |
GO:1904529 |
regulation of actin filament binding(GO:1904529) regulation of actin binding(GO:1904616) |
| 0.1 |
0.4 |
GO:1903054 |
negative regulation of extracellular matrix organization(GO:1903054) |
| 0.1 |
0.9 |
GO:0090503 |
RNA phosphodiester bond hydrolysis, exonucleolytic(GO:0090503) |
| 0.1 |
2.9 |
GO:0070208 |
protein heterotrimerization(GO:0070208) |
| 0.1 |
2.1 |
GO:0006958 |
complement activation, classical pathway(GO:0006958) |
| 0.1 |
1.8 |
GO:0006465 |
signal peptide processing(GO:0006465) |
| 0.1 |
0.6 |
GO:0010991 |
negative regulation of SMAD protein complex assembly(GO:0010991) |
| 0.1 |
0.2 |
GO:0042726 |
flavin-containing compound metabolic process(GO:0042726) |
| 0.1 |
0.1 |
GO:0035754 |
B cell chemotaxis(GO:0035754) |
| 0.1 |
0.6 |
GO:0019388 |
galactose catabolic process(GO:0019388) |
| 0.1 |
0.5 |
GO:0019287 |
isopentenyl diphosphate biosynthetic process(GO:0009240) isopentenyl diphosphate biosynthetic process, mevalonate pathway(GO:0019287) isopentenyl diphosphate metabolic process(GO:0046490) |
| 0.1 |
0.5 |
GO:1990253 |
cellular response to leucine starvation(GO:1990253) |
| 0.1 |
1.2 |
GO:0060136 |
embryonic process involved in female pregnancy(GO:0060136) |
| 0.1 |
0.5 |
GO:0050923 |
glossopharyngeal nerve development(GO:0021563) vagus nerve development(GO:0021564) regulation of negative chemotaxis(GO:0050923) |
| 0.1 |
0.4 |
GO:1900242 |
regulation of synaptic vesicle endocytosis(GO:1900242) |
| 0.1 |
0.6 |
GO:0035360 |
positive regulation of peroxisome proliferator activated receptor signaling pathway(GO:0035360) |
| 0.1 |
0.5 |
GO:0038128 |
ERBB2 signaling pathway(GO:0038128) |
| 0.1 |
0.8 |
GO:0090195 |
chemokine secretion(GO:0090195) regulation of chemokine secretion(GO:0090196) positive regulation of chemokine secretion(GO:0090197) |
| 0.1 |
0.8 |
GO:0001887 |
selenium compound metabolic process(GO:0001887) |
| 0.1 |
0.4 |
GO:0097309 |
cap1 mRNA methylation(GO:0097309) |
| 0.1 |
0.2 |
GO:0060971 |
embryonic heart tube left/right pattern formation(GO:0060971) |
| 0.1 |
0.2 |
GO:1990000 |
amyloid fibril formation(GO:1990000) |
| 0.1 |
1.3 |
GO:0006706 |
steroid catabolic process(GO:0006706) |
| 0.1 |
0.1 |
GO:2000646 |
positive regulation of receptor catabolic process(GO:2000646) |
| 0.1 |
0.3 |
GO:0072092 |
ureteric bud invasion(GO:0072092) |
| 0.1 |
0.9 |
GO:0018916 |
nitrobenzene metabolic process(GO:0018916) |
| 0.1 |
0.2 |
GO:1903596 |
regulation of gap junction assembly(GO:1903596) |
| 0.1 |
0.1 |
GO:0097212 |
lysosomal membrane organization(GO:0097212) |
| 0.1 |
0.3 |
GO:0060392 |
negative regulation of SMAD protein import into nucleus(GO:0060392) |
| 0.1 |
0.4 |
GO:0035624 |
receptor transactivation(GO:0035624) epidermal growth factor-activated receptor transactivation by G-protein coupled receptor signaling pathway(GO:0035625) |
| 0.1 |
0.7 |
GO:0061002 |
negative regulation of dendritic spine morphogenesis(GO:0061002) |
| 0.1 |
0.4 |
GO:1904426 |
positive regulation of GTP binding(GO:1904426) regulation of hydrogen:potassium-exchanging ATPase activity(GO:1904451) positive regulation of hydrogen:potassium-exchanging ATPase activity(GO:1904453) |
| 0.1 |
0.3 |
GO:0031990 |
mRNA export from nucleus in response to heat stress(GO:0031990) |
| 0.1 |
0.3 |
GO:0070317 |
negative regulation of G0 to G1 transition(GO:0070317) |
| 0.1 |
0.4 |
GO:1903012 |
positive regulation of bone development(GO:1903012) |
| 0.1 |
0.7 |
GO:1901029 |
negative regulation of mitochondrial outer membrane permeabilization involved in apoptotic signaling pathway(GO:1901029) |
| 0.1 |
0.2 |
GO:0070560 |
protein secretion by platelet(GO:0070560) |
| 0.1 |
0.3 |
GO:0045922 |
negative regulation of fatty acid biosynthetic process(GO:0045717) negative regulation of fatty acid metabolic process(GO:0045922) |
| 0.1 |
0.6 |
GO:0033603 |
positive regulation of dopamine secretion(GO:0033603) |
| 0.1 |
0.4 |
GO:0002667 |
lymphocyte anergy(GO:0002249) regulation of T cell anergy(GO:0002667) T cell anergy(GO:0002870) regulation of lymphocyte anergy(GO:0002911) |
| 0.1 |
0.3 |
GO:0001867 |
complement activation, lectin pathway(GO:0001867) |
| 0.1 |
0.4 |
GO:0006919 |
activation of cysteine-type endopeptidase activity involved in apoptotic process(GO:0006919) |
| 0.1 |
0.2 |
GO:2000152 |
regulation of protein K48-linked deubiquitination(GO:1903093) negative regulation of protein K48-linked deubiquitination(GO:1903094) regulation of ubiquitin-specific protease activity(GO:2000152) negative regulation of ubiquitin-specific protease activity(GO:2000157) |
| 0.1 |
0.2 |
GO:0045759 |
negative regulation of action potential(GO:0045759) |
| 0.1 |
1.0 |
GO:0071569 |
protein ufmylation(GO:0071569) |
| 0.1 |
0.4 |
GO:0034975 |
protein folding in endoplasmic reticulum(GO:0034975) |
| 0.1 |
0.3 |
GO:0044268 |
multicellular organismal protein metabolic process(GO:0044268) |
| 0.1 |
0.4 |
GO:0032289 |
central nervous system myelin formation(GO:0032289) |
| 0.1 |
0.6 |
GO:0042270 |
protection from natural killer cell mediated cytotoxicity(GO:0042270) |
| 0.1 |
0.6 |
GO:0034227 |
tRNA thio-modification(GO:0034227) |
| 0.1 |
0.5 |
GO:0060050 |
positive regulation of protein glycosylation(GO:0060050) |
| 0.1 |
0.7 |
GO:0032261 |
purine nucleotide salvage(GO:0032261) IMP salvage(GO:0032264) |
| 0.1 |
0.4 |
GO:0006432 |
phenylalanyl-tRNA aminoacylation(GO:0006432) |
| 0.1 |
0.4 |
GO:0010756 |
positive regulation of plasminogen activation(GO:0010756) |
| 0.1 |
0.4 |
GO:0000707 |
meiotic DNA recombinase assembly(GO:0000707) |
| 0.1 |
0.5 |
GO:0018002 |
N-terminal peptidyl-serine acetylation(GO:0017198) N-terminal peptidyl-glutamic acid acetylation(GO:0018002) peptidyl-serine acetylation(GO:0030920) |
| 0.1 |
0.6 |
GO:0060346 |
bone trabecula formation(GO:0060346) |
| 0.1 |
0.6 |
GO:0097067 |
cellular response to thyroid hormone stimulus(GO:0097067) |
| 0.1 |
0.1 |
GO:0033122 |
regulation of purine nucleotide catabolic process(GO:0033121) negative regulation of purine nucleotide catabolic process(GO:0033122) |
| 0.1 |
0.5 |
GO:1902683 |
regulation of receptor localization to synapse(GO:1902683) |
| 0.1 |
1.0 |
GO:0007168 |
receptor guanylyl cyclase signaling pathway(GO:0007168) |
| 0.1 |
0.5 |
GO:1905098 |
negative regulation of guanyl-nucleotide exchange factor activity(GO:1905098) |
| 0.1 |
0.4 |
GO:0021586 |
pons maturation(GO:0021586) |
| 0.1 |
0.4 |
GO:0060155 |
platelet dense granule organization(GO:0060155) |
| 0.1 |
0.8 |
GO:0060732 |
positive regulation of inositol phosphate biosynthetic process(GO:0060732) |
| 0.1 |
0.3 |
GO:0071404 |
cellular response to lipoprotein particle stimulus(GO:0071402) cellular response to low-density lipoprotein particle stimulus(GO:0071404) |
| 0.1 |
0.3 |
GO:0035672 |
oligopeptide transmembrane transport(GO:0035672) |
| 0.1 |
0.4 |
GO:0007191 |
adenylate cyclase-activating dopamine receptor signaling pathway(GO:0007191) |
| 0.1 |
2.1 |
GO:0051016 |
barbed-end actin filament capping(GO:0051016) |
| 0.1 |
0.2 |
GO:0014873 |
response to muscle activity involved in regulation of muscle adaptation(GO:0014873) |
| 0.1 |
0.5 |
GO:0032717 |
negative regulation of interleukin-8 production(GO:0032717) |
| 0.1 |
0.1 |
GO:0061365 |
positive regulation of triglyceride lipase activity(GO:0061365) |
| 0.1 |
0.5 |
GO:0072321 |
chaperone-mediated protein transport(GO:0072321) |
| 0.1 |
0.6 |
GO:2000491 |
positive regulation of hepatic stellate cell activation(GO:2000491) |
| 0.1 |
0.1 |
GO:0032497 |
detection of lipopolysaccharide(GO:0032497) |
| 0.1 |
0.1 |
GO:0008535 |
respiratory chain complex IV assembly(GO:0008535) |
| 0.1 |
0.2 |
GO:0072656 |
maintenance of protein location in mitochondrion(GO:0072656) |
| 0.1 |
0.5 |
GO:0007197 |
adenylate cyclase-inhibiting G-protein coupled acetylcholine receptor signaling pathway(GO:0007197) phospholipase C-activating G-protein coupled acetylcholine receptor signaling pathway(GO:0007207) |
| 0.1 |
0.7 |
GO:0006787 |
porphyrin-containing compound catabolic process(GO:0006787) tetrapyrrole catabolic process(GO:0033015) |
| 0.1 |
0.3 |
GO:0009223 |
pyrimidine deoxyribonucleotide catabolic process(GO:0009223) |
| 0.1 |
2.0 |
GO:0045824 |
negative regulation of innate immune response(GO:0045824) |
| 0.1 |
1.1 |
GO:0044243 |
collagen catabolic process(GO:0030574) multicellular organism catabolic process(GO:0044243) |
| 0.1 |
0.4 |
GO:0000447 |
endonucleolytic cleavage in ITS1 to separate SSU-rRNA from 5.8S rRNA and LSU-rRNA from tricistronic rRNA transcript (SSU-rRNA, 5.8S rRNA, LSU-rRNA)(GO:0000447) |
| 0.1 |
1.4 |
GO:0045792 |
negative regulation of cell size(GO:0045792) |
| 0.1 |
6.9 |
GO:0030032 |
lamellipodium assembly(GO:0030032) |
| 0.1 |
0.3 |
GO:0006566 |
threonine metabolic process(GO:0006566) |
| 0.1 |
0.5 |
GO:0006590 |
thyroid hormone generation(GO:0006590) |
| 0.1 |
0.4 |
GO:0010737 |
protein kinase A signaling(GO:0010737) |
| 0.1 |
0.4 |
GO:0002309 |
T cell proliferation involved in immune response(GO:0002309) |
| 0.1 |
0.5 |
GO:0051964 |
negative regulation of synapse assembly(GO:0051964) |
| 0.1 |
1.3 |
GO:0061462 |
protein localization to lysosome(GO:0061462) |
| 0.1 |
0.4 |
GO:0043388 |
positive regulation of DNA binding(GO:0043388) |
| 0.1 |
0.9 |
GO:0000185 |
activation of MAPKKK activity(GO:0000185) |
| 0.1 |
0.3 |
GO:1901421 |
positive regulation of response to alcohol(GO:1901421) |
| 0.1 |
1.9 |
GO:0000028 |
ribosomal small subunit assembly(GO:0000028) |
| 0.1 |
0.2 |
GO:0002636 |
positive regulation of germinal center formation(GO:0002636) |
| 0.1 |
0.4 |
GO:1903361 |
protein localization to basolateral plasma membrane(GO:1903361) |
| 0.1 |
0.5 |
GO:0006452 |
translational frameshifting(GO:0006452) positive regulation of translational termination(GO:0045905) |
| 0.1 |
0.7 |
GO:0032020 |
ISG15-protein conjugation(GO:0032020) |
| 0.1 |
0.3 |
GO:0006627 |
protein processing involved in protein targeting to mitochondrion(GO:0006627) |
| 0.1 |
0.9 |
GO:0019262 |
N-acetylneuraminate catabolic process(GO:0019262) |
| 0.1 |
3.3 |
GO:2000649 |
regulation of sodium ion transmembrane transporter activity(GO:2000649) |
| 0.1 |
0.6 |
GO:0035814 |
negative regulation of renal sodium excretion(GO:0035814) |
| 0.1 |
1.5 |
GO:2000311 |
regulation of alpha-amino-3-hydroxy-5-methyl-4-isoxazole propionate selective glutamate receptor activity(GO:2000311) |
| 0.1 |
0.7 |
GO:0070995 |
NADPH oxidation(GO:0070995) |
| 0.1 |
0.2 |
GO:0034382 |
chylomicron remnant clearance(GO:0034382) triglyceride-rich lipoprotein particle clearance(GO:0071830) |
| 0.1 |
0.3 |
GO:0006003 |
fructose 2,6-bisphosphate metabolic process(GO:0006003) |
| 0.1 |
0.4 |
GO:0019852 |
L-ascorbic acid metabolic process(GO:0019852) |
| 0.1 |
0.2 |
GO:0035526 |
retrograde transport, plasma membrane to Golgi(GO:0035526) |
| 0.1 |
0.4 |
GO:0048170 |
positive regulation of long-term neuronal synaptic plasticity(GO:0048170) |
| 0.1 |
0.3 |
GO:0021914 |
negative regulation of smoothened signaling pathway involved in ventral spinal cord patterning(GO:0021914) |
| 0.1 |
0.2 |
GO:0046959 |
habituation(GO:0046959) |
| 0.1 |
0.8 |
GO:0098903 |
regulation of membrane repolarization during action potential(GO:0098903) |
| 0.1 |
0.2 |
GO:0060854 |
patterning of lymph vessels(GO:0060854) |
| 0.1 |
0.2 |
GO:0033364 |
mast cell secretory granule organization(GO:0033364) |
| 0.1 |
0.4 |
GO:0042989 |
sequestering of actin monomers(GO:0042989) |
| 0.1 |
0.3 |
GO:1903587 |
regulation of blood vessel endothelial cell proliferation involved in sprouting angiogenesis(GO:1903587) |
| 0.1 |
0.7 |
GO:0006750 |
glutathione biosynthetic process(GO:0006750) |
| 0.1 |
0.8 |
GO:0010388 |
protein deneddylation(GO:0000338) cullin deneddylation(GO:0010388) |
| 0.1 |
0.9 |
GO:0030431 |
sleep(GO:0030431) |
| 0.1 |
0.4 |
GO:0030854 |
positive regulation of granulocyte differentiation(GO:0030854) |
| 0.1 |
2.1 |
GO:2000300 |
regulation of synaptic vesicle exocytosis(GO:2000300) |
| 0.1 |
0.4 |
GO:0032423 |
regulation of mismatch repair(GO:0032423) |
| 0.1 |
0.3 |
GO:0042985 |
negative regulation of amyloid precursor protein biosynthetic process(GO:0042985) |
| 0.1 |
0.1 |
GO:0006956 |
complement activation(GO:0006956) |
| 0.1 |
0.7 |
GO:2001214 |
positive regulation of vasculogenesis(GO:2001214) |
| 0.1 |
0.4 |
GO:0045716 |
positive regulation of low-density lipoprotein particle receptor biosynthetic process(GO:0045716) |
| 0.1 |
1.3 |
GO:0050995 |
negative regulation of lipid catabolic process(GO:0050995) |
| 0.1 |
0.2 |
GO:0070488 |
neutrophil aggregation(GO:0070488) |
| 0.1 |
0.2 |
GO:0032755 |
positive regulation of interleukin-6 production(GO:0032755) |
| 0.1 |
1.2 |
GO:0007271 |
synaptic transmission, cholinergic(GO:0007271) |
| 0.1 |
0.4 |
GO:0015671 |
oxygen transport(GO:0015671) |
| 0.1 |
0.2 |
GO:0042998 |
positive regulation of Golgi to plasma membrane protein transport(GO:0042998) |
| 0.1 |
0.2 |
GO:0042554 |
superoxide anion generation(GO:0042554) |
| 0.1 |
0.3 |
GO:1901723 |
negative regulation of cell proliferation involved in kidney development(GO:1901723) |
| 0.1 |
0.3 |
GO:0051725 |
protein de-ADP-ribosylation(GO:0051725) |
| 0.1 |
0.4 |
GO:0050729 |
positive regulation of inflammatory response(GO:0050729) |
| 0.1 |
0.2 |
GO:0046098 |
guanine metabolic process(GO:0046098) |
| 0.1 |
0.3 |
GO:0046398 |
UDP-glucuronate metabolic process(GO:0046398) |
| 0.1 |
0.8 |
GO:0019243 |
methylglyoxal catabolic process to D-lactate via S-lactoyl-glutathione(GO:0019243) methylglyoxal catabolic process(GO:0051596) methylglyoxal catabolic process to lactate(GO:0061727) |
| 0.1 |
0.3 |
GO:0006685 |
sphingomyelin catabolic process(GO:0006685) |
| 0.1 |
0.5 |
GO:0035902 |
response to immobilization stress(GO:0035902) |
| 0.1 |
0.2 |
GO:0001830 |
trophectodermal cell fate commitment(GO:0001830) |
| 0.1 |
0.5 |
GO:0002931 |
response to ischemia(GO:0002931) |
| 0.1 |
0.1 |
GO:1901187 |
regulation of ephrin receptor signaling pathway(GO:1901187) |
| 0.1 |
0.2 |
GO:0042560 |
10-formyltetrahydrofolate catabolic process(GO:0009258) folic acid-containing compound catabolic process(GO:0009397) pteridine-containing compound catabolic process(GO:0042560) |
| 0.1 |
0.4 |
GO:0016266 |
O-glycan processing(GO:0016266) |
| 0.1 |
0.3 |
GO:0000393 |
spliceosomal conformational changes to generate catalytic conformation(GO:0000393) |
| 0.1 |
0.2 |
GO:0035751 |
regulation of lysosomal lumen pH(GO:0035751) |
| 0.1 |
0.2 |
GO:0006642 |
triglyceride mobilization(GO:0006642) |
| 0.1 |
1.0 |
GO:0002021 |
response to dietary excess(GO:0002021) |
| 0.1 |
0.4 |
GO:0061668 |
mitochondrial ribosome assembly(GO:0061668) |
| 0.1 |
1.2 |
GO:0032981 |
NADH dehydrogenase complex assembly(GO:0010257) mitochondrial respiratory chain complex I assembly(GO:0032981) mitochondrial respiratory chain complex I biogenesis(GO:0097031) |
| 0.1 |
0.5 |
GO:0006701 |
progesterone biosynthetic process(GO:0006701) |
| 0.1 |
0.8 |
GO:0035414 |
negative regulation of catenin import into nucleus(GO:0035414) |
| 0.1 |
0.4 |
GO:1901727 |
positive regulation of histone deacetylase activity(GO:1901727) |
| 0.1 |
0.1 |
GO:0003245 |
cardiac muscle tissue growth involved in heart morphogenesis(GO:0003245) |
| 0.1 |
0.2 |
GO:0032331 |
negative regulation of chondrocyte differentiation(GO:0032331) |
| 0.1 |
0.4 |
GO:0045040 |
protein import into mitochondrial outer membrane(GO:0045040) |
| 0.1 |
0.3 |
GO:0033299 |
secretion of lysosomal enzymes(GO:0033299) |
| 0.1 |
0.3 |
GO:2000065 |
negative regulation of glucocorticoid metabolic process(GO:0031944) negative regulation of glucocorticoid biosynthetic process(GO:0031947) negative regulation of aldosterone metabolic process(GO:0032345) negative regulation of aldosterone biosynthetic process(GO:0032348) negative regulation of cortisol biosynthetic process(GO:2000065) |
| 0.1 |
0.3 |
GO:0048840 |
otolith development(GO:0048840) |
| 0.1 |
1.0 |
GO:0099517 |
anterograde synaptic vesicle transport(GO:0048490) synaptic vesicle cytoskeletal transport(GO:0099514) synaptic vesicle transport along microtubule(GO:0099517) |
| 0.1 |
0.2 |
GO:0016115 |
terpenoid catabolic process(GO:0016115) |
| 0.1 |
0.3 |
GO:0032026 |
response to magnesium ion(GO:0032026) |
| 0.1 |
0.2 |
GO:0070649 |
formin-nucleated actin cable assembly(GO:0070649) |
| 0.1 |
0.7 |
GO:0099500 |
synaptic vesicle fusion to presynaptic active zone membrane(GO:0031629) vesicle fusion to plasma membrane(GO:0099500) |
| 0.1 |
0.2 |
GO:0046381 |
CMP-N-acetylneuraminate metabolic process(GO:0046381) |
| 0.1 |
0.5 |
GO:0006620 |
posttranslational protein targeting to membrane(GO:0006620) |
| 0.1 |
0.5 |
GO:0043983 |
histone H4-K12 acetylation(GO:0043983) |
| 0.1 |
0.2 |
GO:0016561 |
protein import into peroxisome matrix, translocation(GO:0016561) |
| 0.1 |
2.5 |
GO:0048821 |
erythrocyte development(GO:0048821) |
| 0.1 |
0.5 |
GO:0002755 |
MyD88-dependent toll-like receptor signaling pathway(GO:0002755) |
| 0.1 |
0.4 |
GO:0010758 |
regulation of macrophage chemotaxis(GO:0010758) |
| 0.1 |
0.1 |
GO:0038027 |
apolipoprotein A-I-mediated signaling pathway(GO:0038027) |
| 0.1 |
0.3 |
GO:0046348 |
amino sugar catabolic process(GO:0046348) |
| 0.1 |
0.3 |
GO:1990743 |
protein sialylation(GO:1990743) |
| 0.1 |
0.3 |
GO:0002536 |
respiratory burst involved in inflammatory response(GO:0002536) respiratory burst involved in defense response(GO:0002679) |
| 0.1 |
0.2 |
GO:2000983 |
regulation of ATP citrate synthase activity(GO:2000983) negative regulation of ATP citrate synthase activity(GO:2000984) |
| 0.1 |
0.3 |
GO:0046294 |
formaldehyde catabolic process(GO:0046294) |
| 0.1 |
0.5 |
GO:0006561 |
proline biosynthetic process(GO:0006561) |
| 0.1 |
0.1 |
GO:0071455 |
cellular response to increased oxygen levels(GO:0036295) response to increased oxygen levels(GO:0036296) response to hyperoxia(GO:0055093) cellular response to hyperoxia(GO:0071455) |
| 0.1 |
0.5 |
GO:1900262 |
regulation of DNA-directed DNA polymerase activity(GO:1900262) positive regulation of DNA-directed DNA polymerase activity(GO:1900264) |
| 0.1 |
0.3 |
GO:0071051 |
polyadenylation-dependent snoRNA 3'-end processing(GO:0071051) |
| 0.1 |
0.5 |
GO:0006020 |
inositol metabolic process(GO:0006020) |
| 0.1 |
0.5 |
GO:0002862 |
negative regulation of inflammatory response to antigenic stimulus(GO:0002862) |
| 0.1 |
0.5 |
GO:0007220 |
Notch receptor processing(GO:0007220) |
| 0.1 |
0.2 |
GO:2000271 |
positive regulation of fibroblast apoptotic process(GO:2000271) |
| 0.1 |
5.2 |
GO:0051965 |
positive regulation of synapse assembly(GO:0051965) |
| 0.1 |
1.5 |
GO:0002526 |
acute inflammatory response(GO:0002526) |
| 0.1 |
2.5 |
GO:0006890 |
retrograde vesicle-mediated transport, Golgi to ER(GO:0006890) |
| 0.1 |
0.9 |
GO:0070935 |
3'-UTR-mediated mRNA stabilization(GO:0070935) |
| 0.1 |
0.6 |
GO:0072010 |
renal filtration cell differentiation(GO:0061318) glomerular epithelium development(GO:0072010) glomerular visceral epithelial cell differentiation(GO:0072112) glomerular epithelial cell differentiation(GO:0072311) |
| 0.1 |
0.2 |
GO:0006013 |
mannose metabolic process(GO:0006013) |
| 0.1 |
0.1 |
GO:2000407 |
regulation of T cell extravasation(GO:2000407) |
| 0.1 |
0.3 |
GO:0046864 |
retinol transport(GO:0034633) nose morphogenesis(GO:0043585) isoprenoid transport(GO:0046864) terpenoid transport(GO:0046865) alveolar primary septum development(GO:0061143) |
| 0.1 |
0.2 |
GO:0015889 |
cobalamin transport(GO:0015889) |
| 0.1 |
0.2 |
GO:1902268 |
negative regulation of polyamine transmembrane transport(GO:1902268) |
| 0.1 |
0.3 |
GO:0006348 |
chromatin silencing at telomere(GO:0006348) |
| 0.1 |
0.9 |
GO:0009191 |
ribonucleoside diphosphate catabolic process(GO:0009191) |
| 0.1 |
0.2 |
GO:0032788 |
saturated monocarboxylic acid metabolic process(GO:0032788) unsaturated monocarboxylic acid metabolic process(GO:0032789) |
| 0.1 |
0.2 |
GO:0060672 |
epithelial cell differentiation involved in embryonic placenta development(GO:0060671) epithelial cell morphogenesis involved in placental branching(GO:0060672) |
| 0.1 |
1.8 |
GO:0042255 |
ribosome assembly(GO:0042255) |
| 0.1 |
0.2 |
GO:0010566 |
regulation of ketone biosynthetic process(GO:0010566) |
| 0.1 |
0.2 |
GO:1903305 |
regulation of regulated secretory pathway(GO:1903305) |
| 0.1 |
0.7 |
GO:0001765 |
membrane raft assembly(GO:0001765) |
| 0.1 |
0.3 |
GO:0044375 |
regulation of peroxisome size(GO:0044375) |
| 0.1 |
0.8 |
GO:0009312 |
oligosaccharide biosynthetic process(GO:0009312) |
| 0.1 |
0.4 |
GO:0030579 |
ubiquitin-dependent SMAD protein catabolic process(GO:0030579) |
| 0.1 |
0.1 |
GO:0051204 |
protein insertion into mitochondrial membrane(GO:0051204) |
| 0.1 |
1.2 |
GO:0048268 |
clathrin coat assembly(GO:0048268) |
| 0.1 |
0.2 |
GO:0090160 |
Golgi to lysosome transport(GO:0090160) |
| 0.1 |
0.7 |
GO:0048280 |
vesicle fusion with Golgi apparatus(GO:0048280) |
| 0.1 |
0.8 |
GO:0046597 |
negative regulation of viral entry into host cell(GO:0046597) |
| 0.1 |
0.2 |
GO:0048597 |
post-embryonic camera-type eye morphogenesis(GO:0048597) |
| 0.1 |
1.7 |
GO:0006749 |
glutathione metabolic process(GO:0006749) |
| 0.1 |
0.1 |
GO:0003128 |
heart field specification(GO:0003128) heart induction(GO:0003129) |
| 0.1 |
0.2 |
GO:1901475 |
pyruvate transmembrane transport(GO:1901475) |
| 0.1 |
0.1 |
GO:0000480 |
endonucleolytic cleavage in 5'-ETS of tricistronic rRNA transcript (SSU-rRNA, 5.8S rRNA, LSU-rRNA)(GO:0000480) |
| 0.1 |
0.2 |
GO:0035622 |
intrahepatic bile duct development(GO:0035622) |
| 0.1 |
0.5 |
GO:0001516 |
prostaglandin biosynthetic process(GO:0001516) prostanoid biosynthetic process(GO:0046457) |
| 0.1 |
0.3 |
GO:0010884 |
positive regulation of lipid storage(GO:0010884) |
| 0.1 |
3.4 |
GO:0015992 |
proton transport(GO:0015992) |
| 0.1 |
0.3 |
GO:2000676 |
positive regulation of type B pancreatic cell apoptotic process(GO:2000676) |
| 0.1 |
0.9 |
GO:0006491 |
N-glycan processing(GO:0006491) |
| 0.1 |
0.5 |
GO:0034776 |
response to histamine(GO:0034776) cellular response to histamine(GO:0071420) |
| 0.1 |
1.5 |
GO:0016578 |
histone deubiquitination(GO:0016578) |
| 0.1 |
0.6 |
GO:0051764 |
actin crosslink formation(GO:0051764) |
| 0.1 |
0.2 |
GO:0021636 |
trigeminal nerve morphogenesis(GO:0021636) trigeminal nerve structural organization(GO:0021637) |
| 0.1 |
0.4 |
GO:0016139 |
glycoside catabolic process(GO:0016139) |
| 0.1 |
0.2 |
GO:0019919 |
peptidyl-arginine methylation, to asymmetrical-dimethyl arginine(GO:0019919) |
| 0.0 |
0.3 |
GO:0045647 |
negative regulation of erythrocyte differentiation(GO:0045647) |
| 0.0 |
0.3 |
GO:0006122 |
mitochondrial electron transport, ubiquinol to cytochrome c(GO:0006122) |
| 0.0 |
0.4 |
GO:0061299 |
retina vasculature morphogenesis in camera-type eye(GO:0061299) |
| 0.0 |
0.1 |
GO:0006691 |
leukotriene metabolic process(GO:0006691) |
| 0.0 |
0.2 |
GO:0055091 |
phospholipid homeostasis(GO:0055091) |
| 0.0 |
1.0 |
GO:0002076 |
osteoblast development(GO:0002076) |
| 0.0 |
0.4 |
GO:0033623 |
regulation of integrin activation(GO:0033623) |
| 0.0 |
0.1 |
GO:0033158 |
regulation of protein import into nucleus, translocation(GO:0033158) |
| 0.0 |
0.8 |
GO:0001553 |
luteinization(GO:0001553) |
| 0.0 |
1.8 |
GO:0021696 |
cerebellar cortex morphogenesis(GO:0021696) |
| 0.0 |
0.2 |
GO:0018343 |
protein farnesylation(GO:0018343) |
| 0.0 |
0.9 |
GO:0016180 |
snRNA processing(GO:0016180) |
| 0.0 |
0.1 |
GO:0072061 |
inner medullary collecting duct development(GO:0072061) |
| 0.0 |
0.4 |
GO:0033622 |
integrin activation(GO:0033622) |
| 0.0 |
0.4 |
GO:0016322 |
neuron remodeling(GO:0016322) |
| 0.0 |
0.2 |
GO:0098789 |
pre-mRNA cleavage required for polyadenylation(GO:0098789) |
| 0.0 |
0.2 |
GO:0043928 |
exonucleolytic nuclear-transcribed mRNA catabolic process involved in deadenylation-dependent decay(GO:0043928) |
| 0.0 |
0.2 |
GO:0006529 |
asparagine biosynthetic process(GO:0006529) |
| 0.0 |
0.1 |
GO:2000744 |
anterior head development(GO:0097065) regulation of anterior head development(GO:2000742) positive regulation of anterior head development(GO:2000744) |
| 0.0 |
0.2 |
GO:0016557 |
peroxisome membrane biogenesis(GO:0016557) |
| 0.0 |
0.4 |
GO:0006857 |
oligopeptide transport(GO:0006857) |
| 0.0 |
0.2 |
GO:0044829 |
positive regulation by host of viral genome replication(GO:0044829) |
| 0.0 |
0.2 |
GO:0006478 |
peptidyl-tyrosine sulfation(GO:0006478) |
| 0.0 |
0.3 |
GO:0048227 |
plasma membrane to endosome transport(GO:0048227) |
| 0.0 |
0.2 |
GO:0030382 |
sperm mitochondrion organization(GO:0030382) |
| 0.0 |
0.1 |
GO:0042891 |
antibiotic transport(GO:0042891) |
| 0.0 |
0.4 |
GO:0007020 |
microtubule nucleation(GO:0007020) |
| 0.0 |
0.4 |
GO:0045019 |
negative regulation of nitric oxide biosynthetic process(GO:0045019) negative regulation of nitric oxide metabolic process(GO:1904406) |
| 0.0 |
1.5 |
GO:0030513 |
positive regulation of BMP signaling pathway(GO:0030513) |
| 0.0 |
1.1 |
GO:0070306 |
lens fiber cell differentiation(GO:0070306) |
| 0.0 |
0.3 |
GO:0033005 |
positive regulation of mast cell activation(GO:0033005) |
| 0.0 |
0.2 |
GO:0019509 |
L-methionine biosynthetic process from methylthioadenosine(GO:0019509) |
| 0.0 |
0.3 |
GO:0035999 |
tetrahydrofolate interconversion(GO:0035999) |
| 0.0 |
0.4 |
GO:0034390 |
smooth muscle cell apoptotic process(GO:0034390) regulation of smooth muscle cell apoptotic process(GO:0034391) |
| 0.0 |
0.2 |
GO:0051697 |
protein delipidation(GO:0051697) |
| 0.0 |
0.5 |
GO:0015813 |
L-glutamate transport(GO:0015813) |
| 0.0 |
0.6 |
GO:0095500 |
acetylcholine receptor signaling pathway(GO:0095500) postsynaptic signal transduction(GO:0098926) signal transduction involved in cellular response to ammonium ion(GO:1903831) response to acetylcholine(GO:1905144) cellular response to acetylcholine(GO:1905145) |
| 0.0 |
0.4 |
GO:0014829 |
vascular smooth muscle contraction(GO:0014829) |
| 0.0 |
0.1 |
GO:0003199 |
endocardial cushion to mesenchymal transition involved in heart valve formation(GO:0003199) |
| 0.0 |
0.2 |
GO:0034116 |
positive regulation of heterotypic cell-cell adhesion(GO:0034116) |
| 0.0 |
0.8 |
GO:0034198 |
cellular response to amino acid starvation(GO:0034198) |
| 0.0 |
0.2 |
GO:0030033 |
microvillus assembly(GO:0030033) |
| 0.0 |
0.1 |
GO:0051639 |
actin filament network formation(GO:0051639) |
| 0.0 |
0.3 |
GO:0071318 |
cellular response to ATP(GO:0071318) |
| 0.0 |
0.8 |
GO:0070536 |
protein K63-linked deubiquitination(GO:0070536) |
| 0.0 |
0.3 |
GO:0048169 |
regulation of long-term neuronal synaptic plasticity(GO:0048169) |
| 0.0 |
0.2 |
GO:0070589 |
cell wall mannoprotein biosynthetic process(GO:0000032) mannoprotein metabolic process(GO:0006056) mannoprotein biosynthetic process(GO:0006057) cell wall glycoprotein biosynthetic process(GO:0031506) cell wall biogenesis(GO:0042546) cell wall macromolecule metabolic process(GO:0044036) cell wall macromolecule biosynthetic process(GO:0044038) chain elongation of O-linked mannose residue(GO:0044845) cellular component macromolecule biosynthetic process(GO:0070589) cell wall organization or biogenesis(GO:0071554) |
| 0.0 |
0.1 |
GO:0097343 |
ripoptosome assembly(GO:0097343) ripoptosome assembly involved in necroptotic process(GO:1901026) |
| 0.0 |
0.3 |
GO:0016255 |
attachment of GPI anchor to protein(GO:0016255) |
| 0.0 |
0.4 |
GO:0035646 |
endosome to melanosome transport(GO:0035646) endosome to pigment granule transport(GO:0043485) pigment granule maturation(GO:0048757) |
| 0.0 |
0.4 |
GO:0060716 |
labyrinthine layer blood vessel development(GO:0060716) |
| 0.0 |
0.0 |
GO:0072338 |
creatinine metabolic process(GO:0046449) cellular lactam metabolic process(GO:0072338) |
| 0.0 |
0.6 |
GO:0045063 |
T-helper 1 cell differentiation(GO:0045063) |
| 0.0 |
0.6 |
GO:0046475 |
glycerophospholipid catabolic process(GO:0046475) |
| 0.0 |
0.3 |
GO:0014002 |
astrocyte development(GO:0014002) |
| 0.0 |
0.3 |
GO:2000210 |
positive regulation of anoikis(GO:2000210) |
| 0.0 |
0.3 |
GO:0090043 |
tubulin deacetylation(GO:0090042) regulation of tubulin deacetylation(GO:0090043) |
| 0.0 |
0.1 |
GO:0036015 |
response to interleukin-3(GO:0036015) cellular response to interleukin-3(GO:0036016) |
| 0.0 |
0.3 |
GO:0021860 |
pyramidal neuron development(GO:0021860) |
| 0.0 |
1.3 |
GO:0070527 |
platelet aggregation(GO:0070527) |
| 0.0 |
0.9 |
GO:0045747 |
positive regulation of Notch signaling pathway(GO:0045747) |
| 0.0 |
0.3 |
GO:0071260 |
cellular response to mechanical stimulus(GO:0071260) |
| 0.0 |
1.0 |
GO:0032011 |
ARF protein signal transduction(GO:0032011) regulation of ARF protein signal transduction(GO:0032012) |
| 0.0 |
0.6 |
GO:0032007 |
negative regulation of TOR signaling(GO:0032007) |
| 0.0 |
0.5 |
GO:0006120 |
mitochondrial electron transport, NADH to ubiquinone(GO:0006120) |
| 0.0 |
0.2 |
GO:0033160 |
positive regulation of protein import into nucleus, translocation(GO:0033160) |
| 0.0 |
0.6 |
GO:0007616 |
long-term memory(GO:0007616) |
| 0.0 |
0.2 |
GO:0021993 |
initiation of neural tube closure(GO:0021993) |
| 0.0 |
1.1 |
GO:0010738 |
regulation of protein kinase A signaling(GO:0010738) |
| 0.0 |
0.3 |
GO:0042435 |
indole-containing compound biosynthetic process(GO:0042435) |
| 0.0 |
0.4 |
GO:0042760 |
very long-chain fatty acid catabolic process(GO:0042760) |
| 0.0 |
0.1 |
GO:2000569 |
T-helper 2 cell activation(GO:0035712) positive regulation of T-helper 17 type immune response(GO:2000318) regulation of T-helper 2 cell activation(GO:2000569) positive regulation of T-helper 2 cell activation(GO:2000570) |
| 0.0 |
0.2 |
GO:0070125 |
mitochondrial translational elongation(GO:0070125) |
| 0.0 |
0.2 |
GO:2000048 |
negative regulation of cell-cell adhesion mediated by cadherin(GO:2000048) |
| 0.0 |
0.2 |
GO:1902224 |
cellular ketone body metabolic process(GO:0046950) ketone body metabolic process(GO:1902224) |
| 0.0 |
0.2 |
GO:0090168 |
Golgi reassembly(GO:0090168) |
| 0.0 |
0.2 |
GO:0097286 |
iron ion import(GO:0097286) |
| 0.0 |
0.6 |
GO:1901897 |
regulation of relaxation of cardiac muscle(GO:1901897) |
| 0.0 |
0.5 |
GO:0010954 |
positive regulation of protein processing(GO:0010954) positive regulation of protein maturation(GO:1903319) |
| 0.0 |
0.5 |
GO:0001731 |
formation of translation preinitiation complex(GO:0001731) |
| 0.0 |
0.2 |
GO:0071624 |
positive regulation of granulocyte chemotaxis(GO:0071624) positive regulation of neutrophil chemotaxis(GO:0090023) |
| 0.0 |
0.4 |
GO:0046036 |
CTP biosynthetic process(GO:0006241) CTP metabolic process(GO:0046036) |
| 0.0 |
0.0 |
GO:0045358 |
negative regulation of interferon-beta biosynthetic process(GO:0045358) |
| 0.0 |
0.6 |
GO:0016579 |
protein deubiquitination(GO:0016579) |
| 0.0 |
0.2 |
GO:0075525 |
viral translational termination-reinitiation(GO:0075525) |
| 0.0 |
0.2 |
GO:0007258 |
JUN phosphorylation(GO:0007258) |
| 0.0 |
0.3 |
GO:0006104 |
succinyl-CoA metabolic process(GO:0006104) |
| 0.0 |
0.5 |
GO:0006662 |
glycerol ether metabolic process(GO:0006662) ether metabolic process(GO:0018904) |
| 0.0 |
0.8 |
GO:0010866 |
regulation of triglyceride biosynthetic process(GO:0010866) |
| 0.0 |
0.4 |
GO:0071470 |
cellular response to osmotic stress(GO:0071470) |
| 0.0 |
0.2 |
GO:0006995 |
cellular response to nitrogen starvation(GO:0006995) cellular response to nitrogen levels(GO:0043562) |
| 0.0 |
0.1 |
GO:0002227 |
innate immune response in mucosa(GO:0002227) |
| 0.0 |
0.3 |
GO:0010574 |
regulation of vascular endothelial growth factor production(GO:0010574) |
| 0.0 |
0.2 |
GO:0098739 |
import across plasma membrane(GO:0098739) |
| 0.0 |
0.3 |
GO:0097006 |
regulation of plasma lipoprotein particle levels(GO:0097006) |
| 0.0 |
0.1 |
GO:0006001 |
fructose catabolic process(GO:0006001) fructose catabolic process to hydroxyacetone phosphate and glyceraldehyde-3-phosphate(GO:0061624) glycolytic process through fructose-1-phosphate(GO:0061625) |
| 0.0 |
0.5 |
GO:0045648 |
positive regulation of erythrocyte differentiation(GO:0045648) |
| 0.0 |
1.4 |
GO:0006414 |
translational elongation(GO:0006414) |
| 0.0 |
0.1 |
GO:0006667 |
sphinganine metabolic process(GO:0006667) |
| 0.0 |
0.3 |
GO:0042775 |
mitochondrial ATP synthesis coupled electron transport(GO:0042775) |
| 0.0 |
0.3 |
GO:0045324 |
late endosome to vacuole transport(GO:0045324) |
| 0.0 |
0.1 |
GO:0015960 |
diadenosine polyphosphate biosynthetic process(GO:0015960) diadenosine tetraphosphate metabolic process(GO:0015965) diadenosine tetraphosphate biosynthetic process(GO:0015966) |
| 0.0 |
0.2 |
GO:0031424 |
keratinization(GO:0031424) |
| 0.0 |
0.9 |
GO:0030199 |
collagen fibril organization(GO:0030199) |
| 0.0 |
0.2 |
GO:0034453 |
microtubule anchoring(GO:0034453) |
| 0.0 |
0.3 |
GO:0015937 |
coenzyme A biosynthetic process(GO:0015937) |
| 0.0 |
1.5 |
GO:0006888 |
ER to Golgi vesicle-mediated transport(GO:0006888) |
| 0.0 |
0.3 |
GO:0071816 |
protein insertion into ER membrane(GO:0045048) tail-anchored membrane protein insertion into ER membrane(GO:0071816) |
| 0.0 |
2.8 |
GO:0036503 |
ERAD pathway(GO:0036503) |
| 0.0 |
0.2 |
GO:0051045 |
negative regulation of membrane protein ectodomain proteolysis(GO:0051045) |
| 0.0 |
0.5 |
GO:1900087 |
positive regulation of G1/S transition of mitotic cell cycle(GO:1900087) |
| 0.0 |
1.0 |
GO:0034314 |
Arp2/3 complex-mediated actin nucleation(GO:0034314) |
| 0.0 |
0.3 |
GO:0007229 |
integrin-mediated signaling pathway(GO:0007229) |
| 0.0 |
0.1 |
GO:0044539 |
long-chain fatty acid import(GO:0044539) |
| 0.0 |
0.2 |
GO:0006654 |
phosphatidic acid biosynthetic process(GO:0006654) phosphatidic acid metabolic process(GO:0046473) |
| 0.0 |
0.1 |
GO:0061043 |
regulation of vascular wound healing(GO:0061043) |
| 0.0 |
0.6 |
GO:1902230 |
negative regulation of intrinsic apoptotic signaling pathway in response to DNA damage(GO:1902230) |
| 0.0 |
0.2 |
GO:0030397 |
membrane disassembly(GO:0030397) nuclear envelope disassembly(GO:0051081) |
| 0.0 |
1.0 |
GO:0034605 |
cellular response to heat(GO:0034605) |
| 0.0 |
1.3 |
GO:0016126 |
sterol biosynthetic process(GO:0016126) |
| 0.0 |
0.5 |
GO:0001937 |
negative regulation of endothelial cell proliferation(GO:0001937) |
| 0.0 |
0.1 |
GO:0032757 |
positive regulation of interleukin-8 production(GO:0032757) |
| 0.0 |
0.1 |
GO:0007320 |
insemination(GO:0007320) |
| 0.0 |
0.2 |
GO:0043416 |
regulation of skeletal muscle tissue regeneration(GO:0043416) |
| 0.0 |
0.2 |
GO:0032376 |
positive regulation of sterol transport(GO:0032373) positive regulation of cholesterol transport(GO:0032376) |
| 0.0 |
0.4 |
GO:1901663 |
quinone biosynthetic process(GO:1901663) |
| 0.0 |
0.6 |
GO:0007205 |
protein kinase C-activating G-protein coupled receptor signaling pathway(GO:0007205) |
| 0.0 |
0.4 |
GO:0021942 |
radial glia guided migration of Purkinje cell(GO:0021942) |
| 0.0 |
0.2 |
GO:0014823 |
response to activity(GO:0014823) |
| 0.0 |
0.0 |
GO:1902608 |
regulation of large conductance calcium-activated potassium channel activity(GO:1902606) positive regulation of large conductance calcium-activated potassium channel activity(GO:1902608) |
| 0.0 |
0.3 |
GO:0051896 |
regulation of protein kinase B signaling(GO:0051896) |
| 0.0 |
0.1 |
GO:0046185 |
aldehyde catabolic process(GO:0046185) |
| 0.0 |
0.2 |
GO:0035092 |
sperm chromatin condensation(GO:0035092) |
| 0.0 |
0.1 |
GO:0035405 |
histone-threonine phosphorylation(GO:0035405) |
| 0.0 |
0.4 |
GO:2000310 |
regulation of N-methyl-D-aspartate selective glutamate receptor activity(GO:2000310) |
| 0.0 |
0.1 |
GO:0048563 |
post-embryonic organ morphogenesis(GO:0048563) |
| 0.0 |
0.6 |
GO:1902108 |
regulation of mitochondrial membrane permeability involved in apoptotic process(GO:1902108) |
| 0.0 |
0.1 |
GO:0070235 |
regulation of activation-induced cell death of T cells(GO:0070235) |
| 0.0 |
0.4 |
GO:0031054 |
pre-miRNA processing(GO:0031054) |
| 0.0 |
1.4 |
GO:0048489 |
synaptic vesicle transport(GO:0048489) establishment of synaptic vesicle localization(GO:0097480) |
| 0.0 |
2.6 |
GO:0071805 |
potassium ion transmembrane transport(GO:0071805) |
| 0.0 |
0.2 |
GO:0031115 |
negative regulation of microtubule polymerization(GO:0031115) |
| 0.0 |
0.4 |
GO:0007141 |
male meiosis I(GO:0007141) |
| 0.0 |
0.7 |
GO:0071480 |
cellular response to gamma radiation(GO:0071480) |
| 0.0 |
0.2 |
GO:0051683 |
establishment of Golgi localization(GO:0051683) |
| 0.0 |
0.2 |
GO:0090050 |
positive regulation of cell migration involved in sprouting angiogenesis(GO:0090050) |
| 0.0 |
0.2 |
GO:0033004 |
negative regulation of mast cell activation(GO:0033004) |
| 0.0 |
0.1 |
GO:0019236 |
response to pheromone(GO:0019236) |
| 0.0 |
0.4 |
GO:0022904 |
respiratory electron transport chain(GO:0022904) |
| 0.0 |
0.2 |
GO:0090557 |
establishment of endothelial intestinal barrier(GO:0090557) |
| 0.0 |
0.4 |
GO:0032060 |
bleb assembly(GO:0032060) |
| 0.0 |
0.3 |
GO:1902592 |
viral budding(GO:0046755) multi-organism organelle organization(GO:1902590) multi-organism membrane budding(GO:1902592) |
| 0.0 |
0.2 |
GO:0033108 |
mitochondrial respiratory chain complex assembly(GO:0033108) |
| 0.0 |
0.2 |
GO:2000653 |
regulation of genetic imprinting(GO:2000653) |
| 0.0 |
0.7 |
GO:0000266 |
mitochondrial fission(GO:0000266) |
| 0.0 |
0.3 |
GO:0034340 |
response to type I interferon(GO:0034340) |
| 0.0 |
0.0 |
GO:0045448 |
regulation of mitotic cell cycle, embryonic(GO:0009794) mitotic cell cycle, embryonic(GO:0045448) |
| 0.0 |
0.7 |
GO:0007041 |
lysosomal transport(GO:0007041) |
| 0.0 |
0.0 |
GO:0035357 |
peroxisome proliferator activated receptor signaling pathway(GO:0035357) |
| 0.0 |
0.0 |
GO:1900186 |
negative regulation of clathrin-mediated endocytosis(GO:1900186) regulation of caveolin-mediated endocytosis(GO:2001286) |
| 0.0 |
0.2 |
GO:0045047 |
protein targeting to ER(GO:0045047) |
| 0.0 |
0.2 |
GO:2000060 |
positive regulation of protein ubiquitination involved in ubiquitin-dependent protein catabolic process(GO:2000060) |
| 0.0 |
0.3 |
GO:0046855 |
phosphorylated carbohydrate dephosphorylation(GO:0046838) inositol phosphate dephosphorylation(GO:0046855) |
| 0.0 |
0.4 |
GO:0001706 |
endoderm formation(GO:0001706) |
| 0.0 |
0.3 |
GO:0070528 |
protein kinase C signaling(GO:0070528) |
| 0.0 |
0.3 |
GO:0045945 |
positive regulation of transcription from RNA polymerase III promoter(GO:0045945) |
| 0.0 |
0.0 |
GO:0060279 |
positive regulation of ovulation(GO:0060279) |
| 0.0 |
0.3 |
GO:0070266 |
necroptotic process(GO:0070266) |
| 0.0 |
0.0 |
GO:0061028 |
establishment of endothelial barrier(GO:0061028) |
| 0.0 |
0.2 |
GO:0070129 |
regulation of mitochondrial translation(GO:0070129) |
| 0.0 |
0.2 |
GO:0036265 |
RNA (guanine-N7)-methylation(GO:0036265) |
| 0.0 |
0.0 |
GO:0034729 |
histone H3-K79 methylation(GO:0034729) |
| 0.0 |
0.1 |
GO:0071787 |
endoplasmic reticulum tubular network assembly(GO:0071787) |
| 0.0 |
0.2 |
GO:0034497 |
protein localization to pre-autophagosomal structure(GO:0034497) |
| 0.0 |
0.1 |
GO:1990441 |
intrinsic apoptotic signaling pathway in response to hypoxia(GO:1990144) negative regulation of transcription from RNA polymerase II promoter in response to endoplasmic reticulum stress(GO:1990441) |
| 0.0 |
0.1 |
GO:0030432 |
phasic smooth muscle contraction(GO:0014821) peristalsis(GO:0030432) |
| 0.0 |
0.2 |
GO:0006308 |
DNA catabolic process(GO:0006308) |
| 0.0 |
0.3 |
GO:0008053 |
mitochondrial fusion(GO:0008053) |
| 0.0 |
0.1 |
GO:0006390 |
transcription from mitochondrial promoter(GO:0006390) |
| 0.0 |
0.1 |
GO:0006549 |
isoleucine metabolic process(GO:0006549) |
| 0.0 |
0.4 |
GO:0019915 |
lipid storage(GO:0019915) |
| 0.0 |
0.1 |
GO:0019673 |
GDP-mannose metabolic process(GO:0019673) |
| 0.0 |
0.2 |
GO:2000009 |
negative regulation of protein localization to cell surface(GO:2000009) |
| 0.0 |
0.2 |
GO:1900383 |
regulation of synaptic plasticity by receptor localization to synapse(GO:1900383) |
| 0.0 |
0.1 |
GO:0070234 |
positive regulation of T cell apoptotic process(GO:0070234) |
| 0.0 |
0.3 |
GO:0008542 |
visual learning(GO:0008542) |
| 0.0 |
0.3 |
GO:0007200 |
phospholipase C-activating G-protein coupled receptor signaling pathway(GO:0007200) |
| 0.0 |
0.2 |
GO:0097576 |
autophagosome maturation(GO:0097352) vacuole fusion(GO:0097576) |
| 0.0 |
0.4 |
GO:0010812 |
negative regulation of cell-substrate adhesion(GO:0010812) |
| 0.0 |
0.2 |
GO:0071225 |
cellular response to muramyl dipeptide(GO:0071225) |
| 0.0 |
1.1 |
GO:0032874 |
positive regulation of stress-activated MAPK cascade(GO:0032874) |
| 0.0 |
0.4 |
GO:0016226 |
iron-sulfur cluster assembly(GO:0016226) metallo-sulfur cluster assembly(GO:0031163) |
| 0.0 |
0.6 |
GO:0061178 |
regulation of insulin secretion involved in cellular response to glucose stimulus(GO:0061178) |
| 0.0 |
0.5 |
GO:0008637 |
apoptotic mitochondrial changes(GO:0008637) |
| 0.0 |
0.2 |
GO:0007416 |
synapse assembly(GO:0007416) |
| 0.0 |
0.1 |
GO:0071025 |
RNA surveillance(GO:0071025) |
| 0.0 |
0.1 |
GO:0071243 |
cellular response to arsenic-containing substance(GO:0071243) |
| 0.0 |
0.1 |
GO:0051418 |
interphase microtubule nucleation by interphase microtubule organizing center(GO:0051415) microtubule nucleation by microtubule organizing center(GO:0051418) |
| 0.0 |
0.3 |
GO:0051898 |
negative regulation of protein kinase B signaling(GO:0051898) |
| 0.0 |
0.0 |
GO:0072205 |
metanephric collecting duct development(GO:0072205) |
| 0.0 |
0.3 |
GO:0002548 |
monocyte chemotaxis(GO:0002548) |
| 0.0 |
0.1 |
GO:0050819 |
negative regulation of coagulation(GO:0050819) |
| 0.0 |
0.1 |
GO:0070986 |
left/right axis specification(GO:0070986) |
| 0.0 |
0.4 |
GO:0003333 |
amino acid transmembrane transport(GO:0003333) |
| 0.0 |
0.5 |
GO:0031641 |
regulation of myelination(GO:0031641) |
| 0.0 |
0.2 |
GO:0021516 |
dorsal spinal cord development(GO:0021516) |
| 0.0 |
0.3 |
GO:0007340 |
acrosome reaction(GO:0007340) |
| 0.0 |
0.3 |
GO:0048713 |
regulation of oligodendrocyte differentiation(GO:0048713) |
| 0.0 |
0.0 |
GO:0007202 |
activation of phospholipase C activity(GO:0007202) positive regulation of phospholipase C activity(GO:0010863) regulation of phospholipase C activity(GO:1900274) |
| 0.0 |
0.2 |
GO:0006047 |
UDP-N-acetylglucosamine metabolic process(GO:0006047) |
| 0.0 |
0.4 |
GO:0090162 |
establishment of epithelial cell polarity(GO:0090162) |
| 0.0 |
0.3 |
GO:0050919 |
negative chemotaxis(GO:0050919) |
| 0.0 |
0.1 |
GO:0051930 |
regulation of sensory perception of pain(GO:0051930) regulation of sensory perception(GO:0051931) |
| 0.0 |
0.1 |
GO:0021785 |
branchiomotor neuron axon guidance(GO:0021785) |
| 0.0 |
0.2 |
GO:0000188 |
inactivation of MAPK activity(GO:0000188) |
| 0.0 |
0.1 |
GO:0045607 |
regulation of auditory receptor cell differentiation(GO:0045607) regulation of mechanoreceptor differentiation(GO:0045631) regulation of inner ear receptor cell differentiation(GO:2000980) |
| 0.0 |
0.0 |
GO:0045602 |
negative regulation of endothelial cell differentiation(GO:0045602) |
| 0.0 |
0.4 |
GO:0010507 |
negative regulation of autophagy(GO:0010507) |
| 0.0 |
0.2 |
GO:0035024 |
negative regulation of Rho protein signal transduction(GO:0035024) |
| 0.0 |
0.4 |
GO:0099643 |
neurotransmitter secretion(GO:0007269) signal release from synapse(GO:0099643) |
| 0.0 |
0.2 |
GO:0061036 |
positive regulation of cartilage development(GO:0061036) |
| 0.0 |
0.2 |
GO:0006388 |
tRNA splicing, via endonucleolytic cleavage and ligation(GO:0006388) |
| 0.0 |
0.1 |
GO:2000096 |
positive regulation of Wnt signaling pathway, planar cell polarity pathway(GO:2000096) |
| 0.0 |
0.0 |
GO:0010499 |
proteasomal ubiquitin-independent protein catabolic process(GO:0010499) |
| 0.0 |
0.1 |
GO:2000124 |
regulation of endocannabinoid signaling pathway(GO:2000124) |
| 0.0 |
0.1 |
GO:0061635 |
regulation of protein complex stability(GO:0061635) |
| 0.0 |
0.4 |
GO:0030279 |
negative regulation of ossification(GO:0030279) |
| 0.0 |
0.1 |
GO:0048617 |
embryonic foregut morphogenesis(GO:0048617) |
| 0.0 |
0.1 |
GO:1903025 |
regulation of RNA polymerase II regulatory region sequence-specific DNA binding(GO:1903025) |
| 0.0 |
0.1 |
GO:0033210 |
leptin-mediated signaling pathway(GO:0033210) |
| 0.0 |
0.1 |
GO:1900745 |
positive regulation of p38MAPK cascade(GO:1900745) |
| 0.0 |
0.1 |
GO:0042572 |
retinol metabolic process(GO:0042572) |
| 0.0 |
0.2 |
GO:0072661 |
protein targeting to plasma membrane(GO:0072661) |
| 0.0 |
0.2 |
GO:0016601 |
Rac protein signal transduction(GO:0016601) |
| 0.0 |
0.1 |
GO:0051447 |
negative regulation of meiotic cell cycle(GO:0051447) |
| 0.0 |
0.1 |
GO:0015740 |
C4-dicarboxylate transport(GO:0015740) |
| 0.0 |
0.1 |
GO:0019695 |
choline metabolic process(GO:0019695) |
| 0.0 |
0.2 |
GO:0034063 |
stress granule assembly(GO:0034063) |
| 0.0 |
0.1 |
GO:0034394 |
protein localization to cell surface(GO:0034394) |
| 0.0 |
0.5 |
GO:0032526 |
response to retinoic acid(GO:0032526) |
| 0.0 |
0.1 |
GO:0051923 |
sulfation(GO:0051923) |
| 0.0 |
0.2 |
GO:0046488 |
phosphatidylinositol metabolic process(GO:0046488) |
| 0.0 |
0.1 |
GO:0030224 |
monocyte differentiation(GO:0030224) |
| 0.0 |
0.0 |
GO:2000465 |
regulation of glycogen (starch) synthase activity(GO:2000465) |
| 0.0 |
0.0 |
GO:0048069 |
eye pigmentation(GO:0048069) |
| 0.0 |
0.1 |
GO:0032469 |
endoplasmic reticulum calcium ion homeostasis(GO:0032469) |
| 0.0 |
0.0 |
GO:0035519 |
protein K29-linked ubiquitination(GO:0035519) |
| 0.0 |
0.1 |
GO:0061045 |
negative regulation of wound healing(GO:0061045) |
| 0.0 |
0.2 |
GO:0009081 |
branched-chain amino acid metabolic process(GO:0009081) branched-chain amino acid catabolic process(GO:0009083) |
| 0.0 |
0.5 |
GO:0051865 |
protein autoubiquitination(GO:0051865) |
| 0.0 |
0.2 |
GO:0008625 |
extrinsic apoptotic signaling pathway via death domain receptors(GO:0008625) |
| 0.0 |
0.1 |
GO:0030865 |
cortical cytoskeleton organization(GO:0030865) |
| 0.0 |
0.4 |
GO:0032543 |
mitochondrial translation(GO:0032543) |
| 0.0 |
0.0 |
GO:0036112 |
medium-chain fatty-acyl-CoA metabolic process(GO:0036112) |
| 0.0 |
0.3 |
GO:0030317 |
sperm motility(GO:0030317) |
| 0.0 |
0.9 |
GO:0000423 |
macromitophagy(GO:0000423) mitophagy in response to mitochondrial depolarization(GO:0098779) response to mitochondrial depolarisation(GO:0098780) |
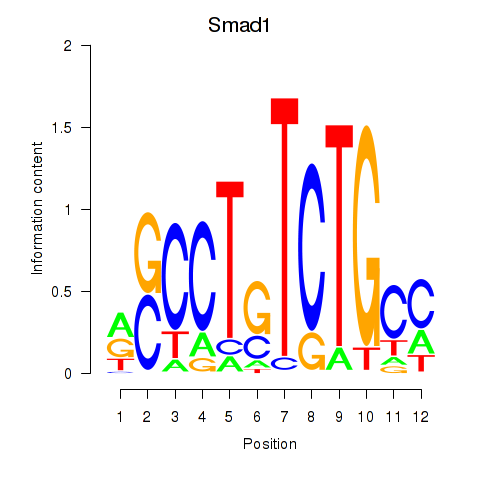

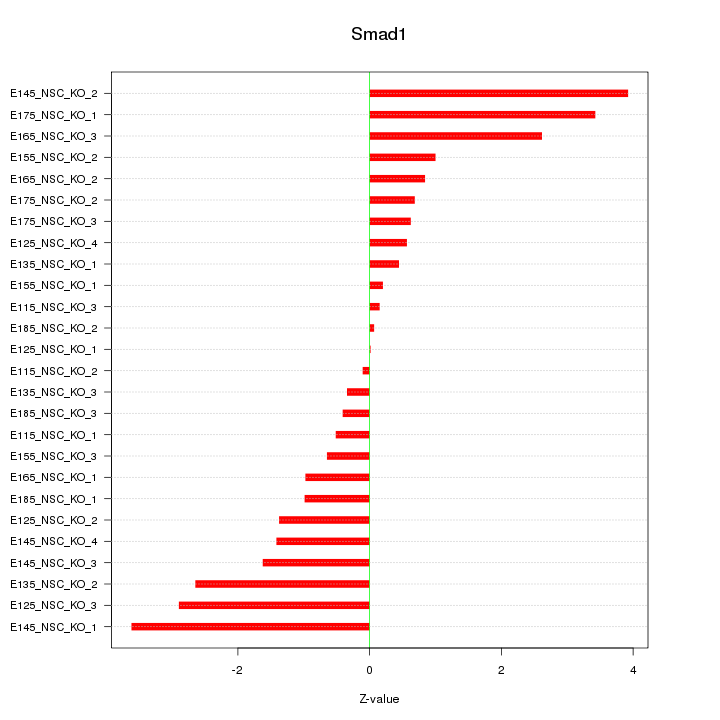

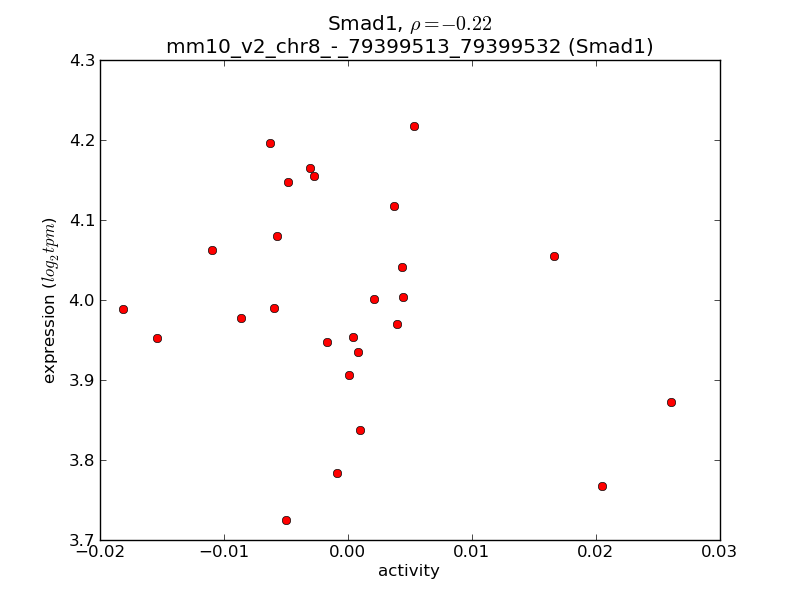
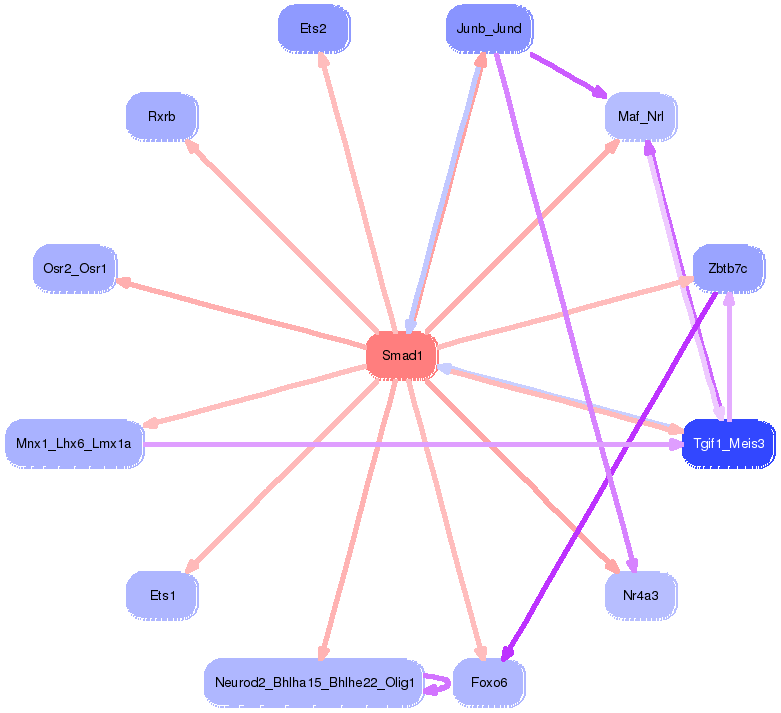