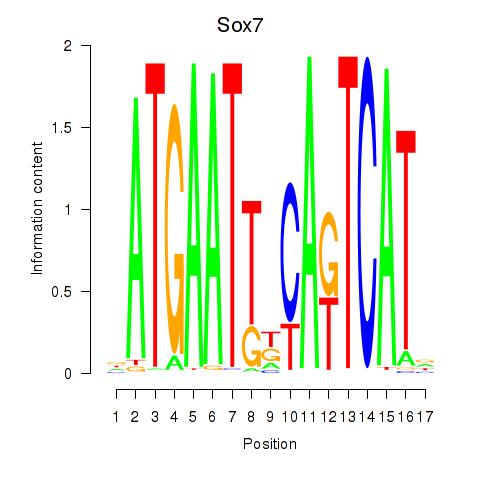
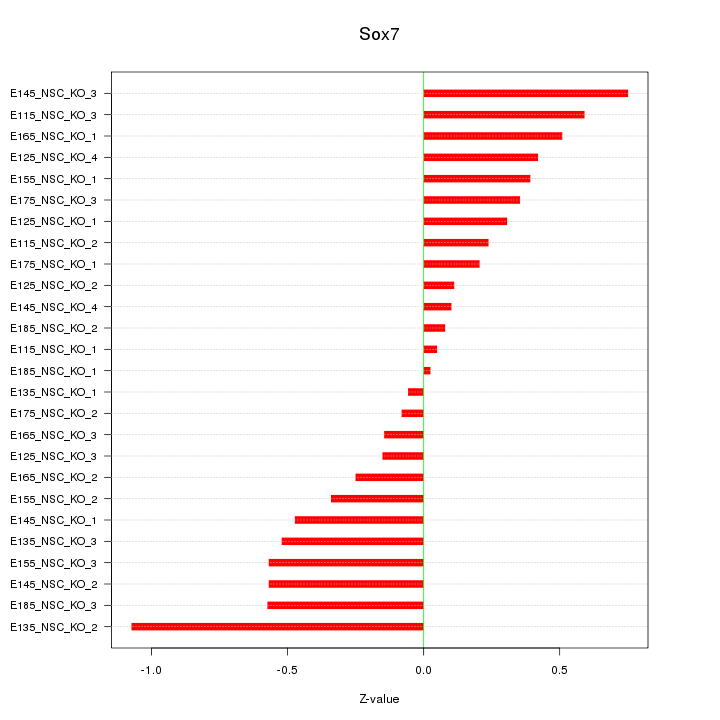
Motif ID: Sox7

Z-value: 0.426


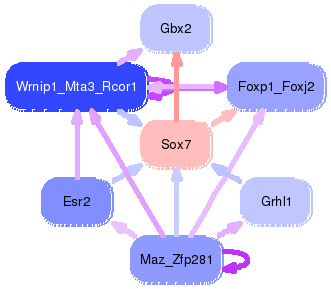
Transcription factors associated with Sox7:

Gene SymbolEntrez IDGene Name
Sox7 ENSMUSG00000063060.5 Sox7

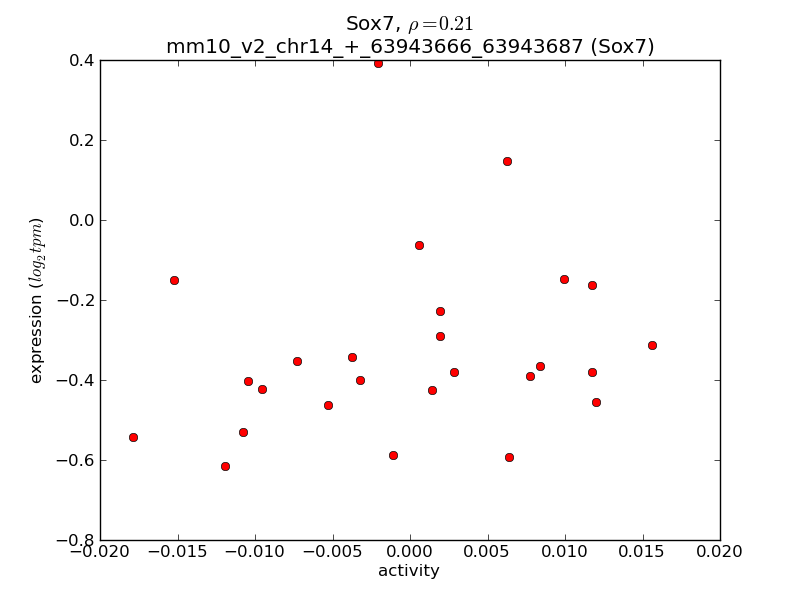
Activity-expression correlation:

Gene SymbolPromoterPearson corr. coef.P-valuePlot
Sox7mm10_v2_chr14_+_63943666_639436870.213.1e-01Click!


Activity profile for motif Sox7.

activity profile for motif Sox7


Sorted Z-values histogram for motif Sox7

Sorted Z-values for motif Sox7


Network of associatons between targets according to the STRING database.


First level regulatory network of Sox7

PNG image of the network

In order to view interactive SVG image please either update your browser to latest version or install SVG plugin.


View svg image
View png image


Top targets:


Showing 1 to 20 of 28 entries
PromoterScoreRefseqGene SymbolGene Name
chrX_+_103422010 4.800 ENSMUST00000182089.1
Gm26992
predicted gene, 26992
chr12_+_109734969 0.960 ENSMUST00000182268.1
ENSMUST00000181543.2
ENSMUST00000183116.1
Mirg


miRNA containing gene


chr1_-_89933290 0.892 ENSMUST00000036954.7
Gbx2
gastrulation brain homeobox 2
chr8_+_106935720 0.530 ENSMUST00000047425.3
Sntb2
syntrophin, basic 2
chr7_+_30650385 0.445 ENSMUST00000181529.1
Gm26610
predicted gene, 26610
chr7_-_14562171 0.304 ENSMUST00000181796.1
Vmn1r90
vomeronasal 1 receptor 90
chr6_-_99266494 0.235 ENSMUST00000113326.2
Foxp1
forkhead box P1
chr9_+_50575273 0.232 ENSMUST00000059081.6
ENSMUST00000180021.1
Il18

interleukin 18

chr15_+_16778101 0.231 ENSMUST00000026432.6
Cdh9
cadherin 9
chr2_-_6130117 0.200 ENSMUST00000126551.1
ENSMUST00000054254.5
ENSMUST00000114942.2
Proser2


proline and serine rich 2


chr10_+_7667503 0.181 ENSMUST00000040135.8
Nup43
nucleoporin 43
chr11_-_46166397 0.133 ENSMUST00000020679.2
Nipal4
NIPA-like domain containing 4
chr2_+_15055274 0.127 ENSMUST00000069870.3
Arl5b
ADP-ribosylation factor-like 5B
chr18_-_77047243 0.114 ENSMUST00000137354.1
ENSMUST00000137498.1
Katnal2

katanin p60 subunit A-like 2

chr10_-_69212996 0.113 ENSMUST00000170048.1
A930033H14Rik
RIKEN cDNA A930033H14 gene
chr7_-_99182681 0.100 ENSMUST00000033001.4
Dgat2
diacylglycerol O-acyltransferase 2
chr18_+_12741324 0.099 ENSMUST00000115857.2
ENSMUST00000121018.1
ENSMUST00000119108.1
Cabyr


calcium-binding tyrosine-(Y)-phosphorylation regulated (fibrousheathin 2)


chr6_+_48684570 0.092 ENSMUST00000067506.7
ENSMUST00000119575.1
ENSMUST00000114527.2
ENSMUST00000121957.1
ENSMUST00000090070.5
Gimap4


GTPase, IMAP family member 4


chr14_+_64652524 0.072 ENSMUST00000100473.4
Kif13b
kinesin family member 13B
chr16_+_8637674 0.048 ENSMUST00000023396.9
Pmm2
phosphomannomutase 2

Gene Ontology Analysis

Gene overrepresentation in biological_process category:

Showing 1 to 5 of 5 entries
Log-likelihood per target Total log-likelihoodTermDescription
0.1 0.9 GO:0021555 midbrain-hindbrain boundary morphogenesis(GO:0021555)
0.1 0.2 GO:0001866 NK T cell proliferation(GO:0001866) regulation of natural killer cell proliferation(GO:0032817) positive regulation of natural killer cell proliferation(GO:0032819)
0.0 0.2 GO:0032625 interleukin-21 production(GO:0032625) interleukin-21 secretion(GO:0072619)
0.0 0.1 GO:0035356 cellular triglyceride homeostasis(GO:0035356)
0.0 0.0 GO:0009298 GDP-mannose biosynthetic process(GO:0009298)

Gene overrepresentation in cellular_component category:

Showing 1 to 1 of 1 entries
Log-likelihood per target Total log-likelihoodTermDescription
0.0 0.2 GO:0031080 nuclear pore outer ring(GO:0031080)

Gene overrepresentation in molecular_function category:

Showing 1 to 2 of 2 entries
Log-likelihood per target Total log-likelihoodTermDescription
0.0 0.1 GO:0003846 2-acylglycerol O-acyltransferase activity(GO:0003846)
0.0 0.1 GO:0008568 microtubule-severing ATPase activity(GO:0008568)