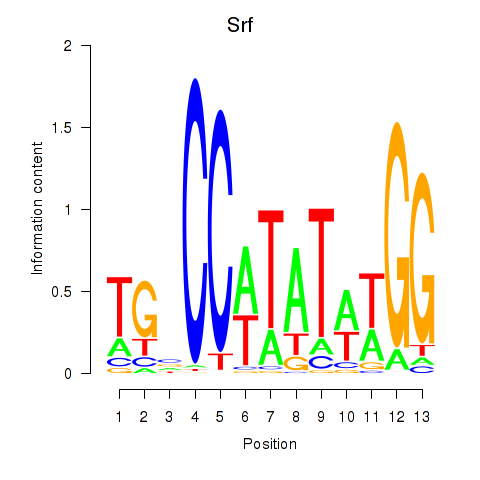
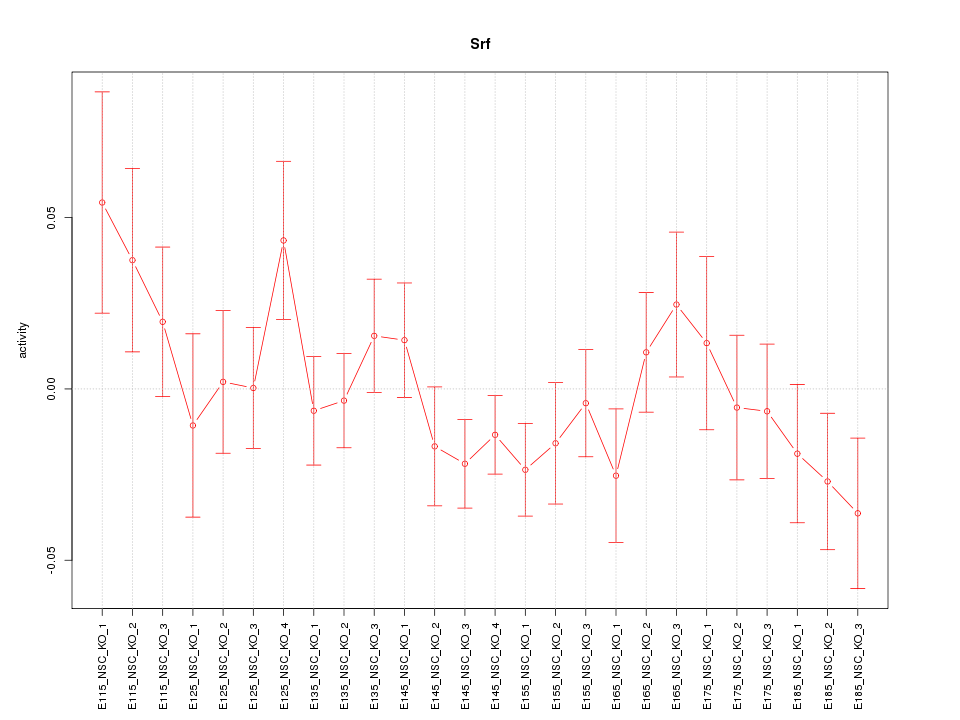
Motif ID: Srf
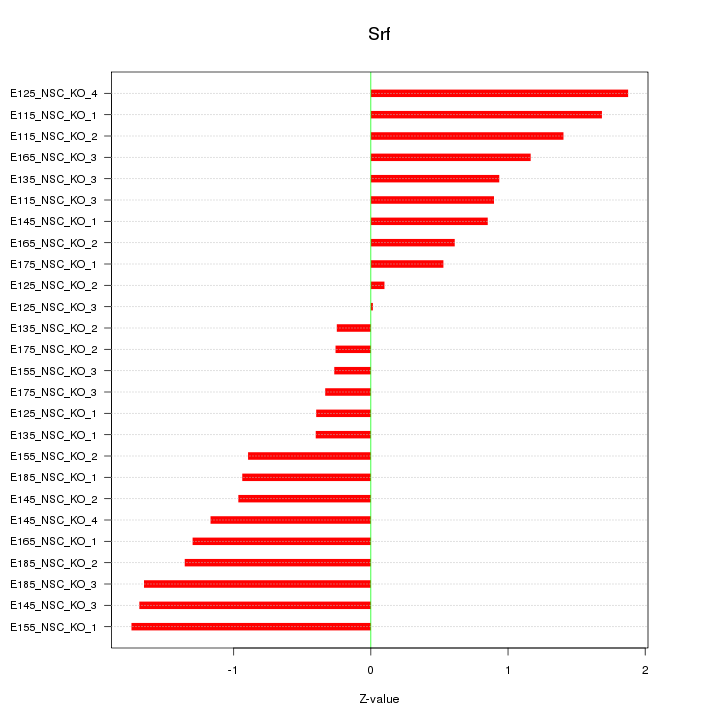
Z-value: 1.066
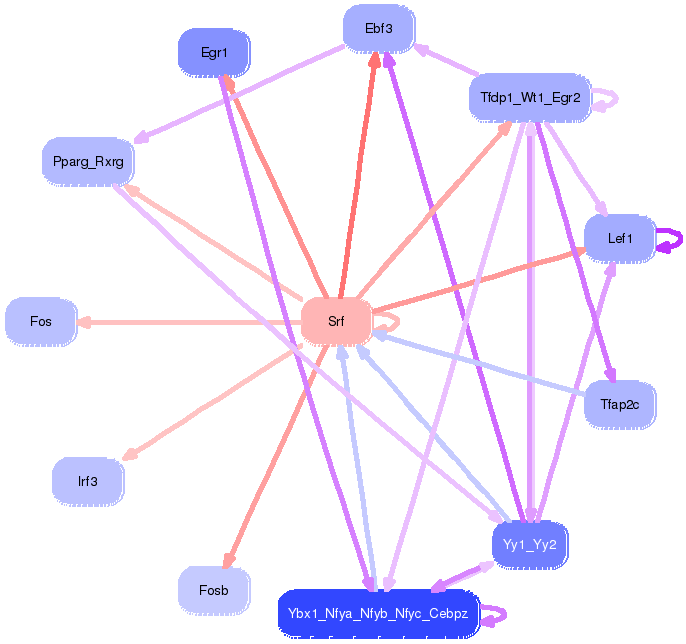
Transcription factors associated with Srf:
| Gene Symbol | Entrez ID | Gene Name |
|---|---|---|
| Srf | ENSMUSG00000015605.5 | Srf |
Activity-expression correlation:
| Gene Symbol | Promoter | Pearson corr. coef. | P-value | Plot |
|---|---|---|---|---|
| Srf | mm10_v2_chr17_-_46556158_46556188 | 0.28 | 1.7e-01 | Click! |

Top targets:
Gene overrepresentation in biological_process category:
| Log-likelihood per target | Total log-likelihood | Term | Description |
|---|---|---|---|
| 1.4 | 6.8 | GO:0030091 | protein repair(GO:0030091) |
| 1.2 | 7.4 | GO:0021797 | forebrain anterior/posterior pattern specification(GO:0021797) |
| 0.7 | 2.0 | GO:0072223 | metanephric glomerular mesangium development(GO:0072223) metanephric glomerular mesangial cell proliferation involved in metanephros development(GO:0072262) |
| 0.6 | 1.8 | GO:0048352 | neural plate mediolateral regionalization(GO:0021998) mesoderm structural organization(GO:0048338) paraxial mesoderm structural organization(GO:0048352) |
| 0.6 | 1.8 | GO:2000393 | negative regulation of lamellipodium morphogenesis(GO:2000393) |
| 0.6 | 1.8 | GO:0032696 | negative regulation of interleukin-13 production(GO:0032696) trachea submucosa development(GO:0061152) trachea gland development(GO:0061153) odontoblast differentiation(GO:0071895) regulation of estrogen receptor binding(GO:0071898) negative regulation of estrogen receptor binding(GO:0071899) |
| 0.5 | 1.5 | GO:0010814 | substance P catabolic process(GO:0010814) calcitonin catabolic process(GO:0010816) endothelin maturation(GO:0034959) |
| 0.5 | 1.5 | GO:1900275 | negative regulation of phospholipase C activity(GO:1900275) |
| 0.4 | 2.2 | GO:0048133 | germ-line stem cell division(GO:0042078) male germ-line stem cell asymmetric division(GO:0048133) germline stem cell asymmetric division(GO:0098728) |
| 0.4 | 1.3 | GO:0097623 | potassium ion export across plasma membrane(GO:0097623) |
| 0.4 | 1.3 | GO:0007525 | somatic muscle development(GO:0007525) |
| 0.4 | 4.0 | GO:1902166 | negative regulation of intrinsic apoptotic signaling pathway in response to DNA damage by p53 class mediator(GO:1902166) |
| 0.3 | 1.2 | GO:0051295 | establishment of meiotic spindle localization(GO:0051295) |
| 0.3 | 1.7 | GO:0045583 | regulation of cytotoxic T cell differentiation(GO:0045583) positive regulation of cytotoxic T cell differentiation(GO:0045585) |
| 0.2 | 0.6 | GO:1901228 | positive regulation of transcription from RNA polymerase II promoter involved in heart development(GO:1901228) |
| 0.2 | 1.2 | GO:0021593 | rhombomere morphogenesis(GO:0021593) |
| 0.2 | 1.5 | GO:0038028 | insulin receptor signaling pathway via phosphatidylinositol 3-kinase(GO:0038028) |
| 0.2 | 0.7 | GO:0060025 | regulation of synaptic activity(GO:0060025) |
| 0.2 | 0.5 | GO:0006116 | NADH oxidation(GO:0006116) |
| 0.1 | 1.9 | GO:1903504 | regulation of mitotic cell cycle spindle assembly checkpoint(GO:0090266) regulation of mitotic spindle checkpoint(GO:1903504) |
| 0.1 | 0.8 | GO:0042535 | positive regulation of tumor necrosis factor biosynthetic process(GO:0042535) |
| 0.1 | 1.0 | GO:0071361 | cellular response to ethanol(GO:0071361) |
| 0.1 | 3.8 | GO:0001706 | endoderm formation(GO:0001706) |
| 0.1 | 0.9 | GO:0003161 | cardiac conduction system development(GO:0003161) |
| 0.1 | 0.8 | GO:0006450 | regulation of translational fidelity(GO:0006450) |
| 0.1 | 0.3 | GO:0045358 | negative regulation of interferon-beta biosynthetic process(GO:0045358) |
| 0.1 | 1.3 | GO:0050765 | negative regulation of phagocytosis(GO:0050765) |
| 0.1 | 0.4 | GO:0031033 | myosin filament organization(GO:0031033) |
| 0.1 | 0.4 | GO:0048739 | cardiac muscle fiber development(GO:0048739) |
| 0.1 | 2.3 | GO:0010718 | positive regulation of epithelial to mesenchymal transition(GO:0010718) |
| 0.1 | 0.4 | GO:0006488 | dolichol-linked oligosaccharide biosynthetic process(GO:0006488) |
| 0.0 | 0.4 | GO:0090043 | regulation of tubulin deacetylation(GO:0090043) |
| 0.0 | 1.9 | GO:0071277 | cellular response to calcium ion(GO:0071277) |
| 0.0 | 0.3 | GO:0000972 | transcription-dependent tethering of RNA polymerase II gene DNA at nuclear periphery(GO:0000972) telomere localization(GO:0034397) |
| 0.0 | 0.3 | GO:0008616 | queuosine biosynthetic process(GO:0008616) queuosine metabolic process(GO:0046116) |
| 0.0 | 0.3 | GO:0043517 | positive regulation of DNA damage response, signal transduction by p53 class mediator(GO:0043517) |
| 0.0 | 0.5 | GO:0045722 | positive regulation of gluconeogenesis(GO:0045722) |
| 0.0 | 0.2 | GO:0007096 | regulation of exit from mitosis(GO:0007096) |
| 0.0 | 1.4 | GO:0007052 | mitotic spindle organization(GO:0007052) |
| 0.0 | 0.3 | GO:1901522 | positive regulation of transcription from RNA polymerase II promoter involved in cellular response to chemical stimulus(GO:1901522) |
| 0.0 | 0.7 | GO:0061077 | chaperone-mediated protein folding(GO:0061077) |
Gene overrepresentation in cellular_component category:
| Log-likelihood per target | Total log-likelihood | Term | Description |
|---|---|---|---|
| 0.4 | 2.2 | GO:0016602 | CCAAT-binding factor complex(GO:0016602) |
| 0.3 | 1.7 | GO:0097226 | sperm mitochondrial sheath(GO:0097226) |
| 0.3 | 1.5 | GO:0033093 | Weibel-Palade body(GO:0033093) |
| 0.2 | 1.2 | GO:0005826 | actomyosin contractile ring(GO:0005826) |
| 0.2 | 1.8 | GO:1990907 | beta-catenin-TCF complex(GO:1990907) |
| 0.2 | 1.3 | GO:0070938 | contractile ring(GO:0070938) |
| 0.1 | 0.3 | GO:0044614 | nuclear pore cytoplasmic filaments(GO:0044614) |
| 0.1 | 1.0 | GO:0030285 | integral component of synaptic vesicle membrane(GO:0030285) intrinsic component of synaptic vesicle membrane(GO:0098563) |
| 0.1 | 1.9 | GO:0005680 | anaphase-promoting complex(GO:0005680) |
| 0.1 | 0.4 | GO:0005853 | eukaryotic translation elongation factor 1 complex(GO:0005853) |
| 0.1 | 2.0 | GO:0090544 | BAF-type complex(GO:0090544) |
| 0.0 | 0.5 | GO:0005682 | U5 snRNP(GO:0005682) |
| 0.0 | 0.7 | GO:0002102 | podosome(GO:0002102) |
| 0.0 | 0.4 | GO:0005671 | Ada2/Gcn5/Ada3 transcription activator complex(GO:0005671) |
| 0.0 | 2.8 | GO:0005901 | caveola(GO:0005901) |
| 0.0 | 1.8 | GO:0032587 | ruffle membrane(GO:0032587) |
| 0.0 | 1.4 | GO:0000794 | condensed nuclear chromosome(GO:0000794) |
| 0.0 | 1.5 | GO:0001726 | ruffle(GO:0001726) |
| 0.0 | 0.6 | GO:0016459 | myosin complex(GO:0016459) |
| 0.0 | 3.2 | GO:0000139 | Golgi membrane(GO:0000139) |
Gene overrepresentation in molecular_function category:
| Log-likelihood per target | Total log-likelihood | Term | Description |
|---|---|---|---|
| 1.0 | 6.8 | GO:0070191 | methionine-R-sulfoxide reductase activity(GO:0070191) |
| 0.4 | 1.3 | GO:1902282 | voltage-gated potassium channel activity involved in ventricular cardiac muscle cell action potential repolarization(GO:1902282) |
| 0.3 | 1.8 | GO:0098821 | BMP receptor activity(GO:0098821) |
| 0.3 | 1.8 | GO:0030284 | estrogen receptor activity(GO:0030284) |
| 0.3 | 1.7 | GO:0002135 | CTP binding(GO:0002135) |
| 0.2 | 1.4 | GO:0008239 | dipeptidyl-peptidase activity(GO:0008239) |
| 0.2 | 1.4 | GO:0005087 | Ran guanyl-nucleotide exchange factor activity(GO:0005087) |
| 0.1 | 0.6 | GO:0070878 | primary miRNA binding(GO:0070878) |
| 0.1 | 1.2 | GO:0043495 | protein anchor(GO:0043495) |
| 0.1 | 1.5 | GO:0070097 | delta-catenin binding(GO:0070097) |
| 0.1 | 0.5 | GO:0004090 | carbonyl reductase (NADPH) activity(GO:0004090) |
| 0.1 | 2.0 | GO:1990841 | promoter-specific chromatin binding(GO:1990841) |
| 0.1 | 3.8 | GO:0017017 | MAP kinase tyrosine/serine/threonine phosphatase activity(GO:0017017) |
| 0.1 | 1.3 | GO:0017166 | vinculin binding(GO:0017166) |
| 0.1 | 1.5 | GO:0043539 | protein serine/threonine kinase activator activity(GO:0043539) |
| 0.1 | 0.5 | GO:0008420 | CTD phosphatase activity(GO:0008420) |
| 0.1 | 0.2 | GO:0051377 | mannose-ethanolamine phosphotransferase activity(GO:0051377) |
| 0.0 | 0.3 | GO:0005173 | stem cell factor receptor binding(GO:0005173) |
| 0.0 | 4.0 | GO:0002039 | p53 binding(GO:0002039) |
| 0.0 | 0.4 | GO:0005523 | tropomyosin binding(GO:0005523) |
| 0.0 | 0.3 | GO:0008479 | queuine tRNA-ribosyltransferase activity(GO:0008479) |
| 0.0 | 0.8 | GO:0009931 | calcium-dependent protein serine/threonine kinase activity(GO:0009931) |
| 0.0 | 1.2 | GO:0071837 | HMG box domain binding(GO:0071837) |
| 0.0 | 2.2 | GO:0035064 | methylated histone binding(GO:0035064) |
| 0.0 | 0.4 | GO:0008307 | structural constituent of muscle(GO:0008307) |
| 0.0 | 12.9 | GO:0000978 | RNA polymerase II core promoter proximal region sequence-specific DNA binding(GO:0000978) |
| 0.0 | 0.4 | GO:0016151 | nickel cation binding(GO:0016151) |
| 0.0 | 0.3 | GO:0004886 | 9-cis retinoic acid receptor activity(GO:0004886) |
| 0.0 | 0.8 | GO:0002161 | aminoacyl-tRNA editing activity(GO:0002161) |
| 0.0 | 1.5 | GO:0015459 | potassium channel regulator activity(GO:0015459) |
| 0.0 | 0.9 | GO:0030552 | cAMP binding(GO:0030552) |
| 0.0 | 0.7 | GO:0051879 | Hsp90 protein binding(GO:0051879) |
| 0.0 | 1.8 | GO:0008013 | beta-catenin binding(GO:0008013) |
| 0.0 | 1.5 | GO:0004222 | metalloendopeptidase activity(GO:0004222) |
| 0.0 | 0.3 | GO:0017056 | structural constituent of nuclear pore(GO:0017056) |
| 0.0 | 1.8 | GO:0005178 | integrin binding(GO:0005178) |
| 0.0 | 0.4 | GO:0016922 | ligand-dependent nuclear receptor binding(GO:0016922) |
| 0.0 | 0.4 | GO:0003746 | translation elongation factor activity(GO:0003746) |
| 0.0 | 1.2 | GO:0051087 | chaperone binding(GO:0051087) |
| 0.0 | 0.1 | GO:0022841 | potassium ion leak channel activity(GO:0022841) |