Project
GSE80451: E.coli grown aerobically and anaerobically
Navigation
Downloads
Results for IHF
Z-value: 1.12
Transcription factors associated with IHF
| Gene Symbol | Gene ID | Gene Info |
|---|---|---|
|
infA
|
infA | integration host factor subunit alpha |
|
infB
|
infB | integration host factor subunit beta |
Activity-expression correlation:
Activity profile of IHF motif
Sorted Z-values of IHF motif
| Promoter | Log-likelihood | Transcript | Gene | Gene Info |
|---|---|---|---|---|
| osmY | 3.20 |
osmY
|
periplasmic chaperone, osmotically induced |
|
| ompC | 2.70 |
ompC
|
outer membrane protein C |
|
| sodA | 2.30 |
sodA
|
superoxide dismutase (Mn) |
|
| narK | 2.29 |
narK
|
nitrate:nitrite antiporter NarK |
|
| ihfA | 2.09 |
ihfA
|
integration host factor (IHF), α subunit |
|
| osmE | 1.94 |
osmE
|
osmotically inducible protein OsmE |
|
| uspB | 1.90 |
uspB
|
predicted universal stress (ethanol tolerance) protein B |
|
| dps | 1.78 |
dps
|
stationary phase nucleoid protein that sequesters iron and protects DNA from damage |
|
| mtr | 1.76 |
mtr
|
tryptohan / indole:H+ symporter Mtr |
|
| sufABCDSE | 1.67 |
sufB
sufC
sufA
sufD
sufE
sufS
|
SufB component of SufBCD Fe-S cluster scaffold complex SufC component of SufBCD Fe-S cluster scaffold complex Fe-S transport protein in Fe-S cluster assembly SufD component of SufBCD Fe-S cluster scaffold complex sulfur acceptor for SufS cysteine desulfurase L-cysteine desulfurase |
|
| fnr | 1.39 |
fnr
|
FNR DNA-binding transcriptional dual regulator |
|
| gcd | 1.32 |
gcd
|
quinoprotein glucose dehydrogenase |
|
| narGHJI | 1.31 |
narG
narI
narH
narJ
|
nitrate reductase A, α subunit nitrate reductase A, γ subunit nitrate reductase A, β subunit molybdenum cofactor assembly chaperone subunit (δ subunit) of nitrate reductase 1 |
|
| yjbE | 1.29 |
yjbE
|
predicted protein |
|
| pspG | 1.27 |
pspG
|
phage shock protein G |
|
| ndh | 1.19 |
ndh
|
NADH:quinone oxidoreductase II |
|
| folA | 1.19 |
folA
|
dihydrofolate reductase |
|
| patA | 1.11 |
patA
|
putrescine aminotransferase |
|
| rtcBA | 0.89 |
rtcB
rtcA
|
RNA-splicing ligase RtcB RNA 3'-terminal phosphate cyclase |
|
| focA-pflB | 0.86 |
focA
pflB
|
formate channel FocA pyruvate formate-lyase (inactive) |
|
| glmY | 0.79 |
glmY
|
GlmY |
|
| yjbEFGH | 0.78 |
yjbG
yjbF
yjbE
yjbH
|
conserved protein predicted lipoprotein predicted protein predicted porin |
|
| glcDEFGBA | 0.72 |
glcD
glcE
glcF
glcG
glcA
glcB
|
glycolate oxidase, predicted FAD-linked subunit glycolate oxidase, predicted FAD-binding subunit glycolate oxidase, predicted iron-sulfur subunit conserved protein glycolate / lactate:H+ symporter malate synthase G |
|
| fimAICDFGH | 0.62 |
fimA
fimC
fimD
fimF
fimG
fimH
fimI
|
major type 1 subunit fimbrin (pilin) periplasmic chaperone, required for type 1 fimbriae outer membrane protein; export and assembly of type 1 fimbriae fimbrial morphology fimbrial morphology minor fimbrial subunit, D-mannose specific adhesin fimbrial protein |
|
| hycABCDEFGHI | 0.52 |
hycD
hycE
hycF
hycG
hycA
hycB
hycC
hycH
hycI
|
hydrogenase 3, membrane subunit hydrogenase 3, large subunit formate hydrogenlyase complex iron-sulfur protein hydrogenase 3 and formate hydrogenlyase complex, HycG subunit regulator of the transcriptional regulator FhlA hydrogenase 3, Fe-S subunit hydrogenase 3, membrane subunit protein required for maturation of hydrogenase 3 hydrogenase 3 maturation protease |
|
| hipBA | 0.49 |
hipA
hipB
|
serine/threonine kinase HipA HipB antitoxin and DNA-binding transcriptional repressor |
|
| ulaG | 0.46 |
ulaG
|
L-ascorbate 6-phosphate lactonase |
|
| nuoABCEFGHIJKLMN | 0.46 |
nuoB
nuoC
nuoA
nuoF
nuoG
nuoE
nuoJ
nuoK
nuoH
nuoI
nuoN
nuoL
nuoM
|
NADH:ubiquinone oxidoreductase, chain B NADH:ubiquinone oxidoreductase, chain CD NADH:ubiquinone oxidoreductase, membrane subunit A NADH:ubiquinone oxidoreductase, chain F NADH:ubiquinone oxidoreductase, chain G NADH:ubiquinone oxidoreductase, chain E NADH:ubiquinone oxidoreductase, membrane subunit J NADH:ubiquinone oxidoreductase, membrane subunit K NADH:ubiquinone oxidoreductase, membrane subunit H NADH:ubiquinone oxidoreductase, chain I NADH:ubiquinone oxidoreductase, membrane subunit N NADH:ubiquinone oxidoreductase, membrane subunit L NADH:ubiquinone oxidoreductase, membrane subunit M |
|
| acs-yjcH-actP | 0.38 |
acs
actP
yjcH
|
acetyl-CoA synthetase (AMP-forming) acetate / glycolate : cation symporter conserved inner membrane protein |
|
| ompR-envZ | 0.34 |
envZ
ompR
|
EnvZ OmpR transcriptional dual regulator |
|
| cysJIH | 0.33 |
cysI
cysH
cysJ
|
sulfite reductase, hemoprotein subunit 3'-phospho-adenylylsulfate reductase sulfite reductase, flavoprotein subunit |
|
| ibpB | 0.28 |
ibpB
|
small heat shock protein IbpB |
|
| hypABCDE-fhlA | 0.28 |
fhlA
hypE
hypD
hypA
hypC
hypB
|
FhlA transcriptional activator hydrogenase maturation protein, carbamoyl dehydratase HypD, scaffold protein for assembly of the Fe-(CN)2CO cofactor accessory protein for nickel incorporation into hydrogenase 3 HypC, protein involved in hydrogenase 3 maturation accessory protein for nickel incorporation into hydrogenase isoenzymes |
|
| glnHPQ | 0.27 |
glnH
glnQ
glnP
|
L-glutamine ABC transporter - periplasmic binding protein L-glutamine ABC transporter - ATP binding subunit L-glutamine ABC transporter - membrane subunit |
|
| dusB-fis | 0.26 |
fis
dusB
|
Fis DNA-binding transcriptional dual regulator tRNA-dihydrouridine synthase B |
|
| amiA-hemF | 0.21 |
hemF
amiA
|
coproporphyrinogen III oxidase N-acetylmuramoyl-L-alanine amidase A |
|
| hypABCDE | 0.20 |
hypE
hypD
hypA
hypC
hypB
|
hydrogenase maturation protein, carbamoyl dehydratase HypD, scaffold protein for assembly of the Fe-(CN)2CO cofactor accessory protein for nickel incorporation into hydrogenase 3 HypC, protein involved in hydrogenase 3 maturation accessory protein for nickel incorporation into hydrogenase isoenzymes |
|
| dmsABC | 0.19 |
dmsA
dmsB
dmsC
|
dimethyl sulfoxide reductase, chain A dimethyl sulfoxide reductase, chain B dimethyl sulfoxide reductase, chain C |
|
| sodB | 0.19 |
sodB
|
superoxide dismutase (Fe) |
|
| uspA | 0.08 |
uspA
|
universal stress global stress response regulator |
|
| ulaABCDEF | 0.07 |
ulaD
ulaE
ulaF
ulaA
ulaB
ulaC
|
3-keto-L-gulonate 6-phosphate decarboxylase L-xylulose 5-phosphate 3-epimerase L-ribulose 5-phosphate 4-epimerase L-ascorbate PTS permease - UlaA subunit L-ascorbate PTS permease - UlaB subunit L-ascorbate PTS permease - UlaC subunit |
|
| nirBDC-cysG | 0.00 |
nirD
cysG
nirC
nirB
|
nitrite reductase, small subunit siroheme synthase subunit nitrite transporter NirC nitrite reductase, large subunit |
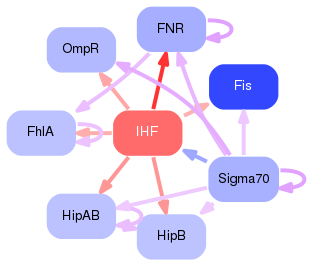
Network of associatons between targets according to the STRING database.

First level regulatory network of IHF
Gene Ontology Analysis
Gene overrepresentation in biological process category:
| Log-likelihood per target | Total log-likelihood | Term | Description |
|---|---|---|---|
| 0.8 | 2.5 | GO:0006801 | response to superoxide(GO:0000303) superoxide metabolic process(GO:0006801) |
| 0.8 | 2.3 | GO:0015707 | nitrite transport(GO:0015707) |
| 0.7 | 2.1 | GO:0046379 | extracellular polysaccharide biosynthetic process(GO:0045226) extracellular polysaccharide metabolic process(GO:0046379) |
| 0.6 | 1.9 | GO:0097305 | response to alcohol(GO:0097305) |
| 0.6 | 1.8 | GO:0015827 | tryptophan transport(GO:0015827) |
| 0.4 | 1.3 | GO:0006007 | glucose catabolic process(GO:0006007) |
| 0.4 | 1.3 | GO:0071941 | nitrogen cycle metabolic process(GO:0071941) |
| 0.4 | 1.2 | GO:0043207 | response to biotic stimulus(GO:0009607) response to virus(GO:0009615) response to external biotic stimulus(GO:0043207) response to other organism(GO:0051707) |
| 0.3 | 3.1 | GO:0006972 | hyperosmotic response(GO:0006972) |
| 0.3 | 1.3 | GO:0015748 | organophosphate ester transport(GO:0015748) |
| 0.3 | 1.2 | GO:0019646 | aerobic electron transport chain(GO:0019646) |
| 0.3 | 1.7 | GO:0097428 | protein maturation by iron-sulfur cluster transfer(GO:0097428) |
| 0.2 | 1.2 | GO:0046654 | tetrahydrofolate biosynthetic process(GO:0046654) |
| 0.2 | 0.9 | GO:0042245 | RNA repair(GO:0042245) |
| 0.2 | 0.6 | GO:0009297 | pilus assembly(GO:0009297) |
| 0.2 | 2.3 | GO:0006970 | response to osmotic stress(GO:0006970) |
| 0.2 | 0.4 | GO:0043687 | post-translational protein modification(GO:0043687) |
| 0.2 | 1.1 | GO:0009447 | polyamine catabolic process(GO:0006598) putrescine catabolic process(GO:0009447) |
| 0.2 | 0.5 | GO:1902600 | hydrogen ion transmembrane transport(GO:1902600) |
| 0.1 | 0.7 | GO:0034308 | primary alcohol metabolic process(GO:0034308) |
| 0.1 | 0.5 | GO:0018249 | protein dehydration(GO:0018249) peptidyl-S-carbamoyl-L-cysteine dehydration(GO:0046892) |
| 0.1 | 0.5 | GO:0016485 | protein processing(GO:0016485) |
| 0.1 | 0.5 | GO:0036289 | dormancy process(GO:0022611) peptidyl-serine autophosphorylation(GO:0036289) |
| 0.1 | 1.2 | GO:0009061 | anaerobic respiration(GO:0009061) |
| 0.1 | 0.9 | GO:0015718 | monocarboxylic acid transport(GO:0015718) |
| 0.1 | 0.3 | GO:1990169 | stress response to copper ion(GO:1990169) |
| 0.1 | 0.2 | GO:0097237 | cellular response to antibiotic(GO:0071236) cellular response to toxic substance(GO:0097237) |
| 0.0 | 1.3 | GO:0042594 | response to starvation(GO:0042594) |
| 0.0 | 0.3 | GO:0051276 | chromosome organization(GO:0051276) |
| 0.0 | 0.5 | GO:0006767 | water-soluble vitamin metabolic process(GO:0006767) |
| 0.0 | 0.3 | GO:0006790 | sulfur compound metabolic process(GO:0006790) |
Gene overrepresentation in cellular component category:
| Log-likelihood per target | Total log-likelihood | Term | Description |
|---|---|---|---|
| 0.4 | 1.3 | GO:0031235 | intrinsic component of the cytoplasmic side of the plasma membrane(GO:0031235) |
| 0.4 | 3.5 | GO:0045203 | integral component of cell outer membrane(GO:0045203) |
| 0.2 | 0.6 | GO:0042995 | cell projection(GO:0042995) |
| 0.1 | 0.5 | GO:0098803 | respiratory chain(GO:0070469) plasma membrane respiratory chain(GO:0070470) respiratory chain complex(GO:0098803) |
| 0.1 | 0.2 | GO:0031237 | intrinsic component of periplasmic side of plasma membrane(GO:0031237) |
| 0.1 | 0.3 | GO:0044427 | chromosome(GO:0005694) chromosomal part(GO:0044427) |
| 0.0 | 0.4 | GO:0031234 | extrinsic component of cytoplasmic side of plasma membrane(GO:0031234) |
| 0.0 | 0.3 | GO:0009898 | cytoplasmic side of plasma membrane(GO:0009898) cytoplasmic side of membrane(GO:0098562) |
| 0.0 | 1.4 | GO:0030288 | outer membrane-bounded periplasmic space(GO:0030288) |
| 0.0 | 4.2 | GO:0005887 | integral component of plasma membrane(GO:0005887) |
| 0.0 | 2.4 | GO:0005886 | plasma membrane(GO:0005886) |
| 0.0 | 1.4 | GO:0016020 | membrane(GO:0016020) |
Gene overrepresentation in molecular function category:
| Log-likelihood per target | Total log-likelihood | Term | Description |
|---|---|---|---|
| 0.8 | 2.5 | GO:0016721 | superoxide dismutase activity(GO:0004784) oxidoreductase activity, acting on superoxide radicals as acceptor(GO:0016721) |
| 0.8 | 2.3 | GO:0015113 | nitrite transmembrane transporter activity(GO:0015113) |
| 0.6 | 1.8 | GO:0015196 | L-tryptophan transmembrane transporter activity(GO:0015196) |
| 0.5 | 1.6 | GO:0008137 | NADH dehydrogenase (ubiquinone) activity(GO:0008137) NADH dehydrogenase (quinone) activity(GO:0050136) |
| 0.4 | 1.3 | GO:0048039 | oxidoreductase activity, acting on the CH-OH group of donors, quinone or similar compound as acceptor(GO:0016901) ubiquinone binding(GO:0048039) |
| 0.3 | 1.3 | GO:0008940 | nitrate reductase activity(GO:0008940) metallochaperone activity(GO:0016530) |
| 0.3 | 1.6 | GO:0016783 | sulfurtransferase activity(GO:0016783) |
| 0.3 | 1.1 | GO:0043879 | glycolate transmembrane transporter activity(GO:0043879) |
| 0.2 | 1.4 | GO:0016646 | oxidoreductase activity, acting on the CH-NH group of donors, NAD or NADP as acceptor(GO:0016646) |
| 0.2 | 0.6 | GO:0044183 | protein binding involved in protein folding(GO:0044183) |
| 0.1 | 0.5 | GO:0070025 | carbon monoxide binding(GO:0070025) |
| 0.1 | 0.9 | GO:0008028 | monocarboxylic acid transmembrane transporter activity(GO:0008028) |
| 0.1 | 0.2 | GO:0008745 | N-acetylmuramoyl-L-alanine amidase activity(GO:0008745) |
| 0.1 | 0.5 | GO:0016151 | nickel cation binding(GO:0016151) |
| 0.1 | 0.3 | GO:0000156 | phosphorelay response regulator activity(GO:0000156) |
| 0.0 | 0.5 | GO:0052689 | carboxylic ester hydrolase activity(GO:0052689) |
| 0.0 | 1.2 | GO:0005506 | iron ion binding(GO:0005506) |
| 0.0 | 1.1 | GO:0003700 | transcription factor activity, sequence-specific DNA binding(GO:0003700) |
Gene overrepresentation in curated gene sets: REACTOME pathways category:
| Log-likelihood per target | Total log-likelihood | Term | Description |
|---|---|---|---|
| 0.1 | 0.7 | REACTOME METABOLISM OF CARBOHYDRATES | Genes involved in Metabolism of carbohydrates |