|
chr13_-_23775827
|
32.197
|
NM_178189
|
Hist1h2ac
|
histone cluster 1, H2ac
|
|
chr13_+_23838602
|
28.552
|
NM_175664
|
Hist1h2bb
|
histone cluster 1, H2bb
|
|
chr6_+_68375560
|
27.796
|
|
Igkv16-104
|
immunoglobulin kappa variable 16-104
|
|
chr19_-_41069024
|
25.002
|
NM_008528
|
Blnk
|
B-cell linker
|
|
chr19_-_41068625
|
24.088
|
|
Blnk
|
B-cell linker
|
|
chr3_-_96044172
|
23.119
|
NM_013549
NM_178212
|
Hist2h2aa1
Hist2h2aa2
|
histone cluster 2, H2aa1
histone cluster 2, H2aa2
|
|
chr2_-_180008165
|
20.184
|
NM_145851
|
Cables2
|
CDK5 and Abl enzyme substrate 2
|
|
chr3_+_96049419
|
19.403
|
NM_013549
NM_178212
|
Hist2h3c1
Hist2h2aa1
Hist2h2aa2
|
histone cluster 2, H3c1
histone cluster 2, H2aa1
histone cluster 2, H2aa2
|
|
chr6_+_70557402
|
18.267
|
|
|
|
|
chr6_+_67846144
|
17.211
|
|
|
|
|
chr13_-_22127419
|
17.168
|
NM_175659
|
Hist1h2ah
|
histone cluster 1, H2ah
|
|
chr13_-_21879086
|
16.768
|
NM_178184
|
Hist1h2an
|
histone cluster 1, H2an
|
|
chr13_-_22134795
|
16.708
|
NM_178186
|
Hist1h2ag
Hist1h2ai
|
histone cluster 1, H2ag
histone cluster 1, H2ai
|
|
chr6_+_70648433
|
16.690
|
|
Igkv3-2
|
immunoglobulin kappa variable 3-2
|
|
chr19_+_9016335
|
16.526
|
NM_011842
|
Mta2
|
metastasis-associated gene family, member 2
|
|
chr13_-_23663006
|
16.165
|
NM_178187
|
Hist1h2ae
|
histone cluster 1, H2ae
|
|
chr4_+_3605207
|
15.757
|
NM_001111096
NM_010747
|
Lyn
|
Yamaguchi sarcoma viral (v-yes-1) oncogene homolog
|
|
chr19_+_12535268
|
15.202
|
NM_010821
|
Mpeg1
|
macrophage expressed gene 1
|
|
chr13_+_21902235
|
15.101
|
NM_178185
NM_001177544
|
Hist1h2ah
Hist1h2ap
Hist1h2ai
Hist1h2ao
|
histone cluster 1, H2ah
histone cluster 1, H2ap
histone cluster 1, H2ai
histone cluster 1, H2ao
|
|
chr13_+_23666249
|
14.800
|
NM_178188
|
Hist1h2ad
Hist1h2ai
|
histone cluster 1, H2ad
histone cluster 1, H2ai
|
|
chr15_-_74593991
|
14.798
|
NM_010742
|
Ly6d
|
lymphocyte antigen 6 complex, locus D
|
|
chr6_-_69765093
|
14.210
|
|
|
|
|
chr13_-_23677831
|
14.073
|
|
Hist1h2be
|
histone cluster 1, H2be
|
|
chr13_+_21813912
|
14.065
|
NM_178200
|
Hist1h2bm
|
histone cluster 1, H2bm
|
|
chr13_+_22127689
|
13.993
|
NM_175665
|
Hist1h2bk
|
histone cluster 1, H2bk
|
|
chr13_+_23663264
|
13.962
|
NM_178196
|
Hist1h2bg
|
histone cluster 1, H2bg
|
|
chr13_-_23635220
|
13.729
|
NM_178197
|
Hist1h2bh
|
histone cluster 1, H2bh
|
|
chr19_+_9016466
|
13.388
|
|
Mta2
|
metastasis-associated gene family, member 2
|
|
chr13_-_23666058
|
13.285
|
NM_178195
|
Hist1h2bf
|
histone cluster 1, H2bf
|
|
chr11_-_106175797
|
13.213
|
NM_008339
|
Cd79b
|
CD79B antigen
|
|
chr8_+_71404491
|
12.359
|
|
Lpl
|
lipoprotein lipase
|
|
chr17_+_29627697
|
12.201
|
|
Pim1
|
proviral integration site 1
|
|
chr13_+_23776066
|
12.164
|
NM_023422
|
Hist1h2bc
|
histone cluster 1, H2bc
|
|
chr13_+_22135065
|
12.084
|
NM_178198
|
Hist1h2bj
|
histone cluster 1, H2bj
|
|
chr12_-_115286643
|
11.741
|
|
Igh-V11
|
immunoglobulin heavy chain (V11 family)
|
|
chr7_+_129432585
|
11.589
|
NM_008855
|
Prkcb
|
protein kinase C, beta
|
|
chr4_-_106812064
|
11.049
|
|
2210012G02Rik
|
RIKEN cDNA 2210012G02 gene
|
|
chr8_+_71404452
|
10.545
|
NM_008509
|
Lpl
|
lipoprotein lipase
|
|
chr5_-_109987907
|
10.499
|
NM_001164735
NM_016715
|
Crlf2
|
cytokine receptor-like factor 2
|
|
chr13_-_21925343
|
10.224
|
NM_178185
NM_001177544
|
Hist1h2ah
Hist1h2ap
Hist1h2ai
Hist1h2ao
|
histone cluster 1, H2ah
histone cluster 1, H2ap
histone cluster 1, H2ai
histone cluster 1, H2ao
|
|
chr17_+_29627950
|
9.998
|
NM_008842
|
Pim1
|
proviral integration site 1
|
|
chr13_-_24026024
|
9.835
|
NM_175663
|
Hist1h2ba
|
histone cluster 1, H2ba
|
|
chr6_+_123073333
|
9.662
|
NM_001170333
NM_011999
|
Clec4a2
|
C-type lectin domain family 4, member a2
|
|
chr13_+_103483611
|
9.624
|
NM_008533
|
Cd180
|
CD180 antigen
|
|
chr9_+_108893946
|
9.606
|
NM_173019
|
Pfkfb4
|
6-phosphofructo-2-kinase/fructose-2,6-biphosphatase 4
|
|
chr10_+_75411056
|
9.290
|
NM_009514
|
Vpreb3
|
pre-B lymphocyte gene 3
|
|
chr1_-_167865030
|
9.189
|
NM_198933
NM_198934
|
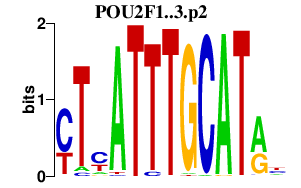
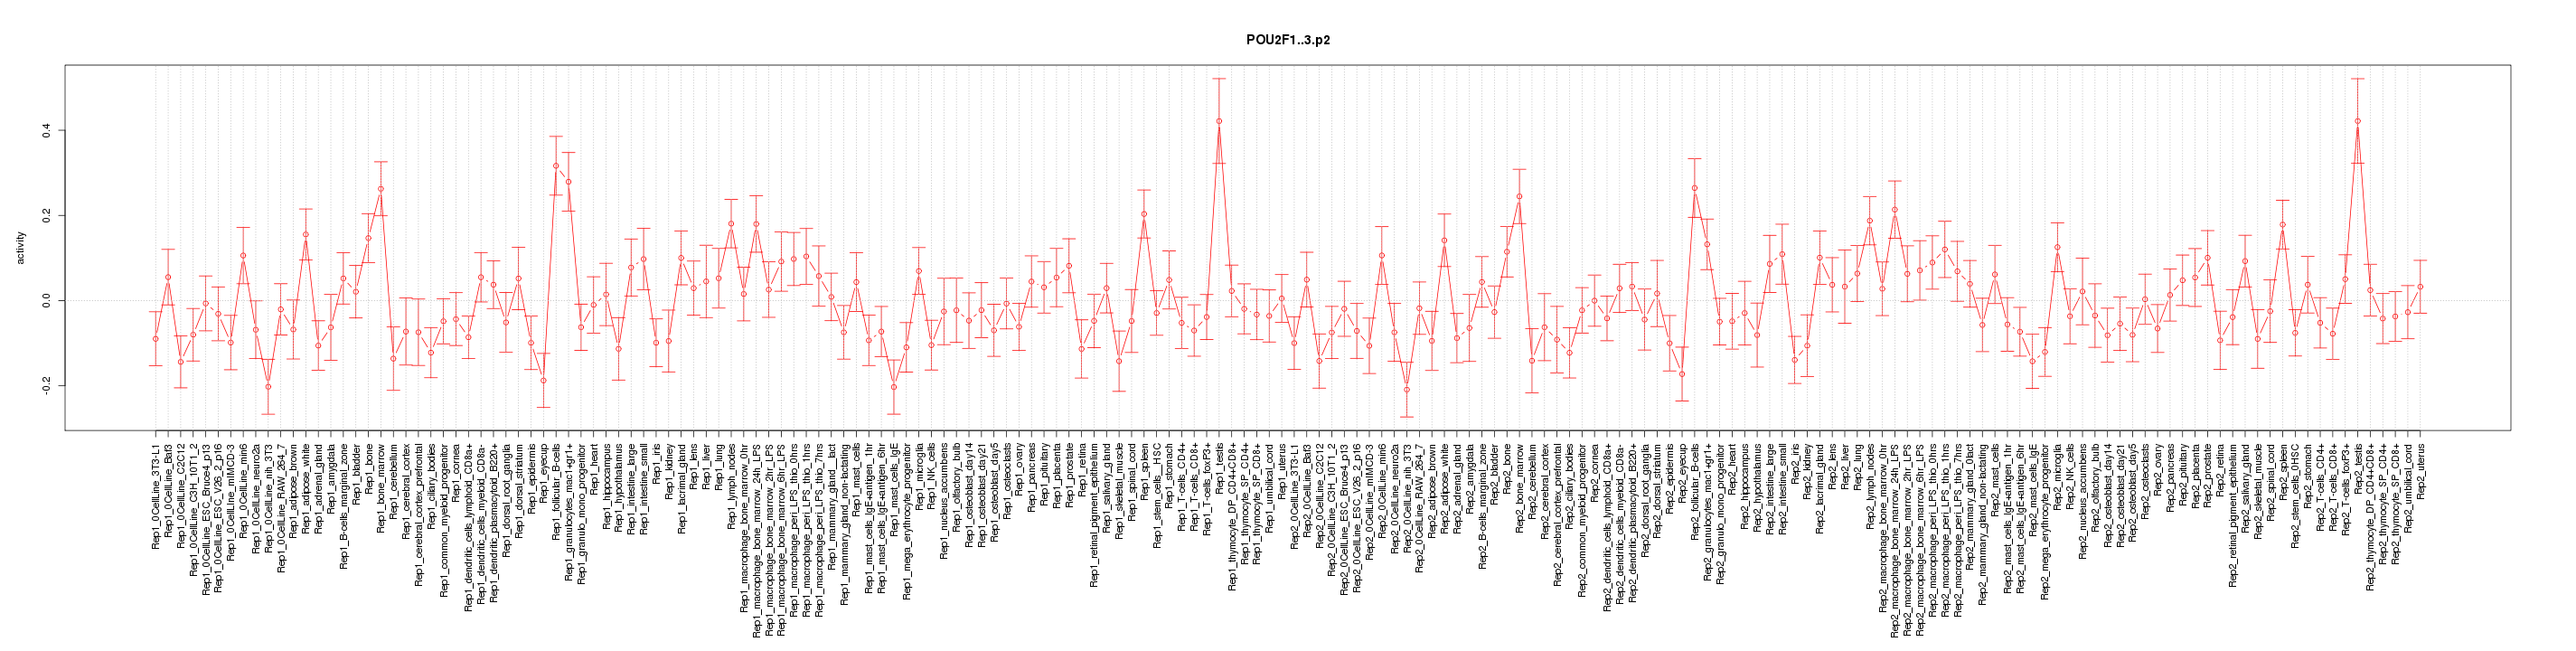
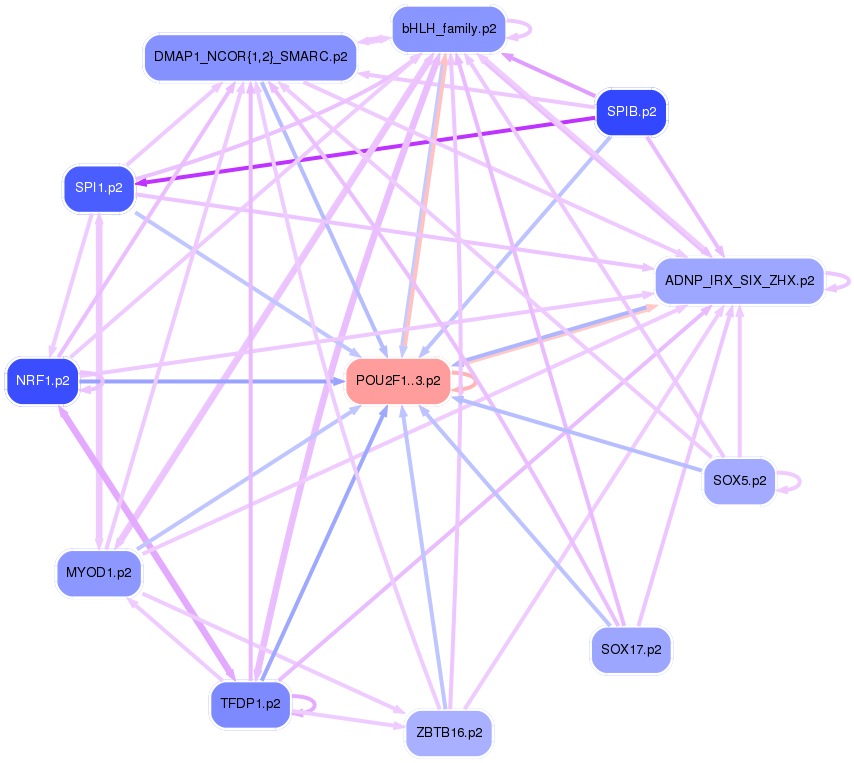
Pou2f1
|
POU domain, class 2, transcription factor 1
|
|
chr11_-_70468061
|
8.894
|
|
Pfn1
|
profilin 1
|
|
chr11_+_33946927
|
8.678
|
|
Lcp2
|
lymphocyte cytosolic protein 2
|
|
chr3_-_96024766
|
8.498
|
NM_175662
|
Hist2h2ac
|
histone cluster 2, H2ac
|
|
chr1_+_133534852
|
8.489
|
NM_007799
|
Ctse
|
cathepsin E
|
|
chr11_-_86621130
|
8.150
|
NM_026191
|
Dhx40
|
DEAH (Asp-Glu-Ala-His) box polypeptide 40
|
|
chrX_-_163647088
|
7.700
|
NM_021278
|
Tmsb4x
|
thymosin, beta 4, X chromosome
|
|
chr15_+_78778153
|
7.540
|
NM_001039155
NM_001039156
NM_138579
|
Triobp
|
TRIO and F-actin binding protein
|
|
chrX_-_163647057
|
7.479
|
|
Tmsb4x
|
thymosin, beta 4, X chromosome
|
|
chr6_-_135197901
|
7.470
|
NM_001080552
|
Gsg1
|
germ cell-specific gene 1
|
|
chr11_-_86621074
|
7.461
|
|
Dhx40
|
DEAH (Asp-Glu-Ala-His) box polypeptide 40
|
|
chr12_-_35213738
|
7.410
|
NM_024124
|
Hdac9
|
histone deacetylase 9
|
|
chr6_+_123073408
|
7.312
|
|
Clec4a2
|
C-type lectin domain family 4, member a2
|
|
chr7_+_132695758
|
7.181
|
NM_001008700
|
Il4ra
|
interleukin 4 receptor, alpha
|
|
chr2_-_3339919
|
7.164
|
NM_008579
|
Meig1
|
meiosis expressed gene 1
|
|
chr1_-_53813191
|
7.046
|
|
|
|
|
chr5_+_123465266
|
6.944
|
|
Orai1
|
ORAI calcium release-activated calcium modulator 1
|
|
chr7_+_133920438
|
6.929
|
NM_025347
NM_026875
|
Ypel3
|
yippee-like 3 (Drosophila)
|
|
chr1_+_6720153
|
6.756
|
|
St18
|
suppression of tumorigenicity 18
|
|
chr17_-_51878720
|
6.752
|
|
Satb1
|
special AT-rich sequence binding protein 1
|
|
chr7_-_117987922
|
6.715
|
|
Rnf141
|
ring finger protein 141
|
|
chr17_-_28623006
|
6.480
|
NM_010220
|
Fkbp5
|
FK506 binding protein 5
|
|
chr5_-_88956788
|
6.410
|
NM_152839
|
Igj
|
immunoglobulin joining chain
|
|
chr5_+_138070341
|
6.398
|
NM_001168652
NM_146164
|
Lrch4-sap25
Lrch4
|
Lrch4-Sap25 gene
leucine-rich repeats and calponin homology (CH) domain containing 4
|
|
chr5_-_66489416
|
6.287
|
NM_139065
|
Rbm47
|
RNA binding motif protein 47
|
|
chr7_+_26067197
|
6.197
|
NM_001110131
NM_001110132
NM_027882
|
Cic
|
capicua homolog (Drosophila)
|
|
chr13_+_21879356
|
6.110
|
NM_178202
|
Hist1h2bp
|
histone cluster 1, H2bp
|
|
chr12_-_80397239
|
6.094
|
NM_001008550
|
Zfyve26
|
zinc finger, FYVE domain containing 26
|
|
chr4_+_102243272
|
6.086
|
|
Pde4b
|
phosphodiesterase 4B, cAMP specific
|
|
chr4_+_102243132
|
6.073
|
|
Pde4b
|
phosphodiesterase 4B, cAMP specific
|
|
chr1_+_16678513
|
6.053
|
|
Ly96
|
lymphocyte antigen 96
|
|
chr6_-_66987377
|
6.002
|
NM_007836
|
Gadd45a
|
growth arrest and DNA-damage-inducible 45 alpha
|
|
chr7_+_4967081
|
5.987
|
NM_025324
|
Zfp524
|
zinc finger protein 524
|
|
chr7_+_132695735
|
5.969
|
|
Il4ra
|
interleukin 4 receptor, alpha
|
|
chr1_+_6720087
|
5.876
|
NM_173868
|
St18
|
suppression of tumorigenicity 18
|
|
chr9_-_43951401
|
5.757
|
|
|
|
|
chr19_+_12535536
|
5.586
|
|
Mpeg1
|
macrophage expressed gene 1
|
|
chr16_-_17144301
|
5.437
|
NM_001164606
|
Ccdc116
|
coiled-coil domain containing 116
|
|
chr5_+_144951154
|
5.405
|
NM_010800
|
Bhlha15
|
basic helix-loop-helix family, member a15
|
|
chr13_-_54789548
|
5.351
|
NM_001146027
|
Rnf44
|
ring finger protein 44
|
|
chr12_-_36769054
|
5.297
|
NM_025359
|
Tspan13
|
tetraspanin 13
|
|
chr14_+_32973077
|
5.272
|
NM_001033988
|
Ncoa4
|
nuclear receptor coactivator 4
|
|
chr1_+_16678536
|
5.048
|
NM_001159711
NM_016923
|
Ly96
|
lymphocyte antigen 96
|
|
chr2_-_11475555
|
4.976
|
NM_001177758
|
Pfkfb3
|
6-phosphofructo-2-kinase/fructose-2,6-biphosphatase 3
|
|
chr8_+_123059756
|
4.943
|
NM_001145897
|
Gse1
|
genetic suppressor element 1
|
|
chr11_+_98821784
|
4.782
|
NM_001176528
|
Rara
|
retinoic acid receptor, alpha
|
|
chr14_-_68333897
|
4.770
|
NM_175384
|
Cdca2
|
cell division cycle associated 2
|
|
chr10_-_80813198
|
4.759
|
NM_001163166
|
Hmg20b
|
high mobility group 20 B
|
|
chr15_-_66663390
|
4.753
|
NM_001029841
|
Sla
|
src-like adaptor
|
|
chrX_+_7455387
|
4.738
|
NM_138606
|
Pim2
|
proviral integration site 2
|
|
chr5_+_137384005
|
4.713
|
NM_026073
|
Rabl5
|
RAB, member of RAS oncogene family-like 5
|
|
chr6_-_54922563
|
4.640
|
NM_172729
|
Nod1
|
nucleotide-binding oligomerization domain containing 1
|
|
chr2_-_119096952
|
4.597
|
NM_145530
|
Rhov
|
ras homolog gene family, member V
|
|
chr7_+_129432810
|
4.555
|
|
Prkcb
|
protein kinase C, beta
|
|
chr2_-_11475504
|
4.408
|
|
Pfkfb3
|
6-phosphofructo-2-kinase/fructose-2,6-biphosphatase 3
|
|
chr14_-_68333397
|
4.400
|
|
Cdca2
|
cell division cycle associated 2
|
|
chr5_+_117724658
|
4.344
|
|
Taok3
|
TAO kinase 3
|
|
chr12_-_36768992
|
4.325
|
|
Tspan13
|
tetraspanin 13
|
|
chr16_-_17144515
|
4.280
|
NM_029779
|
Ccdc116
|
coiled-coil domain containing 116
|
|
chr14_-_68333666
|
4.267
|
NM_001110162
|
Cdca2
|
cell division cycle associated 2
|
|
chr13_+_16106279
|
4.255
|
NM_008380
|
Inhba
|
inhibin beta-A
|
|
chr5_-_46248719
|
4.135
|
NM_001163073
NM_178142
|
Lcorl
|
ligand dependent nuclear receptor corepressor-like
|
|
chr1_-_93309713
|
4.101
|
NM_019479
|
Hes6
|
hairy and enhancer of split 6 (Drosophila)
|
|
chr2_-_38781939
|
4.098
|
NM_010264
|
Nr6a1
|
nuclear receptor subfamily 6, group A, member 1
|
|
chr18_-_81183260
|
4.078
|
NM_178280
|
Sall3
|
sal-like 3 (Drosophila)
|
|
chr7_+_52273317
|
4.059
|
NM_009101
|
Rras
|
Harvey rat sarcoma oncogene, subgroup R
|
|
chr5_+_73305509
|
4.048
|
NM_001113423
NM_153567
|
Slain2
|
SLAIN motif family, member 2
|
|
chr2_+_155207581
|
3.895
|
NM_178111
|
Trp53inp2
|
transformation related protein 53 inducible nuclear protein 2
|
|
chr16_+_10488270
|
3.879
|
NM_007575
|
Ciita
|
class II transactivator
|
|
chr7_-_117987867
|
3.660
|
NM_025999
|
Rnf141
|
ring finger protein 141
|
|
chr1_-_135586436
|
3.614
|
NM_172842
NM_001159649
|
Lax1
|
lymphocyte transmembrane adaptor 1
|
|
chr1_+_154597680
|
3.606
|
NM_001081197
|
Apobec4
|
apolipoprotein B mRNA editing enzyme, catalytic polypeptide-like 4 (putative)
|
|
chr7_+_148381017
|
3.573
|
NM_153777
|
Lrrc56
|
leucine rich repeat containing 56
|
|
chr13_-_46060325
|
3.558
|
NM_009124
|
Atxn1
|
ataxin 1
|
|
chr11_+_95198329
|
3.486
|
NM_172543
|
Fam117a
|
family with sequence similarity 117, memberA
|
|
chrX_-_163645313
|
3.472
|
|
Tmsb4x
|
thymosin, beta 4, X chromosome
|
|
chr6_+_115372083
|
3.468
|
NM_011146
|
Pparg
|
peroxisome proliferator activated receptor gamma
|
|
chr7_-_27951724
|
3.423
|
NM_053208
|
Egln2
|
EGL nine homolog 2 (C. elegans)
|
|
chrX_-_137077639
|
3.421
|
NM_010286
|
Tsc22d3
|
TSC22 domain family, member 3
|
|
chr1_-_137155012
|
3.392
|
NM_001163131
NM_007921
|
Elf3
|
E74-like factor 3
|
|
chr4_+_102242664
|
3.374
|
NM_001177980
|
Pde4b
|
phosphodiesterase 4B, cAMP specific
|
|
chr2_+_80171439
|
3.364
|
|
Dnajc10
|
DnaJ (Hsp40) homolog, subfamily C, member 10
|
|
chrX_+_13788273
|
3.352
|
NM_001034100
|
Gm5382
|
predicted gene 5382
|
|
chr15_+_98538624
|
3.329
|
NM_153518
|
Ccdc65
|
coiled-coil domain containing 65
|
|
chr13_-_54789148
|
3.328
|
NM_001146025
NM_001146026
NM_134064
|
Rnf44
|
ring finger protein 44
|
|
chrX_-_76916773
|
3.323
|
NM_028025
|
Mageb16
|
melanoma antigen family B, 16
|
|
chr10_-_90545046
|
3.269
|
|
Apaf1
|
apoptotic peptidase activating factor 1
|
|
chr13_-_21902031
|
3.268
|
NM_001097979
NM_001110555
|
Hist1h2bj
Hist1h2bq
Hist1h2br
|
histone cluster 1, H2bj
histone cluster 1, H2bq
histone cluster 1 H2br
|
|
chr4_-_140366562
|
3.245
|
NM_011060
|
Padi3
|
peptidyl arginine deiminase, type III
|
|
chr7_+_52253028
|
3.216
|
NM_016849
|
Irf3
|
interferon regulatory factor 3
|
|
chr2_-_25483461
|
3.215
|
NM_007995
|
Fcna
|
ficolin A
|
|
chr4_-_129374039
|
3.192
|
NM_199305
|
Tmem39b
|
transmembrane protein 39b
|
|
chr5_+_123465011
|
3.113
|
NM_175423
|
Orai1
|
ORAI calcium release-activated calcium modulator 1
|
|
chr12_+_118997623
|
3.086
|
|
Rapgef5
|
Rap guanine nucleotide exchange factor (GEF) 5
|
|
chr13_-_55201655
|
3.024
|
NM_011307
|
Uimc1
|
ubiquitin interaction motif containing 1
|
|
chr10_-_90545406
|
3.011
|
|
Apaf1
|
apoptotic peptidase activating factor 1
|
|
chr17_+_27693821
|
2.975
|
|
Hmga1
|
high mobility group AT-hook 1
|
|
chr7_-_27951432
|
2.943
|
|
Egln2
|
EGL nine homolog 2 (C. elegans)
|
|
chr6_+_67966702
|
2.922
|
|
|
|
|
chr19_-_20802015
|
2.887
|
NM_011921
|
Aldh1a7
|
aldehyde dehydrogenase family 1, subfamily A7
|
|
chr1_-_84741605
|
2.870
|
|
Trip12
|
thyroid hormone receptor interactor 12
|
|
chr13_+_21925611
|
2.852
|
NM_001097979
NM_001110555
|
Hist1h2bj
Hist1h2bq
Hist1h2br
|
histone cluster 1, H2bj
histone cluster 1, H2bq
histone cluster 1 H2br
|
|
chr17_+_27693518
|
2.753
|
NM_001166476
NM_001166477
NM_001025427
NM_001039356
NM_001166535
NM_001166536
NM_001166539
NM_001166540
NM_001166541
NM_001166542
NM_001166543
NM_001166544
NM_001166545
NM_001166546
NM_001166537
NM_016660
|
Hmga1-rs1
Hmga1
|
high mobility group AT-hook I, related sequence 1
high mobility group AT-hook 1
|
|
chr2_-_25052245
|
2.752
|
NM_146115
|
A830007P12Rik
|
RIKEN cDNA A830007P12 gene
|
|
chr9_-_44334460
|
2.672
|
NM_007551
|
Cxcr5
|
chemokine (C-X-C motif) receptor 5
|
|
chr2_+_24200807
|
2.671
|
NM_001159562
|
Il1rn
|
interleukin 1 receptor antagonist
|
|
chr7_-_29157512
|
2.646
|
NM_001083912
NM_138752
|
Plekhg2
|
pleckstrin homology domain containing, family G (with RhoGef domain) member 2
|
|
chr2_-_103143314
|
2.645
|
|
Ehf
|
ets homologous factor
|
|
chr13_-_55201578
|
2.636
|
|
Uimc1
|
ubiquitin interaction motif containing 1
|
|
chr6_+_136467388
|
2.605
|
|
Atf7ip
|
activating transcription factor 7 interacting protein
|
|
chr4_-_127938134
|
2.591
|
NM_027036
|
Hmgb4
|
high-mobility group box 4
|
|
chr3_+_129883794
|
2.580
|
NM_029838
NM_198711
|
Col25a1
|
collagen, type XXV, alpha 1
|
|
chr9_+_47338449
|
2.567
|
|
Cadm1
|
cell adhesion molecule 1
|
|
chr4_-_151851624
|
2.559
|
|
Kcnab2
|
potassium voltage-gated channel, shaker-related subfamily, beta member 2
|
|
chr4_-_151851574
|
2.486
|
NM_010598
|
Kcnab2
|
potassium voltage-gated channel, shaker-related subfamily, beta member 2
|
|
chrX_-_9149516
|
2.476
|
NM_001085517
|
Gm5132
|
predicted gene 5132
|
|
chr11_+_121007456
|
2.449
|
NM_028602
|
Tex19.1
|
testis expressed gene 19.1
|
|
chr13_-_108680257
|
2.435
|
NM_145456
|
Zswim6
|
zinc finger, SWIM domain containing 6
|
|
chrX_-_9046362
|
2.421
|
NM_007807
|
Cybb
|
cytochrome b-245, beta polypeptide
|
|
chr11_+_98821723
|
2.413
|
|
Rara
|
retinoic acid receptor, alpha
|
|
chr6_+_125271356
|
2.400
|
NM_011324
|
Scnn1a
|
sodium channel, nonvoltage-gated 1 alpha
|
|
chr6_+_136467315
|
2.380
|
NM_019426
|
Atf7ip
|
activating transcription factor 7 interacting protein
|
|
chr11_-_115353104
|
2.377
|
NM_015807
|
Nt5c
|
5',3'-nucleotidase, cytosolic
|
|
chr13_+_113078658
|
2.374
|
NM_001168403
NM_001168405
NM_029898
NM_001168404
|
Ankrd55
|
ankyrin repeat domain 55
|
|
chrX_+_10889059
|
2.347
|
NM_001025260
|
Gm14484
|
predicted gene 14484
|
|
chr11_-_70468130
|
2.329
|
NM_011072
|
Pfn1
|
profilin 1
|
|
chr11_+_79845841
|
2.297
|
|
Suz12
|
suppressor of zeste 12 homolog (Drosophila)
|
|
chr8_+_34681015
|
2.285
|
NM_031374
|
Tex15
|
testis expressed gene 15
|
|
chr10_-_8605668
|
2.269
|
NM_175155
|
Sash1
|
SAM and SH3 domain containing 1
|
|
chr2_+_24201033
|
2.257
|
|
Il1rn
|
interleukin 1 receptor antagonist
|
|
chr8_-_96059606
|
2.229
|
NM_001003951
|
Ces5a
|
carboxylesterase 5A
|
|
chr11_-_118254729
|
2.223
|
|
Lgals3bp
|
lectin, galactoside-binding, soluble, 3 binding protein
|
|
chr1_+_93437120
|
2.214
|
NM_001039126
|
Asb1
|
ankyrin repeat and SOCS box-containing 1
|
|
chr13_-_35118959
|
2.212
|
|
|
|
|
chr2_+_24200925
|
2.127
|
|
Il1rn
|
interleukin 1 receptor antagonist
|
|
chr4_-_128483355
|
2.117
|
NM_001081098
|
Zfp362
|
zinc finger protein 362
|
|
chr7_+_97574821
|
2.095
|
NM_027298
|
Ccdc89
|
coiled-coil domain containing 89
|
|
chrX_+_10885885
|
2.090
|
NM_001111037
|
Gm14483
|
predicted gene 14483
|
|
chr10_-_90545483
|
2.068
|
NM_001042558
NM_009684
|
Apaf1
|
apoptotic peptidase activating factor 1
|
|
chrX_-_49325948
|
2.047
|
NM_028851
|
1700080O16Rik
|
RIKEN cDNA 1700080O16 gene
|
|
chr2_-_103143352
|
2.026
|
NM_007914
|
Ehf
|
ets homologous factor
|
|
chr16_-_92697567
|
2.018
|
NM_001111023
NM_009821
|
Runx1
|
runt related transcription factor 1
|
|
chrX_+_10876382
|
2.007
|
NM_001111037
|
Gm14483
|
predicted gene 14483
|
|
chr17_+_24879324
|
1.999
|
|
Sepx1
|
selenoprotein X 1
|
|
chr6_+_125271727
|
1.999
|
|
Scnn1a
|
sodium channel, nonvoltage-gated 1 alpha
|
|
chr9_-_35597630
|
1.996
|
NM_026593
|
D730048I06Rik
|
RIKEN cDNA D730048I06 gene
|
|
chr5_+_136592559
|
1.980
|
NM_011293
|
Polr2j
|
polymerase (RNA) II (DNA directed) polypeptide J
|
|
chr13_+_4190423
|
1.968
|
NM_013778
|
Akr1c13
|
aldo-keto reductase family 1, member C13
|
|
chrX_+_8927724
|
1.889
|
NM_001085537
|
Gm14501
|
predicted gene 14501
|
|
chr3_-_101091814
|
1.863
|
NM_013486
|
Cd2
|
CD2 antigen
|
|
chrX_+_8860889
|
1.861
|
NM_029588
|
1700012L04Rik
|
RIKEN cDNA 1700012L04 gene
|
|
chr11_+_33947115
|
1.848
|
NM_010696
|
Lcp2
|
lymphocyte cytosolic protein 2
|
|
chr6_-_87483228
|
1.827
|
NM_001037727
|
Arhgap25
|
Rho GTPase activating protein 25
|
|
chr11_+_98562626
|
1.809
|
NM_009971
|
Csf3
|
colony stimulating factor 3 (granulocyte)
|
