|
chr2_-_55053398
|
3.706
|
|
|
|
|
chr8_+_50147455
|
2.535
|
NM_001007176
|
C8orf22
|
chromosome 8 open reading frame 22
|
|
chr8_-_62764839
|
2.278
|
NM_001164750
NM_001164751
NM_001164752
NM_001164753
NM_020164
NM_032467
NM_032468
|
ASPH
|
aspartate beta-hydroxylase
|
|
chr15_-_23204887
|
2.158
|
NM_000462
|
UBE3A
|
ubiquitin protein ligase E3A
|
|
chr20_+_11846536
|
2.067
|
NM_014962
|
BTBD3
|
BTB (POZ) domain containing 3
|
|
chr13_+_75232797
|
1.957
|
NM_015842
|
LMO7
|
LIM domain 7
|
|
chr12_+_58369392
|
1.908
|
NM_004731
|
SLC16A7
|
solute carrier family 16, member 7 (monocarboxylic acid transporter 2)
|
|
chr6_+_132901119
|
1.879
|
NM_175057
|
TAAR9
|
trace amine associated receptor 9 (gene/pseudogene)
|
|
chr8_-_82522175
|
1.836
|
NM_002677
|
PMP2
|
peripheral myelin protein 2
|
|
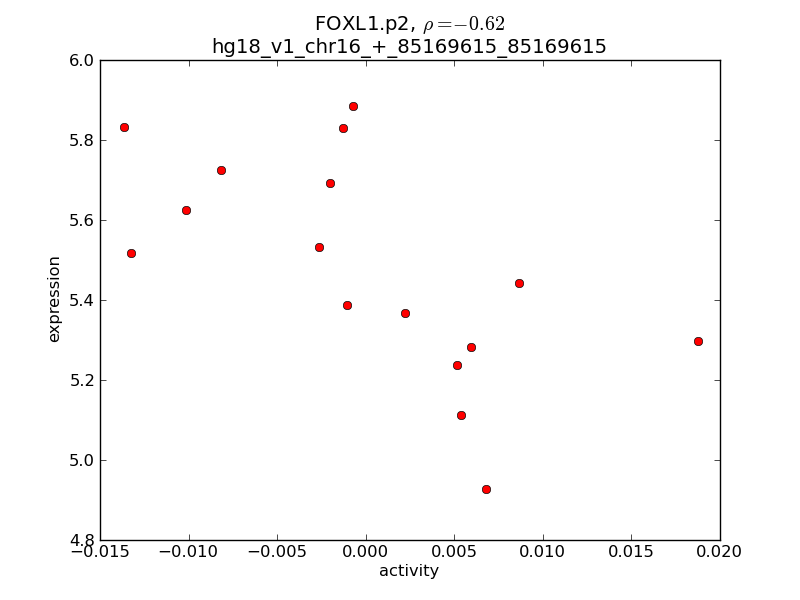
chr3_-_87408301
|
1.829
|
NM_000306
NM_001122757
|
POU1F1
|
POU class 1 homeobox 1
|
|
chr1_-_214963279
|
1.811
|
NM_001438
|
ESRRG
|
estrogen-related receptor gamma
|
|
chr4_-_44348414
|
1.775
|
NM_182592
|
YIPF7
|
Yip1 domain family, member 7
|
|
chr6_+_127940011
|
1.767
|
NM_001010905
|
C6orf58
|
chromosome 6 open reading frame 58
|
|
chr9_-_21472311
|
1.719
|
NM_176891
|
IFNE
|
interferon, epsilon
|
|
chr1_+_74473672
|
1.689
|
NM_015978
|
TNNI3K
|
TNNI3 interacting kinase
|
|
chr7_-_108311872
|
1.623
|
NM_001024607
|
C7orf66
|
chromosome 7 open reading frame 66
|
|
chr11_-_13474101
|
1.592
|
NM_000315
|
PTH
|
parathyroid hormone
|
|
chr9_-_21156609
|
1.563
|
NM_002175
|
IFNA21
|
interferon, alpha 21
|
|
chr2_+_211129567
|
1.553
|
NM_001875
|
CPS1
|
carbamoyl-phosphate synthase 1, mitochondrial
|
|
chr17_-_26648375
|
1.546
|
NM_002544
|
OMG
|
oligodendrocyte myelin glycoprotein
|
|
chr14_-_94669547
|
1.536
|
NM_001195573
|
DICER1
|
dicer 1, ribonuclease type III
|
|
chr12_-_44877769
|
1.459
|
|
SLC38A1
|
solute carrier family 38, member 1
|
|
chrX_-_77801480
|
1.456
|
NM_152694
|
ZCCHC5
|
zinc finger, CCHC domain containing 5
|
|
chr8_-_102005697
|
1.435
|
|
YWHAZ
|
tyrosine 3-monooxygenase/tryptophan 5-monooxygenase activation protein, zeta polypeptide
|
|
chr5_-_43326922
|
1.413
|
|
HMGCS1
|
3-hydroxy-3-methylglutaryl-CoA synthase 1 (soluble)
|
|
chr9_-_21132143
|
1.387
|
NM_002177
|
IFNW1
|
interferon, omega 1
|
|
chr18_+_59733724
|
1.382
|
NM_005024
|
SERPINB10
|
serpin peptidase inhibitor, clade B (ovalbumin), member 10
|
|
chr3_-_52688768
|
1.377
|
NM_018165
NM_181042
|
PBRM1
|
polybromo 1
|
|
chr15_-_68781662
|
1.370
|
NM_001008224
|
UACA
|
uveal autoantigen with coiled-coil domains and ankyrin repeats
|
|
chr18_-_49944986
|
1.353
|
|
MBD2
|
methyl-CpG binding domain protein 2
|
|
chr20_+_9406460
|
1.340
|
|
PLCB4
|
phospholipase C, beta 4
|
|
chr1_+_103898844
|
1.329
|
NM_020978
|
AMY2B
|
amylase, alpha 2B (pancreatic)
|
|
chr5_+_86712376
|
1.299
|
|
|
|
|
chr12_+_21417068
|
1.293
|
NM_000415
|
IAPP
|
islet amyloid polypeptide
|
|
chr6_-_116553918
|
1.291
|
NM_000493
|
COL10A1
|
collagen, type X, alpha 1
|
|
chr11_-_56137553
|
1.243
|
NM_001004740
|
OR5M1
|
olfactory receptor, family 5, subfamily M, member 1
|
|
chr19_+_39402167
|
1.240
|
|
LSM14A
|
LSM14A, SCD6 homolog A (S. cerevisiae)
|
|
chr9_-_21218132
|
1.238
|
NM_021268
|
IFNA17
|
interferon, alpha 17
|
|
chr2_+_183316574
|
1.233
|
|
DNAJC10
|
DnaJ (Hsp40) homolog, subfamily C, member 10
|
|
chr11_+_33319680
|
1.228
|
|
HIPK3
|
homeodomain interacting protein kinase 3
|
|
chr5_+_179934143
|
1.227
|
|
CNOT6
|
CCR4-NOT transcription complex, subunit 6
|
|
chr14_-_105785639
|
1.227
|
|
|
|
|
chr3_-_115380539
|
1.227
|
NM_000796
NM_033663
|
DRD3
|
dopamine receptor D3
|
|
chr6_-_64087806
|
1.219
|
NM_001143940
NM_016571
|
LGSN
|
lengsin, lens protein with glutamine synthetase domain
|
|
chr5_-_27074407
|
1.213
|
NM_016279
|
CDH9
|
cadherin 9, type 2 (T1-cadherin)
|
|
chr3_+_162697289
|
1.207
|
NM_001080440
|
OTOL1
|
otolin 1 homolog (zebrafish)
|
|
chr7_-_113346284
|
1.197
|
NM_002711
|
PPP1R3A
|
protein phosphatase 1, regulatory (inhibitor) subunit 3A
|
|
chr1_+_246635918
|
1.185
|
NM_030904
|
OR2T1
|
olfactory receptor, family 2, subfamily T, member 1
|
|
chr2_-_55090759
|
1.165
|
NM_007008
|
RTN4
|
reticulon 4
|
|
chr14_-_30927931
|
1.162
|
NM_015473
|
HEATR5A
|
HEAT repeat containing 5A
|
|
chr3_-_166278969
|
1.161
|
NM_001041
|
SI
|
sucrase-isomaltase (alpha-glucosidase)
|
|
chr18_-_39111243
|
1.157
|
NM_020783
|
SYT4
|
synaptotagmin IV
|
|
chr1_-_156784518
|
1.148
|
NM_001005189
|
OR6Y1
|
olfactory receptor, family 6, subfamily Y, member 1
|
|
chr2_-_215998181
|
1.142
|
|
FN1
|
fibronectin 1
|
|
chr4_+_88748704
|
1.141
|
NM_014208
|
DSPP
|
dentin sialophosphoprotein
|
|
chr20_-_14266200
|
1.130
|
NM_013281
NM_198391
|
FLRT3
|
fibronectin leucine rich transmembrane protein 3
|
|
chr11_-_7775064
|
1.120
|
NM_153444
|
OR5P2
|
olfactory receptor, family 5, subfamily P, member 2
|
|
chr11_-_57883117
|
1.115
|
NM_001005489
|
OR5B17
|
olfactory receptor, family 5, subfamily B, member 17
|
|
chrX_-_57180782
|
1.110
|
NM_019003
|
SPIN2A
|
spindlin family, member 2A
|
|
chr9_+_21399132
|
1.102
|
NM_002170
|
IFNA8
|
interferon, alpha 8
|
|
chr12_+_63510481
|
1.072
|
|
|
|
|
chr9_-_16717887
|
1.071
|
|
BNC2
|
basonuclin 2
|
|
chr4_+_53975597
|
1.064
|
|
FIP1L1
|
FIP1 like 1 (S. cerevisiae)
|
|
chr7_-_81237162
|
1.034
|
NM_000601
NM_001010931
NM_001010932
NM_001010933
NM_001010934
|
HGF
|
hepatocyte growth factor (hepapoietin A; scatter factor)
|
|
chr4_+_146250978
|
1.032
|
|
ABCE1
|
ATP-binding cassette, sub-family E (OABP), member 1
|
|
chr17_+_58440629
|
1.029
|
NM_025185
|
TANC2
|
tetratricopeptide repeat, ankyrin repeat and coiled-coil containing 2
|
|
chrX_+_37750778
|
1.026
|
NM_001163335
NM_138780
|
SYTL5
|
synaptotagmin-like 5
|
|
chr5_+_65408500
|
1.017
|
|
ERBB2IP
|
erbb2 interacting protein
|
|
chr1_-_102235377
|
1.000
|
NM_058170
|
OLFM3
|
olfactomedin 3
|
|
chr1_-_150328153
|
0.964
|
NM_001008536
|
TCHHL1
|
trichohyalin-like 1
|
|
chr1_-_246869181
|
0.950
|
NM_001001827
|
OR2T35
|
olfactory receptor, family 2, subfamily T, member 35
|
|
chr20_+_9236446
|
0.944
|
NM_000933
|
PLCB4
|
phospholipase C, beta 4
|
|
chr2_-_99412694
|
0.933
|
|
REV1
|
REV1 homolog (S. cerevisiae)
|
|
chr1_-_188713324
|
0.928
|
NM_199051
|
FAM5C
|
family with sequence similarity 5, member C
|
|
chr2_+_214984705
|
0.928
|
NM_001080500
|
VWC2L
|
von Willebrand factor C domain containing protein 2-like
|
|
chr3_+_137224266
|
0.925
|
NM_181897
|
PPP2R3A
|
protein phosphatase 2, regulatory subunit B'', alpha
|
|
chr9_+_5646582
|
0.919
|
NM_020829
|
KIAA1432
|
KIAA1432
|
|
chrX_-_76700873
|
0.904
|
|
ATRX
|
alpha thalassemia/mental retardation syndrome X-linked
|
|
chr19_-_43608641
|
0.883
|
NM_001146202
NM_001146203
NM_001146204
NM_001146205
NM_001146206
NM_001146207
NM_170604
|
RASGRP4
|
RAS guanyl releasing protein 4
|
|
chr12_-_18134319
|
0.879
|
NM_024730
|
RERGL
|
RERG/RAS-like
|
|
chrX_+_41468351
|
0.878
|
NM_080817
|
GPR82
|
G protein-coupled receptor 82
|
|
chr9_+_124551839
|
0.877
|
NM_001004453
|
OR1L6
|
olfactory receptor, family 1, subfamily L, member 6
|
|
chr4_+_119174947
|
0.875
|
NM_004784
|
NDST3
|
N-deacetylase/N-sulfotransferase (heparan glucosaminyl) 3
|
|
chr1_+_190811479
|
0.872
|
NM_002922
|
RGS1
|
regulator of G-protein signaling 1
|
|
chr1_+_151240846
|
0.872
|
NM_001097589
NM_005416
|
SPRR3
|
small proline-rich protein 3
|
|
chr12_+_28301399
|
0.869
|
NM_018318
|
CCDC91
|
coiled-coil domain containing 91
|
|
chr15_+_47502666
|
0.866
|
NM_002009
|
FGF7
|
fibroblast growth factor 7
|
|
chr6_+_50894397
|
0.861
|
NM_003221
|
TFAP2B
|
transcription factor AP-2 beta (activating enhancer binding protein 2 beta)
|
|
chr6_-_132987106
|
0.858
|
NM_001033080
|
TAAR2
|
trace amine associated receptor 2
|
|
chr9_-_106401514
|
0.857
|
NM_001004482
|
OR13C5
|
olfactory receptor, family 13, subfamily C, member 5
|
|
chr5_+_161045235
|
0.854
|
NM_000811
|
GABRA6
|
gamma-aminobutyric acid (GABA) A receptor, alpha 6
|
|
chr6_-_133008834
|
0.852
|
NM_138327
|
TAAR1
|
trace amine associated receptor 1
|
|
chr12_+_79362256
|
0.850
|
NM_001145026
|
PTPRQ
|
protein tyrosine phosphatase, receptor type, Q
|
|
chr8_+_104900591
|
0.847
|
NM_014677
|
RIMS2
|
regulating synaptic membrane exocytosis 2
|
|
chr5_+_147529488
|
0.845
|
NM_001001325
|
SPINK14
|
serine peptidase inhibitor, Kazal type 14 (putative)
|
|
chr4_+_70831387
|
0.844
|
NM_001025104
NM_001890
|
CSN1S1
|
casein alpha s1
|
|
chr9_-_13240313
|
0.838
|
NM_003829
|
MPDZ
|
multiple PDZ domain protein
|
|
chr3_-_109958723
|
0.830
|
NM_032579
|
RETNLB
|
resistin like beta
|
|
chr12_-_89976261
|
0.828
|
NM_007035
|
KERA
|
keratocan
|
|
chr2_-_210726539
|
0.801
|
|
C2orf67
|
chromosome 2 open reading frame 67
|
|
chr11_-_5766621
|
0.795
|
NM_001001913
|
OR52N1
|
olfactory receptor, family 52, subfamily N, member 1
|
|
chr7_+_93862137
|
0.793
|
|
COL1A2
PLAG1
|
collagen, type I, alpha 2
pleiomorphic adenoma gene 1
|
|
chr4_+_73123712
|
0.790
|
NM_001144756
NM_053036
|
NPFFR2
|
neuropeptide FF receptor 2
|
|
chr6_+_54281161
|
0.790
|
NM_014464
|
TINAG
|
tubulointerstitial nephritis antigen
|
|
chr3_-_69381995
|
0.789
|
|
FRMD4B
|
FERM domain containing 4B
|
|
chr5_+_140757787
|
0.784
|
NM_018925
NM_032099
|
PCDHGB5
|
protocadherin gamma subfamily B, 5
|
|
chr2_-_127817143
|
0.776
|
NM_006609
|
MAP3K2
|
mitogen-activated protein kinase kinase kinase 2
|
|
chr12_-_44919818
|
0.773
|
|
SLC38A1
|
solute carrier family 38, member 1
|
|
chrX_-_140614227
|
0.770
|
NM_145665
NM_032417
|
SPANXE
SPANXD
SPANXA2
|
SPANX family, member E
SPANX family, member D
SPANX family, member A2
|
|
chr7_+_80145461
|
0.768
|
|
CD36
|
CD36 molecule (thrombospondin receptor)
|
|
chr14_+_71065794
|
0.767
|
NM_015556
|
SIPA1L1
|
signal-induced proliferation-associated 1 like 1
|
|
chr18_-_65766068
|
0.762
|
|
CD226
|
CD226 molecule
|
|
chr4_+_70896236
|
0.754
|
NM_001009181
NM_003154
|
STATH
|
statherin
|
|
chr21_-_30614477
|
0.751
|
NM_203405
|
KRTAP26-1
|
keratin associated protein 26-1
|
|
chr5_+_139869819
|
0.744
|
|
|
|
|
chr11_-_19180092
|
0.743
|
NM_001127656
NM_003476
|
CSRP3
|
cysteine and glycine-rich protein 3 (cardiac LIM protein)
|
|
chr6_-_123999640
|
0.742
|
NM_006073
|
TRDN
|
triadin
|
|
chr17_-_60439764
|
0.731
|
|
GNA13
|
guanine nucleotide binding protein (G protein), alpha 13
|
|
chr11_+_36546138
|
0.723
|
NM_000448
|
RAG1
|
recombination activating gene 1
|
|
chr7_+_134114701
|
0.717
|
NM_004342
NM_033138
NM_033157
|
CALD1
|
caldesmon 1
|
|
chr6_+_27400518
|
0.715
|
NM_032030
|
FKSG83
|
FKSG83
|
|
chr1_-_246554492
|
0.712
|
NM_001004691
|
OR2M7
|
olfactory receptor, family 2, subfamily M, member 7
|
|
chr4_-_123596921
|
0.707
|
NM_000586
|
IL2
|
interleukin 2
|
|
chr1_-_166779825
|
0.704
|
NM_003175
|
XCL1
XCL2
|
chemokine (C motif) ligand 1
chemokine (C motif) ligand 2
|
|
chr1_-_157003095
|
0.703
|
NM_001005185
|
OR6N1
|
olfactory receptor, family 6, subfamily N, member 1
|
|
chr12_-_10853940
|
0.701
|
NM_023917
|
TAS2R9
|
taste receptor, type 2, member 9
|
|
chr4_-_157006827
|
0.701
|
NM_017419
|
ACCN5
|
amiloride-sensitive cation channel 5, intestinal
|
|
chr4_-_64957595
|
0.700
|
NM_001010874
|
TECRL
|
trans-2,3-enoyl-CoA reductase-like
|
|
chr3_+_35658852
|
0.695
|
NM_016300
|
ARPP21
|
cAMP-regulated phosphoprotein, 21kDa
|
|
chr9_+_42707229
|
0.690
|
NM_001099279
NM_199244
|
FOXD4L2
FOXD4L4
|
forkhead box D4-like 2
forkhead box D4-like 4
|
|
chr7_+_134114912
|
0.688
|
|
CALD1
|
caldesmon 1
|
|
chrX_+_55666557
|
0.685
|
NM_198451
|
FOXR2
|
forkhead box R2
|
|
chr4_+_42590038
|
0.685
|
NM_001080476
|
GRXCR1
|
glutaredoxin, cysteine rich 1
|
|
chr3_-_78749633
|
0.683
|
|
ROBO1
|
roundabout, axon guidance receptor, homolog 1 (Drosophila)
|
|
chrX_-_33139349
|
0.683
|
NM_004006
|
DMD
|
dystrophin
|
|
chr7_-_107230867
|
0.682
|
NM_000111
|
SLC26A3
|
solute carrier family 26, member 3
|
|
chr5_+_76470829
|
0.680
|
|
|
|
|
chr2_+_85619797
|
0.675
|
NM_005911
|
MAT2A
|
methionine adenosyltransferase II, alpha
|
|
chr1_+_245818284
|
0.675
|
NM_001001915
|
OR2G2
|
olfactory receptor, family 2, subfamily G, member 2
|
|
chr12_-_66905802
|
0.674
|
NM_018402
|
IL26
|
interleukin 26
|
|
chr18_+_50409387
|
0.671
|
NM_173629
|
C18orf26
|
chromosome 18 open reading frame 26
|
|
chr5_-_146441184
|
0.669
|
NM_181677
NM_181678
|
PPP2R2B
|
protein phosphatase 2, regulatory subunit B, beta
|
|
chr2_+_228064531
|
0.668
|
|
AGFG1
|
ArfGAP with FG repeats 1
|
|
chr2_+_227900471
|
0.666
|
NM_020194
|
MFF
|
mitochondrial fission factor
|
|
chr11_-_55987452
|
0.665
|
NM_001004743
|
OR5M9
|
olfactory receptor, family 5, subfamily M, member 9
|
|
chr11_-_6148131
|
0.664
|
NM_001004052
|
OR52B2
|
olfactory receptor, family 52, subfamily B, member 2
|
|
chr7_+_110518297
|
0.660
|
NM_001099658
NM_001099660
NM_018334
|
LRRN3
|
leucine rich repeat neuronal 3
|
|
chr5_+_180726874
|
0.659
|
NM_001005224
NM_001005221
NM_001005277
|
OR4F3
OR4F29
OR4F16
|
olfactory receptor, family 4, subfamily F, member 3
olfactory receptor, family 4, subfamily F, member 29
olfactory receptor, family 4, subfamily F, member 16
|
|
chr11_+_88550687
|
0.658
|
NM_000372
|
TYR
|
tyrosinase (oculocutaneous albinism IA)
|
|
chr3_+_150028130
|
0.656
|
NM_001871
|
CPB1
|
carboxypeptidase B1 (tissue)
|
|
chr3_-_99236520
|
0.654
|
NM_001105580
|
GABRR3
|
gamma-aminobutyric acid (GABA) receptor, rho 3
|
|
chr7_+_113853790
|
0.651
|
NM_001172767
NM_148899
|
FOXP2
|
forkhead box P2
|
|
chr4_-_21308415
|
0.651
|
NM_001035003
|
KCNIP4
|
Kv channel interacting protein 4
|
|
chr3_-_174341653
|
0.643
|
NM_031955
|
SPATA16
|
spermatogenesis associated 16
|
|
chr18_+_64616296
|
0.640
|
NM_024781
|
CCDC102B
|
coiled-coil domain containing 102B
|
|
chr12_+_54045161
|
0.639
|
NM_001005497
|
OR6C75
|
olfactory receptor, family 6, subfamily C, member 75
|
|
chr10_-_121592020
|
0.638
|
|
MCMBP
|
minichromosome maintenance complex binding protein
|
|
chr4_+_71261066
|
0.638
|
NM_012390
|
SMR3B
SMR3A
|
submaxillary gland androgen regulated protein 3B
submaxillary gland androgen regulated protein 3A
|
|
chr15_+_46271158
|
0.637
|
NM_001145668
|
CTXN2
SLC12A1
|
cortexin 2
solute carrier family 12 (sodium/potassium/chloride transporters), member 1
|
|
chr4_+_71096830
|
0.635
|
NM_017855
|
ODAM
|
odontogenic, ameloblast asssociated
|
|
chr21_-_31049566
|
0.633
|
NM_181619
|
KRTAP21-1
|
keratin associated protein 21-1
|
|
chr3_+_190372456
|
0.633
|
NM_198485
|
TPRG1
|
tumor protein p63 regulated 1
|
|
chr2_+_166137091
|
0.626
|
NM_024969
|
CSRNP3
|
cysteine-serine-rich nuclear protein 3
|
|
chr14_+_20319049
|
0.625
|
NM_005615
|
RNASE6
|
ribonuclease, RNase A family, k6
|
|
chrX_-_138114846
|
0.618
|
NM_001139498
NM_001139500
NM_001139501
|
FGF13
|
fibroblast growth factor 13
|
|
chr3_-_121445831
|
0.617
|
NM_001168271
NM_153002
|
GPR156
|
G protein-coupled receptor 156
|
|
chr17_+_32807040
|
0.617
|
NM_173625
|
C17orf78
|
chromosome 17 open reading frame 78
|
|
chr1_+_69998445
|
0.614
|
NM_020794
|
LRRC7
|
leucine rich repeat containing 7
|
|
chr16_+_14187965
|
0.612
|
|
MKL2
|
MKL/myocardin-like 2
|
|
chr10_-_98280299
|
0.611
|
|
TM9SF3
|
transmembrane 9 superfamily member 3
|
|
chr1_-_148936123
|
0.611
|
NM_018178
|
GOLPH3L
|
golgi phosphoprotein 3-like
|
|
chr1_+_81544432
|
0.610
|
|
LPHN2
|
latrophilin 2
|
|
chr4_+_71283383
|
0.605
|
NM_006685
|
SMR3B
|
submaxillary gland androgen regulated protein 3B
|
|
chr14_-_105681377
|
0.604
|
|
IGHV4-31
IGHG1
|
immunoglobulin heavy variable 4-31
immunoglobulin heavy constant gamma 1 (G1m marker)
|
|
chr2_-_207291364
|
0.602
|
NM_001093730
|
DYTN
|
dystrotelin
|
|
chr5_-_58688428
|
0.599
|
NM_001197219
|
PDE4D
|
phosphodiesterase 4D, cAMP-specific
|
|
chr21_-_30796278
|
0.598
|
NM_181611
|
KRTAP19-5
|
keratin associated protein 19-5
|
|
chr4_+_157044296
|
0.596
|
NM_005651
|
TDO2
|
tryptophan 2,3-dioxygenase
|
|
chr2_-_63518589
|
0.595
|
NM_001042692
|
WDPCP
|
WD repeat containing planar cell polarity effector
|
|
chr3_-_194755281
|
0.594
|
NM_032279
|
ATP13A4
|
ATPase type 13A4
|
|
chr4_+_86615275
|
0.593
|
NM_001025616
|
ARHGAP24
|
Rho GTPase activating protein 24
|
|
chr8_-_66863841
|
0.592
|
NM_002603
|
PDE7A
|
phosphodiesterase 7A
|
|
chr12_-_9252227
|
0.589
|
NM_002864
|
PZP
|
pregnancy-zone protein
|
|
chr4_-_80466177
|
0.588
|
NM_032693
|
NAA11
|
N(alpha)-acetyltransferase 11, NatA catalytic subunit
|
|
chr11_-_6005546
|
0.586
|
NM_001001917
|
OR56A1
|
olfactory receptor, family 56, subfamily A, member 1
|
|
chr9_+_74956494
|
0.586
|
NM_000700
|
ANXA1
|
annexin A1
|
|
chr4_+_74825138
|
0.585
|
NM_000584
|
IL8
|
interleukin 8
|
|
chr2_-_210876560
|
0.582
|
NM_079422
|
MYL1
|
myosin, light chain 1, alkali; skeletal, fast
|
|
chr13_-_45577144
|
0.577
|
NM_001872
NM_016413
|
CPB2
|
carboxypeptidase B2 (plasma)
|
|
chr14_+_18447521
|
0.575
|
NM_001013354
|
OR11H12
|
olfactory receptor, family 11, subfamily H, member 12
|
|
chr14_-_106330781
|
0.574
|
|
IGHV5-78
|
immunoglobulin heavy variable 5-78 pseudogene
|
|
chr3_+_171183203
|
0.574
|
|
SEC62
|
SEC62 homolog (S. cerevisiae)
|
|
chr1_+_62835759
|
0.574
|
NM_014495
|
ANGPTL3
|
angiopoietin-like 3
|
|
chrX_-_53646332
|
0.571
|
|
HUWE1
|
HECT, UBA and WWE domain containing 1
|
|
chr9_-_21067804
|
0.571
|
NM_002176
|
IFNB1
|
interferon, beta 1, fibroblast
|
|
chr7_+_80069439
|
0.571
|
NM_001001547
|
CD36
|
CD36 molecule (thrombospondin receptor)
|
|
chr9_+_124477135
|
0.570
|
NM_001005234
|
OR1L3
|
olfactory receptor, family 1, subfamily L, member 3
|
|
chr11_-_84311867
|
0.568
|
|
DLG2
|
discs, large homolog 2 (Drosophila)
|
|
chr13_-_47899043
|
0.567
|
NM_001162497
|
LPAR6
|
lysophosphatidic acid receptor 6
|
|
chr15_+_64481270
|
0.555
|
|
MAP2K1
|
mitogen-activated protein kinase kinase 1
|