|
chr4_-_809879
|
12.300
|
NM_006651
|
CPLX1
|
complexin 1
|
|
chr2_+_232281470
|
7.114
|
NM_001099285
NM_002823
|
PTMA
|
prothymosin, alpha
|
|
chr20_-_61574259
|
6.605
|
NM_004518
NM_172106
NM_172107
NM_172108
NM_172109
|
KCNQ2
|
potassium voltage-gated channel, KQT-like subfamily, member 2
|
|
chr2_+_232281491
|
6.579
|
|
PTMA
|
prothymosin, alpha
|
|
chr1_-_1465602
|
6.184
|
NM_001114748
|
C1orf70
|
chromosome 1 open reading frame 70
|
|
chr4_+_995609
|
5.855
|
NM_001004356
NM_001004358
|
FGFRL1
|
fibroblast growth factor receptor-like 1
|
|
chr4_+_995395
|
5.589
|
|
FGFRL1
|
fibroblast growth factor receptor-like 1
|
|
chr19_+_1200882
|
5.143
|
|
MIDN
|
midnolin
|
|
chr19_+_540849
|
5.134
|
NM_001194
|
HCN2
|
hyperpolarization activated cyclic nucleotide-gated potassium channel 2
|
|
chr10_-_103525646
|
4.740
|
NM_006119
NM_033163
NM_033164
NM_033165
|
FGF8
|
fibroblast growth factor 8 (androgen-induced)
|
|
chr7_+_5289079
|
4.686
|
NM_001040661
NM_153247
|
SLC29A4
|
solute carrier family 29 (nucleoside transporters), member 4
|
|
chr19_+_748390
|
4.200
|
NM_002819
NM_031990
NM_031991
NM_175847
|
PTBP1
|
polypyrimidine tract binding protein 1
|
|
chr11_+_56984702
|
4.181
|
NM_178570
|
RTN4RL2
|
reticulon 4 receptor-like 2
|
|
chr6_+_37245860
|
4.084
|
NM_002648
|
PIM1
|
pim-1 oncogene
|
|
chr6_+_33046706
|
4.024
|
|
BRD2
|
bromodomain containing 2
|
|
chr21_+_46226072
|
4.019
|
NM_001848
|
COL6A1
|
collagen, type VI, alpha 1
|
|
chr11_+_359723
|
4.011
|
NM_178537
|
B4GALNT4
|
beta-1,4-N-acetyl-galactosaminyl transferase 4
|
|
chr19_+_54786723
|
4.008
|
NM_020719
|
PRR12
|
proline rich 12
|
|
chr17_-_1029758
|
3.986
|
NM_021962
|
ABR
|
active BCR-related gene
|
|
chr17_+_7682355
|
3.834
|
|
|
|
|
chr7_+_1239078
|
3.720
|
NM_001080461
|
UNCX
|
UNC homeobox
|
|
chr17_+_78630793
|
3.669
|
NM_001004431
|
METRNL
|
meteorin, glial cell differentiation regulator-like
|
|
chr12_+_4253143
|
3.638
|
NM_001759
|
CCND2
|
cyclin D2
|
|
chr17_-_75427644
|
3.636
|
NM_003655
|
CBX4
|
chromobox homolog 4
|
|
chr21_+_42946719
|
3.609
|
NM_001001567
NM_001001568
NM_001001569
NM_001001570
NM_001001571
NM_001001572
NM_001001573
NM_001001574
NM_001001575
NM_001001576
NM_001001577
NM_001001578
NM_001001579
NM_001001580
NM_001001581
NM_001001582
NM_001001583
NM_001001584
NM_001001585
NM_002606
|
PDE9A
|
phosphodiesterase 9A
|
|
chr10_+_102495327
|
3.590
|
NM_000278
NM_003987
NM_003988
NM_003989
NM_003990
|
PAX2
|
paired box 2
|
|
chr4_+_996251
|
3.547
|
NM_021923
|
FGFRL1
|
fibroblast growth factor receptor-like 1
|
|
chr19_-_55524445
|
3.518
|
NM_004977
|
KCNC3
|
potassium voltage-gated channel, Shaw-related subfamily, member 3
|
|
chr12_+_130945215
|
3.513
|
NM_003565
|
ULK1
|
unc-51-like kinase 1 (C. elegans)
|
|
chr19_+_659766
|
3.492
|
NM_001040134
NM_002579
|
PALM
|
paralemmin
|
|
chr14_-_104718565
|
3.459
|
NM_177533
|
NUDT14
|
nudix (nucleoside diphosphate linked moiety X)-type motif 14
|
|
chr8_-_144722141
|
3.454
|
|
C8orf73
|
chromosome 8 open reading frame 73
|
|
chr10_+_134060681
|
3.442
|
NM_001098637
NM_138499
|
PWWP2B
|
PWWP domain containing 2B
|
|
chr16_+_84202515
|
3.404
|
NM_001134473
|
KIAA0182
|
KIAA0182
|
|
chr17_+_35751796
|
3.396
|
NM_001024809
|
RARA
|
retinoic acid receptor, alpha
|
|
chr1_+_178466064
|
3.348
|
NM_033343
|
LHX4
|
LIM homeobox 4
|
|
chr15_-_73530829
|
3.325
|
NM_015477
|
SIN3A
|
SIN3 homolog A, transcription regulator (yeast)
|
|
chr20_-_21442663
|
3.288
|
NM_002509
|
NKX2-2
|
NK2 homeobox 2
|
|
chr19_+_2220515
|
3.261
|
NM_004152
|
OAZ1
SPPL2B
|
ornithine decarboxylase antizyme 1
signal peptide peptidase-like 2B
|
|
chr10_+_135042684
|
3.241
|
NM_152911
NM_207127
NM_207128
|
PAOX
|
polyamine oxidase (exo-N4-amino)
|
|
chr6_+_33046636
|
3.237
|
NM_001113182
|
BRD2
|
bromodomain containing 2
|
|
chr19_+_47480445
|
3.226
|
NM_015125
|
CIC
|
capicua homolog (Drosophila)
|
|
chr20_-_60375695
|
3.212
|
NM_005560
|
LAMA5
|
laminin, alpha 5
|
|
chr20_+_42807901
|
3.185
|
NM_022358
|
KCNK15
|
potassium channel, subfamily K, member 15
|
|
chr9_+_138497767
|
3.163
|
NM_152571
|
C9orf163
|
chromosome 9 open reading frame 163
|
|
chr7_+_2525922
|
3.154
|
NM_001040167
NM_001040168
|
LFNG
|
LFNG O-fucosylpeptide 3-beta-N-acetylglucosaminyltransferase
|
|
chr1_+_1940605
|
3.140
|
NM_000815
|
GABRD
|
gamma-aminobutyric acid (GABA) A receptor, delta
|
|
chr7_-_149101227
|
3.132
|
NM_207336
|
ZNF467
|
zinc finger protein 467
|
|
chr3_-_12983959
|
3.124
|
NM_014869
|
IQSEC1
|
IQ motif and Sec7 domain 1
|
|
chr3_+_128874458
|
3.111
|
NM_172027
|
ABTB1
|
ankyrin repeat and BTB (POZ) domain containing 1
|
|
chr15_+_38520594
|
3.068
|
NM_014952
|
BAHD1
|
bromo adjacent homology domain containing 1
|
|
chr10_+_134893766
|
3.066
|
NM_003577
|
UTF1
|
undifferentiated embryonic cell transcription factor 1
|
|
chr16_-_265868
|
3.053
|
NM_003834
NM_183337
|
RGS11
|
regulator of G-protein signaling 11
|
|
chr19_+_590878
|
3.025
|
NM_020637
|
FGF22
|
fibroblast growth factor 22
|
|
chr19_+_54872304
|
3.009
|
NM_001536
NM_198318
|
PRMT1
|
protein arginine methyltransferase 1
|
|
chr8_-_103735194
|
2.989
|
NM_001032282
|
KLF10
|
Kruppel-like factor 10
|
|
chr17_+_72880831
|
2.986
|
NM_001113493
|
SEPT9
|
septin 9
|
|
chr11_-_64167361
|
2.972
|
NM_138734
|
NRXN2
|
neurexin 2
|
|
chr19_+_54872220
|
2.944
|
|
PRMT1
|
protein arginine methyltransferase 1
|
|
chr16_+_49139694
|
2.942
|
NM_033119
|
NKD1
|
naked cuticle homolog 1 (Drosophila)
|
|
chr14_+_20608179
|
2.942
|
NM_018071
|
ARHGEF40
|
Rho guanine nucleotide exchange factor (GEF) 40
|
|
chr1_-_11674264
|
2.920
|
NM_001127325
|
MAD2L2
|
MAD2 mitotic arrest deficient-like 2 (yeast)
|
|
chr16_-_342399
|
2.899
|
NM_003502
NM_181050
|
AXIN1
|
axin 1
|
|
chr9_+_138726737
|
2.897
|
NM_152421
|
FAM69B
|
family with sequence similarity 69, member B
|
|
chr1_+_945472
|
2.872
|
|
AGRN
|
agrin
|
|
chr16_+_67697622
|
2.835
|
NM_138612
|
HAS3
|
hyaluronan synthase 3
|
|
chr16_+_87765661
|
2.834
|
NM_004933
|
CDH15
|
cadherin 15, type 1, M-cadherin (myotubule)
|
|
chrX_+_138060
|
2.821
|
NM_018390
|
PLCXD1
|
phosphatidylinositol-specific phospholipase C, X domain containing 1
|
|
chr5_-_134397740
|
2.782
|
NM_002653
|
PITX1
|
paired-like homeodomain 1
|
|
chr9_+_138341752
|
2.770
|
NM_001145638
NM_015597
|
GPSM1
|
G-protein signaling modulator 1
|
|
chr11_+_17714070
|
2.754
|
NM_001112741
NM_004976
|
KCNC1
|
potassium voltage-gated channel, Shaw-related subfamily, member 1
|
|
chr1_+_945331
|
2.741
|
NM_198576
|
AGRN
|
agrin
|
|
chr16_-_695719
|
2.733
|
NM_153350
|
FBXL16
|
F-box and leucine-rich repeat protein 16
|
|
chr19_-_7896974
|
2.726
|
NM_206833
|
CTXN1
|
cortexin 1
|
|
chr19_+_748448
|
2.715
|
|
PTBP1
|
polypyrimidine tract binding protein 1
|
|
chr9_-_138497311
|
2.704
|
|
|
|
|
chr19_+_55571493
|
2.697
|
NM_007121
|
NR1H2
|
nuclear receptor subfamily 1, group H, member 2
|
|
chr19_-_2672337
|
2.696
|
NM_145173
|
DIRAS1
|
DIRAS family, GTP-binding RAS-like 1
|
|
chr9_-_34579679
|
2.695
|
NM_001842
NM_147164
|
CNTFR
|
ciliary neurotrophic factor receptor
|
|
chr8_+_37672427
|
2.688
|
NM_025069
|
ZNF703
|
zinc finger protein 703
|
|
chr7_-_102044374
|
2.671
|
|
RASA4
|
RAS p21 protein activator 4
|
|
chr19_+_748444
|
2.661
|
|
PTBP1
|
polypyrimidine tract binding protein 1
|
|
chr1_+_18306823
|
2.659
|
NM_032880
|
IGSF21
|
immunoglobin superfamily, member 21
|
|
chr14_+_104261578
|
2.658
|
NM_152328
|
ADSSL1
|
adenylosuccinate synthase like 1
|
|
chr19_+_2220529
|
2.645
|
|
OAZ1
|
ornithine decarboxylase antizyme 1
|
|
chr1_+_945399
|
2.638
|
|
|
|
|
chr17_+_27617307
|
2.633
|
NM_138328
|
RHBDL3
|
rhomboid, veinlet-like 3 (Drosophila)
|
|
chr20_+_60918836
|
2.632
|
NM_001853
|
COL9A3
|
collagen, type IX, alpha 3
|
|
chr17_-_34157962
|
2.627
|
NM_007144
|
PCGF2
|
polycomb group ring finger 2
|
|
chr19_+_2220526
|
2.619
|
|
OAZ1
|
ornithine decarboxylase antizyme 1
|
|
chr9_+_139006663
|
2.616
|
NM_183241
|
C9orf142
|
chromosome 9 open reading frame 142
|
|
chr11_+_113435506
|
2.615
|
|
ZBTB16
|
zinc finger and BTB domain containing 16
|
|
chr11_-_69343128
|
2.609
|
NM_005247
|
FGF3
|
fibroblast growth factor 3
|
|
chr19_+_1199548
|
2.579
|
NM_177401
|
MIDN
|
midnolin
|
|
chr11_+_2422747
|
2.577
|
NM_000218
|
KCNQ1
|
potassium voltage-gated channel, KQT-like subfamily, member 1
|
|
chr12_+_93066370
|
2.574
|
NM_005761
|
PLXNC1
|
plexin C1
|
|
chr17_+_7151653
|
2.573
|
|
EIF5A
|
eukaryotic translation initiation factor 5A
|
|
chr11_+_113435640
|
2.554
|
NM_006006
|
ZBTB16
|
zinc finger and BTB domain containing 16
|
|
chr2_-_219558517
|
2.552
|
NM_017521
|
FEV
|
FEV (ETS oncogene family)
|
|
chr1_-_1233109
|
2.539
|
NM_030649
|
ACAP3
|
ArfGAP with coiled-coil, ankyrin repeat and PH domains 3
|
|
chr17_+_44927591
|
2.537
|
NM_002507
|
NGFR
|
nerve growth factor receptor
|
|
chr17_-_78199384
|
2.533
|
NM_019613
|
WDR45L
|
WDR45-like
|
|
chr20_-_30534848
|
2.509
|
NM_080616
|
C20orf112
|
chromosome 20 open reading frame 112
|
|
chr7_-_102044419
|
2.504
|
NM_001079877
NM_006989
|
RASA4
|
RAS p21 protein activator 4
|
|
chr17_+_75366524
|
2.497
|
NM_005189
NM_032647
|
CBX2
|
chromobox homolog 2
|
|
chr19_-_242168
|
2.494
|
NM_177543
|
PPAP2C
|
phosphatidic acid phosphatase type 2C
|
|
chr17_+_7151984
|
2.485
|
NM_001143761
|
EIF5A
|
eukaryotic translation initiation factor 5A
|
|
chr1_+_3679168
|
2.483
|
NM_001163724
|
LOC388588
|
hypothetical protein LOC388588
|
|
chr10_+_135343649
|
2.481
|
NM_012147
|
DUX2
|
double homeobox 2
|
|
chr22_-_26527469
|
2.476
|
NM_002430
|
MN1
|
meningioma (disrupted in balanced translocation) 1
|
|
chr19_-_242335
|
2.461
|
NM_003712
NM_177526
|
PPAP2C
|
phosphatidic acid phosphatase type 2C
|
|
chr12_+_47658502
|
2.450
|
NM_005430
|
WNT1
|
wingless-type MMTV integration site family, member 1
|
|
chr16_+_1062756
|
2.449
|
NM_001172560
|
SSTR5
|
somatostatin receptor 5
|
|
chr17_+_7151368
|
2.434
|
NM_001970
|
EIF5A
|
eukaryotic translation initiation factor 5A
|
|
chr17_+_30498948
|
2.433
|
NM_001033576
NM_173167
|
UNC45B
|
unc-45 homolog B (C. elegans)
|
|
chr19_+_45996881
|
2.432
|
NM_080732
|
EGLN2
|
egl nine homolog 2 (C. elegans)
|
|
chr18_+_53253775
|
2.419
|
NM_004852
|
ONECUT2
|
one cut homeobox 2
|
|
chr16_+_11669736
|
2.416
|
NM_003498
|
SNN
|
stannin
|
|
chr17_+_24095135
|
2.407
|
NM_004295
|
TRAF4
|
TNF receptor-associated factor 4
|
|
chr13_+_113574925
|
2.405
|
NM_001143945
|
GAS6
|
growth arrest-specific 6
|
|
chr14_+_102659464
|
2.394
|
|
TNFAIP2
|
tumor necrosis factor, alpha-induced protein 2
|
|
chr18_+_75261231
|
2.381
|
NM_172387
NM_172389
|
NFATC1
|
nuclear factor of activated T-cells, cytoplasmic, calcineurin-dependent 1
|
|
chr8_-_41624030
|
2.358
|
NM_152568
|
NKX6-3
|
NK6 homeobox 3
|
|
chr17_+_62391216
|
2.357
|
NM_014405
|
CACNG4
|
calcium channel, voltage-dependent, gamma subunit 4
|
|
chr20_-_62181231
|
2.354
|
NM_005873
|
RGS19
|
regulator of G-protein signaling 19
|
|
chr22_-_49050847
|
2.348
|
NM_002751
|
MAPK11
|
mitogen-activated protein kinase 11
|
|
chr3_-_51976428
|
2.346
|
NM_020418
NM_001174100
NM_033008
|
PCBP4
|
poly(rC) binding protein 4
|
|
chr10_+_133850325
|
2.342
|
NM_006426
|
DPYSL4
|
dihydropyrimidinase-like 4
|
|
chr10_+_119292699
|
2.318
|
|
|
|
|
chr14_-_104515738
|
2.301
|
NM_138420
|
AHNAK2
|
AHNAK nucleoprotein 2
|
|
chr19_-_1062972
|
2.282
|
|
SBNO2
|
strawberry notch homolog 2 (Drosophila)
|
|
chr9_-_101621964
|
2.280
|
|
|
|
|
chr17_+_26839143
|
2.280
|
|
RAB11FIP4
|
RAB11 family interacting protein 4 (class II)
|
|
chr20_-_62181588
|
2.271
|
NM_001039467
|
RGS19
|
regulator of G-protein signaling 19
|
|
chr19_+_2200112
|
2.270
|
NM_000479
|
AMH
|
anti-Mullerian hormone
|
|
chr17_-_44047299
|
2.258
|
NM_024016
|
HOXB8
|
homeobox B8
|
|
chr11_+_817584
|
2.250
|
NM_173584
|
EFCAB4A
|
EF-hand calcium binding domain 4A
|
|
chr3_+_50167424
|
2.247
|
|
SEMA3F
|
sema domain, immunoglobulin domain (Ig), short basic domain, secreted, (semaphorin) 3F
|
|
chr8_+_145461356
|
2.245
|
NM_001008271
NM_001080514
|
SCXA
SCXB
|
scleraxis homolog A (mouse)
scleraxis homolog B (mouse)
|
|
chr19_-_15421761
|
2.242
|
NM_021241
|
WIZ
|
widely interspaced zinc finger motifs
|
|
chr17_+_72880967
|
2.229
|
|
SEPT9
|
septin 9
|
|
chr14_+_104337923
|
2.228
|
NM_001137601
|
ZBTB42
|
zinc finger and BTB domain containing 42
|
|
chr9_-_95757448
|
2.216
|
|
BARX1
|
BARX homeobox 1
|
|
chr19_-_36531958
|
2.186
|
NM_020856
|
TSHZ3
|
teashirt zinc finger homeobox 3
|
|
chr19_+_45996940
|
2.184
|
|
EGLN2
|
egl nine homolog 2 (C. elegans)
|
|
chr1_-_6243621
|
2.180
|
NM_207370
|
GPR153
|
G protein-coupled receptor 153
|
|
chr15_-_73531082
|
2.168
|
NM_001145358
|
SIN3A
|
SIN3 homolog A, transcription regulator (yeast)
|
|
chr14_+_103674812
|
2.148
|
NM_015656
|
KIF26A
|
kinesin family member 26A
|
|
chr7_-_127458231
|
2.145
|
NM_022143
|
LRRC4
|
leucine rich repeat containing 4
|
|
chr10_-_88116181
|
2.139
|
NM_017551
|
GRID1
|
glutamate receptor, ionotropic, delta 1
|
|
chr19_+_59333232
|
2.130
|
NM_014516
|
CNOT3
|
CCR4-NOT transcription complex, subunit 3
|
|
chr8_-_144750987
|
2.129
|
NM_001130053
NM_001130055
NM_001130056
NM_001195203
NM_001960
NM_032378
|
EEF1D
|
eukaryotic translation elongation factor 1 delta (guanine nucleotide exchange protein)
|
|
chr4_+_191232653
|
2.118
|
NM_033178
NM_012147
NM_001177376
NM_001127387
NM_001127388
NM_001127389
NM_001164467
NM_001127386
|
DUX4
DUX2
DUX4L4
DUX4L7
DUX4L6
DUX4L5
DUX4L3
DUX4L2
|
double homeobox 4
double homeobox 2
double homeobox 4 like 4
double homeobox 4 like 7
double homeobox 4 like 6
double homeobox 4 like 5
double homeobox 4 like 3
double homeobox 4 like 2
|
|
chr17_+_26060617
|
2.118
|
|
|
|
|
chr19_+_3310138
|
2.102
|
NM_205843
|
NFIC
|
nuclear factor I/C (CCAAT-binding transcription factor)
|
|
chr19_-_45888259
|
2.099
|
NM_004756
|
NUMBL
|
numb homolog (Drosophila)-like
|
|
chr1_+_2975590
|
2.099
|
NM_022114
NM_199454
|
PRDM16
|
PR domain containing 16
|
|
chr8_-_10625352
|
2.095
|
NM_031439
|
SOX7
|
SRY (sex determining region Y)-box 7
|
|
chr4_-_5940893
|
2.088
|
|
CRMP1
|
collapsin response mediator protein 1
|
|
chr16_+_1143241
|
2.077
|
NM_001005407
NM_021098
|
CACNA1H
|
calcium channel, voltage-dependent, T type, alpha 1H subunit
|
|
chr20_+_60558104
|
2.072
|
NM_178463
|
C20orf166
|
chromosome 20 open reading frame 166
|
|
chr19_+_7891884
|
2.062
|
|
SNAPC2
|
small nuclear RNA activating complex, polypeptide 2, 45kDa
|
|
chr19_-_55914837
|
2.059
|
|
|
|
|
chr7_-_525556
|
2.029
|
|
PDGFA
|
platelet-derived growth factor alpha polypeptide
|
|
chr17_+_24944605
|
2.026
|
NM_152345
|
ANKRD13B
|
ankyrin repeat domain 13B
|
|
chr22_+_48951286
|
2.023
|
NM_001160300
NM_052839
|
PANX2
|
pannexin 2
|
|
chr19_-_60557875
|
2.004
|
NM_144613
|
COX6B2
|
cytochrome c oxidase subunit VIb polypeptide 2 (testis)
|
|
chr19_+_748452
|
2.002
|
|
PTBP1
|
polypyrimidine tract binding protein 1
|
|
chr19_-_772966
|
1.998
|
|
LPPR3
|
lipid phosphate phosphatase-related protein type 3
|
|
chr20_+_60906605
|
1.971
|
NM_007346
|
OGFR
|
opioid growth factor receptor
|
|
chr17_+_45993338
|
1.957
|
NM_018896
NM_198376
NM_198377
NM_198378
NM_198379
NM_198380
NM_198382
NM_198383
NM_198384
NM_198385
NM_198386
NM_198387
NM_198388
NM_198396
NM_198397
|
CACNA1G
|
calcium channel, voltage-dependent, T type, alpha 1G subunit
|
|
chr19_+_61344501
|
1.953
|
|
ZNF444
|
zinc finger protein 444
|
|
chr2_+_5750229
|
1.951
|
NM_003108
|
SOX11
|
SRY (sex determining region Y)-box 11
|
|
chr1_+_11674365
|
1.949
|
NM_198545
|
C1orf187
|
chromosome 1 open reading frame 187
|
|
chr19_+_1226510
|
1.947
|
NM_017914
|
C19orf24
|
chromosome 19 open reading frame 24
|
|
chr8_+_21956335
|
1.943
|
NM_003867
|
FGF17
|
fibroblast growth factor 17
|
|
chr22_+_43476710
|
1.929
|
NM_181333
|
PRR5
|
proline rich 5 (renal)
|
|
chr19_-_50963942
|
1.929
|
|
|
|
|
chr17_+_72376022
|
1.928
|
NM_144677
|
MGAT5B
|
mannosyl (alpha-1,6-)-glycoprotein beta-1,6-N-acetyl-glucosaminyltransferase, isozyme B
|
|
chr19_-_55763091
|
1.926
|
NM_001080457
|
LRRC4B
|
leucine rich repeat containing 4B
|
|
chr2_-_43306650
|
1.905
|
|
ZFP36L2
|
zinc finger protein 36, C3H type-like 2
|
|
chr19_+_8180179
|
1.897
|
NM_024552
|
LASS4
|
LAG1 homolog, ceramide synthase 4
|
|
chr17_-_76622967
|
1.894
|
|
FLJ90757
|
hypothetical LOC440465
|
|
chr4_+_1764802
|
1.890
|
NM_000142
NM_001163213
NM_022965
|
FGFR3
|
fibroblast growth factor receptor 3
|
|
chr17_-_70367479
|
1.883
|
NM_000835
|
GRIN2C
|
glutamate receptor, ionotropic, N-methyl D-aspartate 2C
|
|
chr2_-_72228427
|
1.875
|
NM_019885
|
CYP26B1
|
cytochrome P450, family 26, subfamily B, polypeptide 1
|
|
chr20_-_26137755
|
1.872
|
|
LOC284801
|
hypothetical protein LOC284801
|
|
chr22_+_35777561
|
1.862
|
NM_024681
|
KCTD17
|
potassium channel tetramerisation domain containing 17
|
|
chr17_-_2250967
|
1.860
|
NM_020310
|
MNT
|
MAX binding protein
|
|
chr8_+_22513043
|
1.860
|
NM_001013842
NM_001198827
NM_173686
|
C8orf58
|
chromosome 8 open reading frame 58
|
|
chr18_+_75256702
|
1.854
|
NM_006162
NM_172388
NM_172390
|
NFATC1
|
nuclear factor of activated T-cells, cytoplasmic, calcineurin-dependent 1
|
|
chrX_+_152606945
|
1.854
|
NM_001142805
NM_005629
|
SLC6A8
|
solute carrier family 6 (neurotransmitter transporter, creatine), member 8
|
|
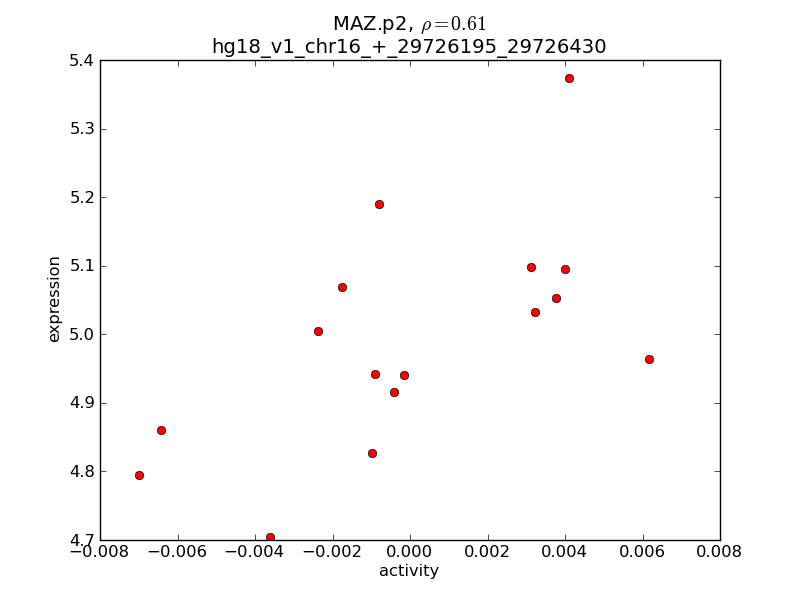
chr16_+_29724926
|
1.852
|
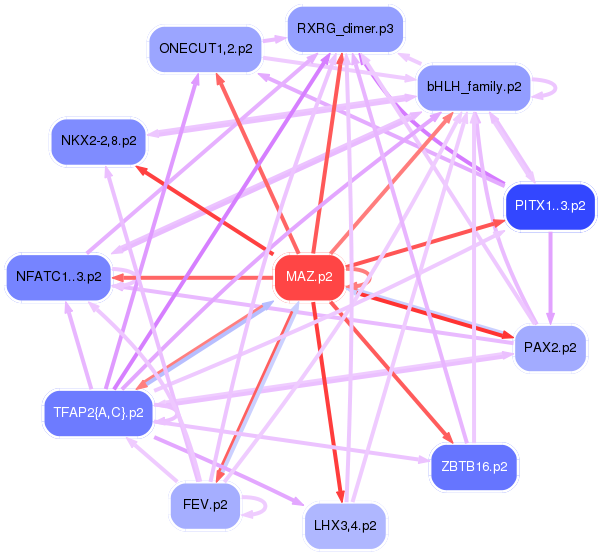
|
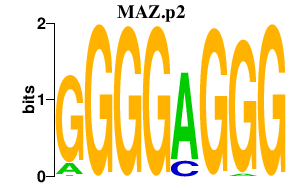
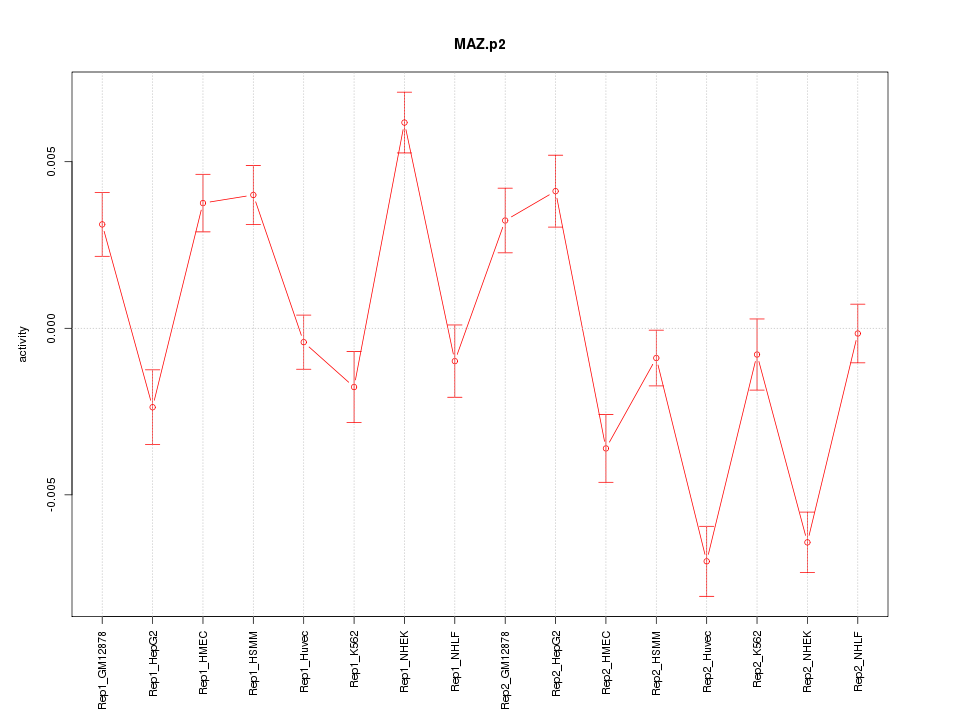
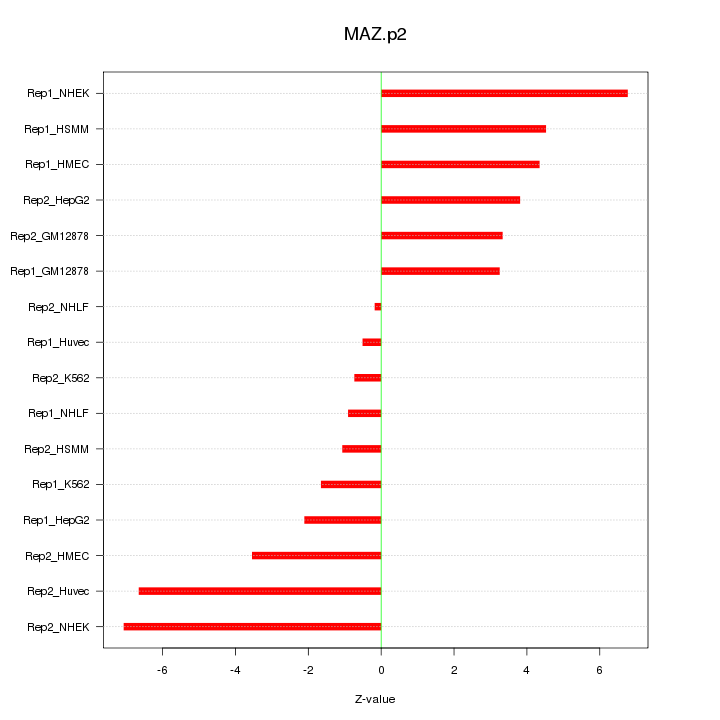
MAZ
|
MYC-associated zinc finger protein (purine-binding transcription factor)
|
|
chr19_-_772913
|
1.850
|
NM_024888
|
LPPR3
|
lipid phosphate phosphatase-related protein type 3
|
|
chr7_+_150414704
|
1.850
|
NM_001042535
NM_031946
|
AGAP3
|
ArfGAP with GTPase domain, ankyrin repeat and PH domain 3
|
|
chr19_+_59333287
|
1.846
|
|
CNOT3
|
CCR4-NOT transcription complex, subunit 3
|
|
chr1_+_41022066
|
1.845
|
NM_004700
NM_172163
|
KCNQ4
|
potassium voltage-gated channel, KQT-like subfamily, member 4
|
|
chr16_+_2138688
|
1.837
|
|
RAB26
|
RAB26, member RAS oncogene family
|
|
chr6_+_43846735
|
1.837
|
|
VEGFA
|
vascular endothelial growth factor A
|
|
chr1_+_1971762
|
1.820
|
NM_002744
|
PRKCZ
|
protein kinase C, zeta
|