|
chr20_+_42947754
|
1.392
|
NM_003404
NM_139323
|
YWHAB
|
tyrosine 3-monooxygenase/tryptophan 5-monooxygenase activation protein, beta polypeptide
|
|
chr20_+_42947764
|
1.342
|
|
YWHAB
|
tyrosine 3-monooxygenase/tryptophan 5-monooxygenase activation protein, beta polypeptide
|
|
chr15_+_36332258
|
0.988
|
NM_152594
|
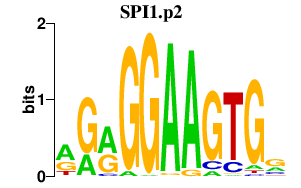
SPRED1
|
sprouty-related, EVH1 domain containing 1
|
|
chr11_+_61352348
|
0.964
|
|
FADS2
|
fatty acid desaturase 2
|
|
chr3_-_107070400
|
0.952
|
NM_170662
|
CBLB
|
Cas-Br-M (murine) ecotropic retroviral transforming sequence b
|
|
chr17_+_24742068
|
0.947
|
NM_020791
|
TAOK1
|
TAO kinase 1
|
|
chr3_+_189354167
|
0.928
|
NM_001167672
|
LPP
|
LIM domain containing preferred translocation partner in lipoma
|
|
chr3_-_88190737
|
0.902
|
NM_001008390
NM_003663
|
CGGBP1
|
CGG triplet repeat binding protein 1
|
|
chr1_+_67168470
|
0.881
|
NM_001077701
NM_001077704
|
MIER1
|
mesoderm induction early response 1 homolog (Xenopus laevis)
|
|
chr2_+_46779827
|
0.814
|
NM_144949
|
SOCS5
|
suppressor of cytokine signaling 5
|
|
chr2_+_85051687
|
0.777
|
NM_020122
|
KCMF1
|
potassium channel modulatory factor 1
|
|
chr14_+_85069217
|
0.758
|
|
|
|
|
chr8_+_104582151
|
0.747
|
NM_001100117
|
RIMS2
|
regulating synaptic membrane exocytosis 2
|
|
chr11_+_61352209
|
0.744
|
NM_004265
|
FADS2
|
fatty acid desaturase 2
|
|
chr17_+_4683280
|
0.741
|
NM_001024937
NM_015716
NM_153827
NM_170663
|
MINK1
|
misshapen-like kinase 1
|
|
chr6_+_87921980
|
0.725
|
NM_015021
|
ZNF292
|
zinc finger protein 292
|
|
chr3_+_108724472
|
0.718
|
NM_001142568
NM_020235
|
BBX
|
bobby sox homolog (Drosophila)
|
|
chr14_-_47213906
|
0.703
|
NM_001113498
|
MDGA2
|
MAM domain containing glycosylphosphatidylinositol anchor 2
|
|
chr3_+_132095496
|
0.696
|
|
ATP2C1
|
ATPase, Ca++ transporting, type 2C, member 1
|
|
chr2_+_46779553
|
0.687
|
NM_014011
|
SOCS5
|
suppressor of cytokine signaling 5
|
|
chr1_-_166172901
|
0.672
|
NM_001143674
|
BRP44
|
brain protein 44
|
|
chr18_+_30875297
|
0.653
|
NM_014268
|
MAPRE2
|
microtubule-associated protein, RP/EB family, member 2
|
|
chr17_+_35853177
|
0.653
|
NM_001552
|
IGFBP4
|
insulin-like growth factor binding protein 4
|
|
chrX_-_50573759
|
0.646
|
NM_020717
|
SHROOM4
|
shroom family member 4
|
|
chr5_+_60663842
|
0.638
|
NM_020928
|
ZSWIM6
|
zinc finger, SWIM-type containing 6
|
|
chr20_+_19903778
|
0.637
|
|
RIN2
|
Ras and Rab interactor 2
|
|
chr6_+_21701942
|
0.635
|
NM_003107
|
SOX4
|
SRY (sex determining region Y)-box 4
|
|
chr14_+_31616196
|
0.626
|
NM_001030055
NM_001173
|
ARHGAP5
|
Rho GTPase activating protein 5
|
|
chr2_+_27659396
|
0.623
|
NM_032434
|
ZNF512
|
zinc finger protein 512
|
|
chr15_+_65145248
|
0.621
|
NM_005902
|
SMAD3
|
SMAD family member 3
|
|
chr5_+_67547357
|
0.620
|
|
PIK3R1
|
phosphoinositide-3-kinase, regulatory subunit 1 (alpha)
|
|
chr9_-_21965131
|
0.619
|
NM_000077
NM_001195132
|
CDKN2A
|
cyclin-dependent kinase inhibitor 2A (melanoma, p16, inhibits CDK4)
|
|
chr2_+_187163232
|
0.616
|
|
ITGAV
|
integrin, alpha V (vitronectin receptor, alpha polypeptide, antigen CD51)
|
|
chr17_+_43082273
|
0.600
|
NM_002265
|
KPNB1
|
karyopherin (importin) beta 1
|
|
chr15_+_65145215
|
0.597
|
|
SMAD3
|
SMAD family member 3
|
|
chr3_-_189354510
|
0.597
|
|
LOC339929
|
hypothetical LOC339929
|
|
chr7_+_32501665
|
0.589
|
NM_015060
|
AVL9
|
AVL9 homolog (S. cerevisiase)
|
|
chr9_-_5997891
|
0.582
|
NM_001017969
|
KIAA2026
|
KIAA2026
|
|
chr7_+_107171809
|
0.579
|
|
CBLL1
|
Cas-Br-M (murine) ecotropic retroviral transforming sequence-like 1
|
|
chr10_+_31648103
|
0.562
|
NM_001174093
NM_001174095
NM_001174096
NM_030751
|
ZEB1
|
zinc finger E-box binding homeobox 1
|
|
chr10_+_89409332
|
0.554
|
NM_001015880
NM_004670
|
PAPSS2
|
3'-phosphoadenosine 5'-phosphosulfate synthase 2
|
|
chr10_+_121642204
|
0.553
|
NM_007190
|
SEC23IP
|
SEC23 interacting protein
|
|
chr4_+_145786622
|
0.546
|
NM_022475
|
HHIP
|
hedgehog interacting protein
|
|
chr12_+_21546012
|
0.541
|
|
GOLT1B
|
golgi transport 1B
|
|
chr3_-_151904408
|
0.536
|
NM_152394
|
FAM194A
|
family with sequence similarity 194, member A
|
|
chr7_-_4867963
|
0.534
|
NM_020144
|
PAPOLB
|
poly(A) polymerase beta (testis specific)
|
|
chr17_+_43082302
|
0.533
|
|
KPNB1
|
karyopherin (importin) beta 1
|
|
chr3_+_129253977
|
0.533
|
|
SEC61A1
|
Sec61 alpha 1 subunit (S. cerevisiae)
|
|
chr4_+_99401543
|
0.529
|
NM_001100426
NM_001100427
NM_001100428
NM_001100429
NM_001100430
NM_021159
|
RAP1GDS1
|
RAP1, GTP-GDP dissociation stimulator 1
|
|
chr15_+_98960277
|
0.528
|
NM_024708
NM_198243
|
ASB7
|
ankyrin repeat and SOCS box containing 7
|
|
chr6_+_7052985
|
0.526
|
NM_001003698
NM_001003699
NM_001003700
|
RREB1
|
ras responsive element binding protein 1
|
|
chr3_-_126576693
|
0.524
|
NM_021964
|
ZNF148
|
zinc finger protein 148
|
|
chr16_+_54100482
|
0.522
|
|
LPCAT2
|
lysophosphatidylcholine acyltransferase 2
|
|
chr7_+_107171514
|
0.518
|
NM_024814
|
CBLL1
|
Cas-Br-M (murine) ecotropic retroviral transforming sequence-like 1
|
|
chr7_+_17304707
|
0.515
|
NM_001621
|
AHR
|
aryl hydrocarbon receptor
|
|
chr17_+_2443983
|
0.504
|
|
PAFAH1B1
|
platelet-activating factor acetylhydrolase 1b, regulatory subunit 1 (45kDa)
|
|
chr7_+_106596641
|
0.498
|
NM_012257
|
HBP1
|
HMG-box transcription factor 1
|
|
chr12_+_8958397
|
0.496
|
NM_004426
|
PHC1
|
polyhomeotic homolog 1 (Drosophila)
|
|
chr2_+_218790143
|
0.489
|
|
ARPC2
|
actin related protein 2/3 complex, subunit 2, 34kDa
|
|
chr13_+_25726755
|
0.488
|
NM_001260
|
CDK8
|
cyclin-dependent kinase 8
|
|
chr12_+_21545965
|
0.477
|
NM_016072
|
GOLT1B
|
golgi transport 1B
|
|
chr22_+_39818553
|
0.474
|
NM_001429
|
EP300
|
E1A binding protein p300
|
|
chr15_+_83724743
|
0.471
|
NM_006738
NM_007200
|
AKAP13
|
A kinase (PRKA) anchor protein 13
|
|
chr2_+_85051942
|
0.471
|
|
KCMF1
|
potassium channel modulatory factor 1
|
|
chr10_-_27189898
|
0.468
|
|
ABI1
|
abl-interactor 1
|
|
chr2_+_148495043
|
0.463
|
NM_018328
|
MBD5
|
methyl-CpG binding domain protein 5
|
|
chr8_+_64243662
|
0.461
|
NM_152758
|
YTHDF3
|
YTH domain family, member 3
|
|
chr3_+_195889845
|
0.460
|
|
FAM43A
|
family with sequence similarity 43, member A
|
|
chr1_+_166172545
|
0.455
|
|
DCAF6
|
DDB1 and CUL4 associated factor 6
|
|
chr2_+_218790109
|
0.455
|
NM_152862
|
ARPC2
|
actin related protein 2/3 complex, subunit 2, 34kDa
|
|
chr2_+_74007495
|
0.454
|
|
DGUOK
|
deoxyguanosine kinase
|
|
chr14_+_96038521
|
0.453
|
|
PAPOLA
|
poly(A) polymerase alpha
|
|
chr20_+_16658608
|
0.449
|
NM_003092
NM_198220
|
SNRPB2
|
small nuclear ribonucleoprotein polypeptide B
|
|
chr2_+_218790364
|
0.448
|
NM_005731
|
ARPC2
|
actin related protein 2/3 complex, subunit 2, 34kDa
|
|
chr14_+_96038479
|
0.448
|
|
PAPOLA
|
poly(A) polymerase alpha
|
|
chr16_+_54100545
|
0.444
|
|
LPCAT2
|
lysophosphatidylcholine acyltransferase 2
|
|
chr12_+_64504835
|
0.441
|
|
HMGA2
|
high mobility group AT-hook 2
|
|
chr2_-_148494732
|
0.441
|
NM_001190882
NM_001190879
NM_002552
NM_001190881
NM_181741
|
ORC4
|
origin recognition complex, subunit 4
|
|
chr8_+_64243741
|
0.440
|
|
YTHDF3
|
YTH domain family, member 3
|
|
chr4_+_184257337
|
0.440
|
NM_024949
|
WWC2
|
WW and C2 domain containing 2
|
|
chr5_+_118719591
|
0.439
|
|
TNFAIP8
|
tumor necrosis factor, alpha-induced protein 8
|
|
chr10_-_31647925
|
0.438
|
|
LOC220930
|
hypothetical LOC220930
|
|
chr3_+_180348818
|
0.437
|
NM_006218
|
PIK3CA
|
phosphoinositide-3-kinase, catalytic, alpha polypeptide
|
|
chr2_+_74007523
|
0.433
|
|
DGUOK
|
deoxyguanosine kinase
|
|
chr20_+_33223434
|
0.428
|
NM_006404
|
PROCR
|
protein C receptor, endothelial
|
|
chr6_+_149680747
|
0.428
|
|
TAB2
|
TGF-beta activated kinase 1/MAP3K7 binding protein 2
|
|
chr3_+_120495906
|
0.425
|
NM_020754
|
ARHGAP31
|
Rho GTPase activating protein 31
|
|
chr1_+_144188375
|
0.424
|
NM_153713
|
LIX1L
|
Lix1 homolog (mouse)-like
|
|
chr2_+_124499332
|
0.424
|
NM_130773
|
CNTNAP5
|
contactin associated protein-like 5
|
|
chr1_+_111963920
|
0.423
|
NM_001010935
NM_002884
|
RAP1A
|
RAP1A, member of RAS oncogene family
|
|
chr1_+_36169260
|
0.422
|
NM_024852
NM_177422
|
EIF2C3
|
eukaryotic translation initiation factor 2C, 3
|
|
chr1_+_181708068
|
0.420
|
NM_001174061
NM_173156
NM_201568
NM_201569
|
SMG7
|
Smg-7 homolog, nonsense mediated mRNA decay factor (C. elegans)
|
|
chr1_+_181708235
|
0.420
|
|
SMG7
|
Smg-7 homolog, nonsense mediated mRNA decay factor (C. elegans)
|
|
chr15_+_92575767
|
0.420
|
|
MCTP2
|
multiple C2 domains, transmembrane 2
|
|
chr1_-_181708022
|
0.417
|
|
LOC284649
|
hypothetical LOC284649
|
|
chr14_+_96038451
|
0.415
|
NM_032632
|
PAPOLA
|
poly(A) polymerase alpha
|
|
chr3_+_19963534
|
0.414
|
NM_004162
|
RAB5A
|
RAB5A, member RAS oncogene family
|
|
chr15_-_72952648
|
0.414
|
NM_005697
|
SCAMP2
|
secretory carrier membrane protein 2
|
|
chr15_+_66133709
|
0.414
|
|
PIAS1
|
protein inhibitor of activated STAT, 1
|
|
chr16_+_54100410
|
0.412
|
NM_017839
|
LPCAT2
|
lysophosphatidylcholine acyltransferase 2
|
|
chrX_-_134883798
|
0.409
|
NM_173470
|
MMGT1
|
membrane magnesium transporter 1
|
|
chr9_+_33807168
|
0.409
|
NM_017811
|
UBE2R2
|
ubiquitin-conjugating enzyme E2R 2
|
|
chr7_+_114350144
|
0.407
|
|
MDFIC
|
MyoD family inhibitor domain containing
|
|
chr11_+_85017269
|
0.406
|
NM_001193537
NM_001193538
NM_018480
|
TMEM126B
|
transmembrane protein 126B
|
|
chr12_+_109203526
|
0.405
|
|
ATP2A2
|
ATPase, Ca++ transporting, cardiac muscle, slow twitch 2
|
|
chr3_+_98016114
|
0.403
|
NM_001080448
|
EPHA6
|
EPH receptor A6
|
|
chr15_-_54997964
|
0.401
|
|
LOC145783
|
hypothetical LOC145783
|
|
chrX_+_105932536
|
0.400
|
NM_017752
NM_198881
|
TBC1D8B
|
TBC1 domain family, member 8B (with GRAM domain)
|
|
chr2_+_74007439
|
0.399
|
NM_080916
NM_080918
|
DGUOK
|
deoxyguanosine kinase
|
|
chr4_+_183302105
|
0.398
|
|
ODZ3
|
odz, odd Oz/ten-m homolog 3 (Drosophila)
|
|
chr2_-_148495642
|
0.396
|
NM_181742
|
ORC4
|
origin recognition complex, subunit 4
|
|
chr8_-_101384633
|
0.395
|
NM_015435
|
RNF19A
|
ring finger protein 19A
|
|
chr8_+_15442123
|
0.392
|
|
TUSC3
|
tumor suppressor candidate 3
|
|
chr12_-_69289889
|
0.392
|
NM_002837
|
PTPRB
|
protein tyrosine phosphatase, receptor type, B
|
|
chrX_-_44945025
|
0.391
|
NM_024689
NM_176819
|
CXorf36
|
chromosome X open reading frame 36
|
|
chr3_-_169295869
|
0.391
|
NM_014498
|
GOLIM4
|
golgi integral membrane protein 4
|
|
chr14_+_70444191
|
0.391
|
|
PCNX
|
pecanex homolog (Drosophila)
|
|
chr9_+_130354490
|
0.386
|
NM_001130438
NM_001195532
NM_003127
|
SPTAN1
|
spectrin, alpha, non-erythrocytic 1 (alpha-fodrin)
|
|
chr2_+_206847658
|
0.385
|
NM_020923
|
ZDBF2
|
zinc finger, DBF-type containing 2
|
|
chr12_+_60940404
|
0.385
|
NM_006313
|
USP15
|
ubiquitin specific peptidase 15
|
|
chr2_+_44249487
|
0.384
|
NM_001033556
NM_001033557
NM_002706
NM_177968
NM_177969
|
PPM1B
|
protein phosphatase, Mg2+/Mn2+ dependent, 1B
|
|
chr10_+_101409159
|
0.382
|
NM_020354
|
ENTPD7
|
ectonucleoside triphosphate diphosphohydrolase 7
|
|
chr11_+_126378507
|
0.378
|
|
NCRNA00288
|
non-protein coding RNA 288
|
|
chr12_+_95112385
|
0.378
|
|
ELK3
|
ELK3, ETS-domain protein (SRF accessory protein 2)
|
|
chr15_+_54998115
|
0.377
|
NM_003205
NM_207036
NM_207037
NM_207038
|
TCF12
|
transcription factor 12
|
|
chr6_+_7053183
|
0.376
|
|
RREB1
|
ras responsive element binding protein 1
|
|
chr17_+_26446082
|
0.376
|
|
NF1
|
neurofibromin 1
|
|
chr1_+_166172679
|
0.375
|
|
DCAF6
|
DDB1 and CUL4 associated factor 6
|
|
chr8_+_76059262
|
0.374
|
NM_031461
|
CRISPLD1
|
cysteine-rich secretory protein LCCL domain containing 1
|
|
chr4_+_39376058
|
0.371
|
NM_001111112
NM_001111113
NM_005339
|
UBE2K
|
ubiquitin-conjugating enzyme E2K (UBC1 homolog, yeast)
|
|
chr6_+_134315940
|
0.370
|
NM_004865
|
TBPL1
|
TBP-like 1
|
|
chr2_+_137239583
|
0.370
|
|
THSD7B
|
thrombospondin, type I, domain containing 7B
|
|
chr2_+_60836858
|
0.370
|
NM_022894
|
PAPOLG
|
poly(A) polymerase gamma
|
|
chr12_-_53071285
|
0.368
|
NM_001130967
NM_001130968
|
ZNF385A
|
zinc finger protein 385A
|
|
chr14_+_55654900
|
0.368
|
|
PELI2
|
pellino homolog 2 (Drosophila)
|
|
chr3_+_186786655
|
0.367
|
NM_021627
|
SENP2
|
SUMO1/sentrin/SMT3 specific peptidase 2
|
|
chr2_+_48395271
|
0.366
|
NM_002158
|
FOXN2
|
forkhead box N2
|
|
chr14_+_31615959
|
0.365
|
|
ARHGAP5
|
Rho GTPase activating protein 5
|
|
chr5_+_49998528
|
0.362
|
NM_001178056
NM_024615
|
PARP8
|
poly (ADP-ribose) polymerase family, member 8
|
|
chr7_+_32501577
|
0.361
|
|
AVL9
|
AVL9 homolog (S. cerevisiase)
|
|
chr2_+_172658453
|
0.361
|
NM_001038493
NM_178120
|
DLX1
|
distal-less homeobox 1
|
|
chr8_+_15442100
|
0.360
|
NM_006765
NM_178234
|
TUSC3
|
tumor suppressor candidate 3
|
|
chr8_+_15442106
|
0.360
|
|
TUSC3
|
tumor suppressor candidate 3
|
|
chr8_-_93099040
|
0.358
|
NM_175636
|
RUNX1T1
|
runt-related transcription factor 1; translocated to, 1 (cyclin D-related)
|
|
chr14_+_75688025
|
0.358
|
|
C14orf118
|
chromosome 14 open reading frame 118
|
|
chr3_+_102775716
|
0.357
|
NM_020357
|
PCNP
|
PEST proteolytic signal containing nuclear protein
|
|
chr2_+_191222077
|
0.357
|
NM_005966
|
NAB1
|
NGFI-A binding protein 1 (EGR1 binding protein 1)
|
|
chr14_+_28306633
|
0.356
|
|
FOXG1
|
forkhead box G1
|
|
chr12_+_62524778
|
0.356
|
NM_020762
|
SRGAP1
|
SLIT-ROBO Rho GTPase activating protein 1
|
|
chr3_+_88281582
|
0.355
|
NM_173824
|
C3orf38
|
chromosome 3 open reading frame 38
|
|
chr14_+_75687997
|
0.354
|
NM_017926
NM_017972
|
C14orf118
|
chromosome 14 open reading frame 118
|
|
chr3_+_102775677
|
0.354
|
|
PCNP
|
PEST proteolytic signal containing nuclear protein
|
|
chr13_+_110604036
|
0.353
|
|
ARHGEF7
|
Rho guanine nucleotide exchange factor (GEF) 7
|
|
chr2_+_135392879
|
0.353
|
|
CCNT2
|
cyclin T2
|
|
chr13_+_81162030
|
0.353
|
|
|
|
|
chr14_+_54104383
|
0.352
|
NM_001161576
NM_015589
|
SAMD4A
|
sterile alpha motif domain containing 4A
|
|
chr9_+_33807213
|
0.351
|
|
UBE2R2
|
ubiquitin-conjugating enzyme E2R 2
|
|
chr9_+_76893232
|
0.350
|
|
OSTF1
|
osteoclast stimulating factor 1
|
|
chr3_+_150065732
|
0.350
|
NM_001870
|
CPA3
|
carboxypeptidase A3 (mast cell)
|
|
chr6_+_108988797
|
0.349
|
|
FOXO3
|
forkhead box O3
|
|
chr2_+_218790159
|
0.349
|
|
ARPC2
|
actin related protein 2/3 complex, subunit 2, 34kDa
|
|
chr22_+_44446378
|
0.348
|
|
ATXN10
|
ataxin 10
|
|
chr11_-_57752923
|
0.345
|
NM_001004471
|
OR10Q1
|
olfactory receptor, family 10, subfamily Q, member 1
|
|
chr2_-_218516950
|
0.345
|
NM_022648
|
TNS1
|
tensin 1
|
|
chr2_+_71412348
|
0.344
|
NM_001014972
NM_014497
|
ZNF638
|
zinc finger protein 638
|
|
chr2_+_115635982
|
0.344
|
NM_001178034
NM_001004360
|
DPP10
|
dipeptidyl-peptidase 10 (non-functional)
|
|
chr14_+_75688042
|
0.343
|
|
C14orf118
|
chromosome 14 open reading frame 118
|
|
chr17_+_42963737
|
0.342
|
|
NPEPPS
|
aminopeptidase puromycin sensitive
|
|
chr3_+_19963865
|
0.342
|
|
RAB5A
|
RAB5A, member RAS oncogene family
|
|
chr4_+_14613395
|
0.341
|
NM_001177381
NM_001177382
NM_001177383
NM_001177384
NM_182485
NM_182646
|
CPEB2
|
cytoplasmic polyadenylation element binding protein 2
|
|
chr12_+_95112131
|
0.341
|
NM_005230
|
ELK3
|
ELK3, ETS-domain protein (SRF accessory protein 2)
|
|
chr17_-_59923547
|
0.340
|
NM_007215
|
POLG2
|
polymerase (DNA directed), gamma 2, accessory subunit
|
|
chr6_-_46091238
|
0.339
|
NM_016929
|
CLIC5
|
chloride intracellular channel 5
|
|
chr4_+_38722593
|
0.338
|
NM_001007075
NM_001171654
|
KLHL5
|
kelch-like 5 (Drosophila)
|
|
chr1_-_158190585
|
0.338
|
NM_001146172
NM_001146173
NM_033438
|
SLAMF9
|
SLAM family member 9
|
|
chr20_+_52525538
|
0.335
|
NM_018431
|
DOK5
|
docking protein 5
|
|
chr11_+_95762768
|
0.335
|
NM_003772
|
JRKL
|
jerky homolog-like (mouse)
|
|
chr5_+_49998677
|
0.335
|
|
PARP8
|
poly (ADP-ribose) polymerase family, member 8
|
|
chr10_+_17312654
|
0.335
|
|
VIM
|
vimentin
|
|
chrX_-_83644054
|
0.335
|
NM_001177478
NM_001177479
NM_144657
|
HDX
|
highly divergent homeobox
|
|
chr1_+_159899528
|
0.333
|
NM_001002273
NM_001002274
NM_001002275
NM_001190828
NM_004001
|
FCGR2B
FCGR2C
|
Fc fragment of IgG, low affinity IIb, receptor (CD32)
Fc fragment of IgG, low affinity IIc, receptor for (CD32) (gene/pseudogene)
|
|
chr12_-_26982474
|
0.332
|
NM_018164
|
C12orf11
|
chromosome 12 open reading frame 11
|
|
chr17_+_5330936
|
0.330
|
NM_024039
|
MIS12
|
MIS12, MIND kinetochore complex component, homolog (S. pombe)
|
|
chr3_+_129253997
|
0.328
|
|
SEC61A1
|
Sec61 alpha 1 subunit (S. cerevisiae)
|
|
chrX_-_107866262
|
0.327
|
NM_003604
|
IRS4
|
insulin receptor substrate 4
|
|
chr11_+_120399966
|
0.325
|
NM_001130047
NM_152715
|
TBCEL
|
tubulin folding cofactor E-like
|
|
chr14_+_19414230
|
0.324
|
NM_001005501
|
OR4K2
|
olfactory receptor, family 4, subfamily K, member 2
|
|
chr1_+_26671488
|
0.324
|
NM_005517
|
HMGN2
|
high-mobility group nucleosomal binding domain 2
|
|
chr20_+_21231921
|
0.323
|
NM_012255
|
XRN2
|
5'-3' exoribonuclease 2
|
|
chr8_+_126511739
|
0.323
|
NM_025195
|
TRIB1
|
tribbles homolog 1 (Drosophila)
|
|
chr17_+_64019693
|
0.323
|
NM_212471
|
PRKAR1A
|
protein kinase, cAMP-dependent, regulatory, type I, alpha (tissue specific extinguisher 1)
|
|
chr20_+_32928065
|
0.322
|
|
ACSS2
|
acyl-CoA synthetase short-chain family member 2
|
|
chr7_-_32501394
|
0.322
|
NM_001130710
NM_001139499
|
LSM5
|
LSM5 homolog, U6 small nuclear RNA associated (S. cerevisiae)
|
|
chr15_+_75500284
|
0.318
|
NM_018200
|
HMG20A
|
high-mobility group 20A
|
|
chr7_-_82629735
|
0.318
|
|
PCLO
|
piccolo (presynaptic cytomatrix protein)
|
|
chr6_+_160068544
|
0.316
|
|
WTAP
|
Wilms tumor 1 associated protein
|
|
chr9_+_113698844
|
0.316
|
NM_003358
|
UGCG
|
UDP-glucose ceramide glucosyltransferase
|
|
chr10_+_114700775
|
0.315
|
|
TCF7L2
|
transcription factor 7-like 2 (T-cell specific, HMG-box)
|
|
chr17_+_44643067
|
0.315
|
|
ABI3
|
ABI family, member 3
|
|
chr2_+_187162969
|
0.315
|
NM_001145000
NM_002210
|
ITGAV
|
integrin, alpha V (vitronectin receptor, alpha polypeptide, antigen CD51)
|