|
chr15_+_37660568
|
2.568
|
NM_003246
|
THBS1
|
thrombospondin 1
|
|
chrX_-_107866262
|
1.106
|
NM_003604
|
IRS4
|
insulin receptor substrate 4
|
|
chr10_-_95350949
|
1.073
|
NM_006744
|
RBP4
|
retinol binding protein 4, plasma
|
|
chr9_+_111850698
|
1.070
|
NM_001004065
NM_001198656
|
AKAP2
|
A kinase (PRKA) anchor protein 2
|
|
chr4_-_174687104
|
1.037
|
|
HAND2
|
heart and neural crest derivatives expressed 2
|
|
chr1_+_234372454
|
1.000
|
NM_003272
|
GPR137B
|
G protein-coupled receptor 137B
|
|
chr19_-_13808101
|
0.991
|
|
LOC284454
|
hypothetical LOC284454
|
|
chr14_+_100362236
|
0.954
|
|
MEG3
|
maternally expressed 3 (non-protein coding)
|
|
chr14_+_100362204
|
0.951
|
|
MEG3
|
maternally expressed 3 (non-protein coding)
|
|
chr14_+_100270222
|
0.949
|
|
DLK1
|
delta-like 1 homolog (Drosophila)
|
|
chr12_+_6517600
|
0.938
|
|
|
|
|
chr12_+_6179736
|
0.884
|
NM_001769
|
CD9
|
CD9 molecule
|
|
chrX_+_106057984
|
0.847
|
|
CLDN2
|
claudin 2
|
|
chr4_-_174686918
|
0.822
|
|
HAND2
|
heart and neural crest derivatives expressed 2
|
|
chr3_+_171619346
|
0.810
|
NM_005602
|
CLDN11
|
claudin 11
|
|
chr3_-_88190737
|
0.805
|
NM_001008390
NM_003663
|
CGGBP1
|
CGG triplet repeat binding protein 1
|
|
chr9_+_99656013
|
0.764
|
|
|
|
|
chr6_+_31479340
|
0.753
|
NM_000247
NM_001177519
|
MICA
|
MHC class I polypeptide-related sequence A
|
|
chr17_-_25642962
|
0.733
|
NM_000386
|
BLMH
|
bleomycin hydrolase
|
|
chr1_+_36394044
|
0.728
|
|
MAP7D1
|
MAP7 domain containing 1
|
|
chr4_+_76077229
|
0.696
|
NM_015393
|
PARM1
|
prostate androgen-regulated mucin-like protein 1
|
|
chr17_+_4683280
|
0.679
|
NM_001024937
NM_015716
NM_153827
NM_170663
|
MINK1
|
misshapen-like kinase 1
|
|
chr5_+_150008030
|
0.661
|
|
SYNPO
|
synaptopodin
|
|
chrX_+_101792949
|
0.631
|
NM_001099410
NM_001099411
NM_014710
NM_001184727
|
GPRASP1
|
G protein-coupled receptor associated sorting protein 1
|
|
chr20_+_35583020
|
0.619
|
NM_005386
NM_181689
|
NNAT
|
neuronatin
|
|
chrX_+_51653348
|
0.616
|
NM_001005333
NM_006986
|
MAGED1
|
melanoma antigen family D, 1
|
|
chr1_-_90955365
|
0.615
|
NM_020063
|
BARHL2
|
BarH-like homeobox 2
|
|
chr1_+_154351082
|
0.605
|
NM_005572
NM_170707
NM_170708
|
LMNA
|
lamin A/C
|
|
chr19_+_16296632
|
0.602
|
NM_016270
|
KLF2
|
Kruppel-like factor 2 (lung)
|
|
chr21_-_26867138
|
0.598
|
NM_052954
|
CYYR1
|
cysteine/tyrosine-rich 1
|
|
chr22_+_35777561
|
0.594
|
NM_024681
|
KCTD17
|
potassium channel tetramerisation domain containing 17
|
|
chrX_+_153339814
|
0.590
|
NM_017514
|
PLXNA3
|
plexin A3
|
|
chr12_-_51734434
|
0.586
|
|
LOC283335
|
hypothetical LOC283335
|
|
chr9_+_111850770
|
0.582
|
|
AKAP2
|
A kinase (PRKA) anchor protein 2
|
|
chr15_+_38520594
|
0.582
|
NM_014952
|
BAHD1
|
bromo adjacent homology domain containing 1
|
|
chr11_+_43920385
|
0.543
|
NM_001145033
|
C11orf96
|
chromosome 11 open reading frame 96
|
|
chr18_+_19706979
|
0.541
|
NM_000227
NM_001127718
|
LAMA3
|
laminin, alpha 3
|
|
chrX_-_53367246
|
0.539
|
NM_001111125
|
IQSEC2
|
IQ motif and Sec7 domain 2
|
|
chr9_+_78824390
|
0.525
|
NM_001013735
|
FOXB2
|
forkhead box B2
|
|
chr19_+_60816770
|
0.521
|
NM_001195605
|
ZNF865
|
zinc finger protein 865
|
|
chr6_+_21701942
|
0.519
|
NM_003107
|
SOX4
|
SRY (sex determining region Y)-box 4
|
|
chr7_-_150737980
|
0.517
|
NM_198285
|
WDR86
|
WD repeat domain 86
|
|
chr12_+_5411534
|
0.513
|
NM_001102654
|
NTF3
|
neurotrophin 3
|
|
chr17_+_7252225
|
0.511
|
NM_020795
|
NLGN2
|
neuroligin 2
|
|
chr13_+_41520888
|
0.509
|
NM_152910
NM_178009
|
DGKH
|
diacylglycerol kinase, eta
|
|
chr12_-_131697109
|
0.509
|
NM_001195520
|
LOC645277
|
hypothetical LOC645277
|
|
chr7_-_27180398
|
0.506
|
NM_018951
|
HOXA10
|
homeobox A10
|
|
chrX_-_48743561
|
0.495
|
NM_020137
NM_207672
|
GRIPAP1
|
GRIP1 associated protein 1
|
|
chr11_-_56859900
|
0.491
|
NM_003146
|
SSRP1
|
structure specific recognition protein 1
|
|
chrX_-_135941498
|
0.479
|
NM_054021
|
GPR101
|
G protein-coupled receptor 101
|
|
chr10_-_103593529
|
0.477
|
NM_014591
NM_173191
NM_173192
NM_173193
NM_173195
NM_173197
|
KCNIP2
|
Kv channel interacting protein 2
|
|
chr17_-_75427644
|
0.472
|
NM_003655
|
CBX4
|
chromobox homolog 4
|
|
chr19_+_16296734
|
0.471
|
|
KLF2
|
Kruppel-like factor 2 (lung)
|
|
chr12_-_6668880
|
0.469
|
NM_001039917
NM_001039919
NM_001039920
NM_001135734
|
ZNF384
|
zinc finger protein 384
|
|
chrX_+_101887562
|
0.467
|
NM_001142529
NM_001142530
|
BHLHB9
|
basic helix-loop-helix domain containing, class B, 9
|
|
chr9_+_831689
|
0.466
|
NM_021951
|
DMRT1
|
doublesex and mab-3 related transcription factor 1
|
|
chr17_-_42250961
|
0.466
|
NM_030753
|
WNT3
|
wingless-type MMTV integration site family, member 3
|
|
chr16_-_66827449
|
0.455
|
NM_024939
|
ESRP2
|
epithelial splicing regulatory protein 2
|
|
chr2_+_172658453
|
0.454
|
NM_001038493
NM_178120
|
DLX1
|
distal-less homeobox 1
|
|
chr13_+_32488477
|
0.454
|
NM_004795
|
KL
|
klotho
|
|
chr8_-_144995007
|
0.451
|
NM_178564
|
NRBP2
|
nuclear receptor binding protein 2
|
|
chr10_+_75343352
|
0.449
|
|
PLAU
|
plasminogen activator, urokinase
|
|
chr9_+_123501186
|
0.448
|
|
DAB2IP
|
DAB2 interacting protein
|
|
chrX_+_133993984
|
0.444
|
NM_001078171
|
FAM127A
|
family with sequence similarity 127, member A
|
|
chr17_+_56884560
|
0.442
|
|
TBX4
|
T-box 4
|
|
chr5_+_167889123
|
0.441
|
|
|
|
|
chr14_+_105012106
|
0.440
|
NM_001312
|
CRIP2
|
cysteine-rich protein 2
|
|
chr11_+_44074322
|
0.440
|
NM_000401
|
EXT2
|
exostosin 2
|
|
chr16_+_85158357
|
0.437
|
NM_005251
|
FOXC2
|
forkhead box C2 (MFH-1, mesenchyme forkhead 1)
|
|
chr20_+_19903778
|
0.435
|
|
RIN2
|
Ras and Rab interactor 2
|
|
chr12_-_120389419
|
0.433
|
|
KDM2B
|
lysine (K)-specific demethylase 2B
|
|
chr13_+_75108450
|
0.431
|
|
LMO7
|
LIM domain 7
|
|
chr3_+_160964574
|
0.427
|
|
SCHIP1
|
schwannomin interacting protein 1
|
|
chr5_+_76047536
|
0.425
|
NM_001992
|
F2R
|
coagulation factor II (thrombin) receptor
|
|
chr16_+_54070302
|
0.422
|
NM_004530
|
MMP2
|
matrix metallopeptidase 2 (gelatinase A, 72kDa gelatinase, 72kDa type IV collagenase)
|
|
chr3_-_137953876
|
0.421
|
NM_005862
|
STAG1
|
stromal antigen 1
|
|
chr14_-_70345485
|
0.421
|
NM_033141
|
MAP3K9
|
mitogen-activated protein kinase kinase kinase 9
|
|
chr19_-_13910167
|
0.420
|
NM_024825
|
PODNL1
|
podocan-like 1
|
|
chr12_+_6745835
|
0.420
|
|
PTMS
|
parathymosin
|
|
chr12_+_6915698
|
0.418
|
|
|
|
|
chr4_-_109308893
|
0.417
|
NM_001130713
NM_001130714
NM_016269
|
LEF1
|
lymphoid enhancer-binding factor 1
|
|
chr5_+_140835788
|
0.416
|
|
PCDHGC3
|
protocadherin gamma subfamily C, 3
|
|
chr9_-_139027435
|
0.416
|
|
ABCA2
|
ATP-binding cassette, sub-family A (ABC1), member 2
|
|
chr11_-_65396775
|
0.415
|
NM_016938
|
EFEMP2
|
EGF containing fibulin-like extracellular matrix protein 2
|
|
chr5_-_577444
|
0.415
|
NM_004174
|
SLC9A3
|
solute carrier family 9 (sodium/hydrogen exchanger), member 3
|
|
chr2_-_213111525
|
0.408
|
NM_001042599
NM_005235
|
ERBB4
|
v-erb-a erythroblastic leukemia viral oncogene homolog 4 (avian)
|
|
chr16_-_1999760
|
0.406
|
NM_178167
|
ZNF598
|
zinc finger protein 598
|
|
chr8_+_1937711
|
0.405
|
|
KBTBD11
|
kelch repeat and BTB (POZ) domain containing 11
|
|
chr9_-_114858788
|
0.404
|
NM_003408
|
ZFP37
|
zinc finger protein 37 homolog (mouse)
|
|
chr2_+_202607554
|
0.401
|
NM_003507
|
FZD7
|
frizzled homolog 7 (Drosophila)
|
|
chr17_+_56832492
|
0.401
|
|
TBX2
|
T-box 2
|
|
chr17_-_1195096
|
0.400
|
|
PAFAH1B1
|
platelet-activating factor acetylhydrolase 1b, regulatory subunit 1 (45kDa)
|
|
chr9_-_34387786
|
0.400
|
NM_032596
|
C9orf24
|
chromosome 9 open reading frame 24
|
|
chr17_+_38088097
|
0.398
|
NM_003632
|
CNTNAP1
|
contactin associated protein 1
|
|
chr19_+_54786723
|
0.398
|
NM_020719
|
PRR12
|
proline rich 12
|
|
chr5_-_176760242
|
0.397
|
NM_001029886
|
PFN3
|
profilin 3
|
|
chr17_-_928960
|
0.396
|
|
ABR
|
active BCR-related gene
|
|
chr14_-_87859284
|
0.393
|
NM_138317
|
KCNK10
|
potassium channel, subfamily K, member 10
|
|
chr20_+_25176698
|
0.391
|
NM_002862
|
PYGB
|
phosphorylase, glycogen; brain
|
|
chr22_-_49063088
|
0.391
|
|
PLXNB2
|
plexin B2
|
|
chr16_-_73842884
|
0.386
|
NM_001170717
NM_014567
|
BCAR1
|
breast cancer anti-estrogen resistance 1
|
|
chr19_-_3820012
|
0.383
|
NM_001145640
NM_015174
|
ZFR2
|
zinc finger RNA binding protein 2
|
|
chr14_+_64040979
|
0.382
|
NM_001123329
NM_014950
|
ZBTB1
|
zinc finger and BTB domain containing 1
|
|
chr5_+_140835727
|
0.381
|
NM_002588
NM_032402
NM_032403
|
PCDHGC3
|
protocadherin gamma subfamily C, 3
|
|
chr1_-_114156387
|
0.380
|
|
RSBN1
|
round spermatid basic protein 1
|
|
chr10_-_127454379
|
0.380
|
NM_147191
|
MMP21
|
matrix metallopeptidase 21
|
|
chr12_+_6745729
|
0.379
|
NM_002824
|
PTMS
|
parathymosin
|
|
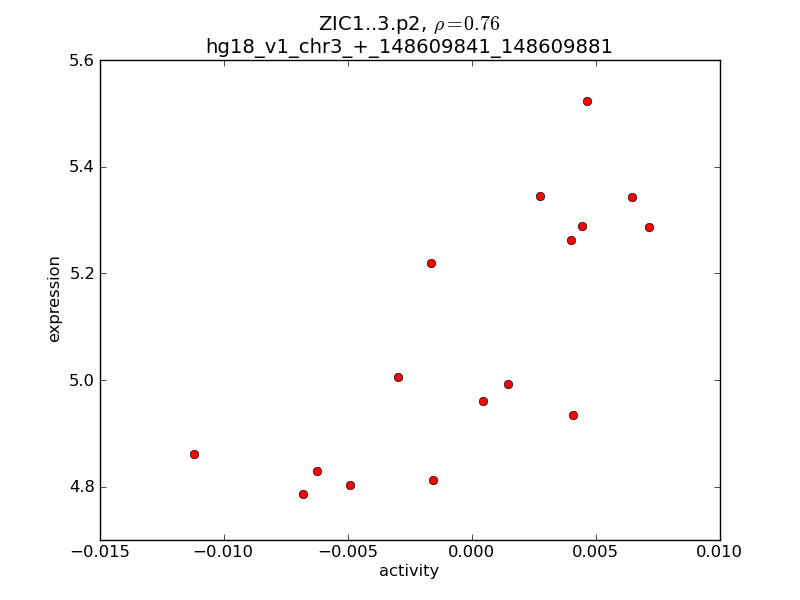
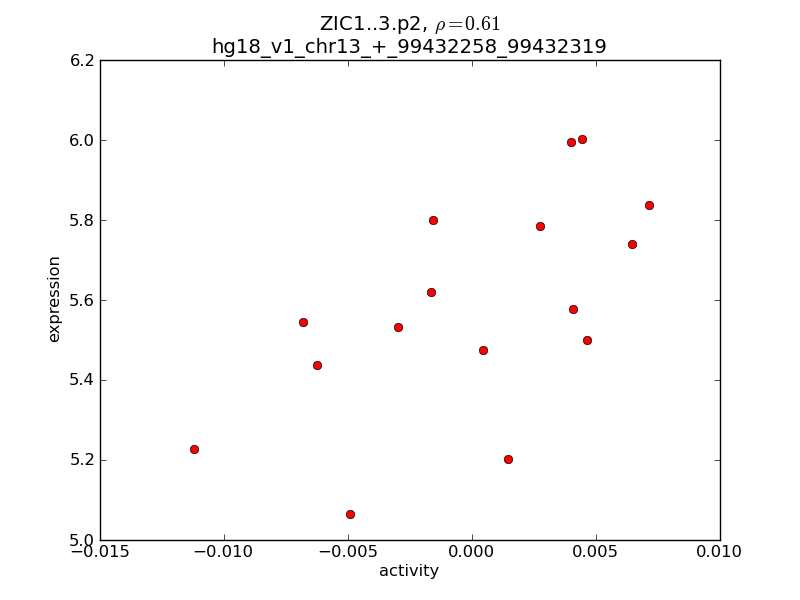
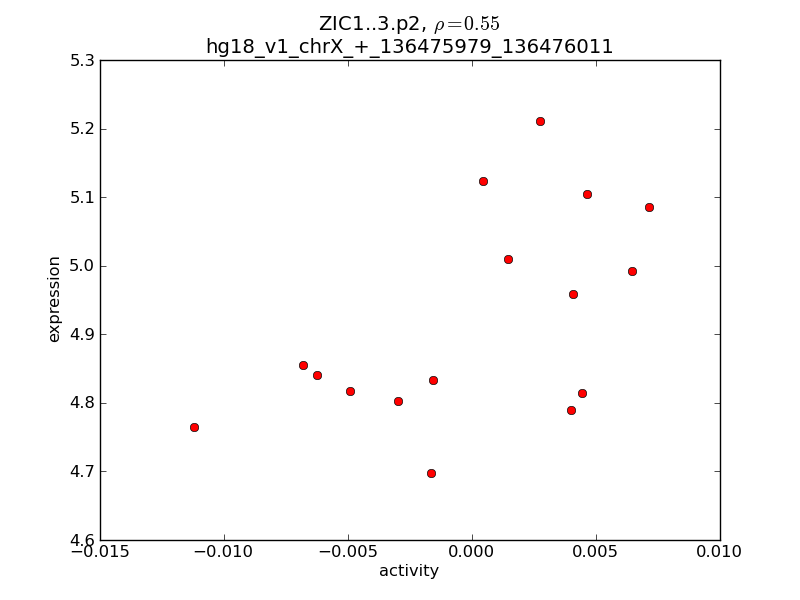
chr3_+_148610516
|
0.377
|
|
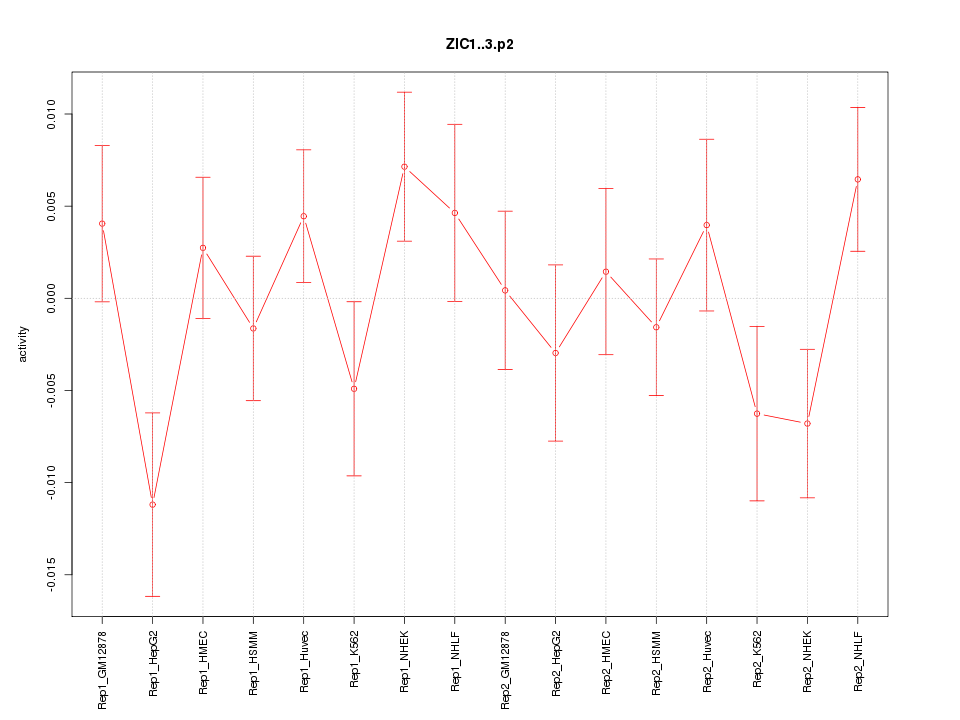
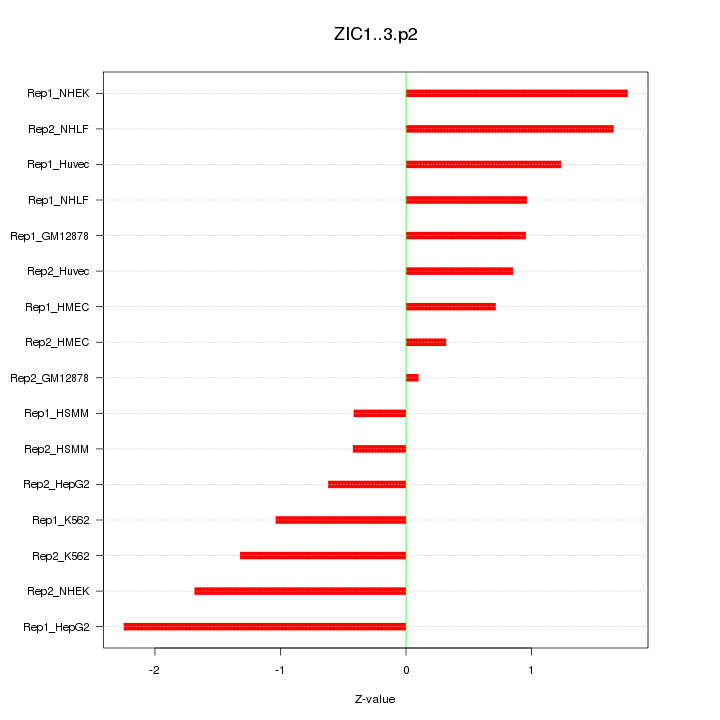
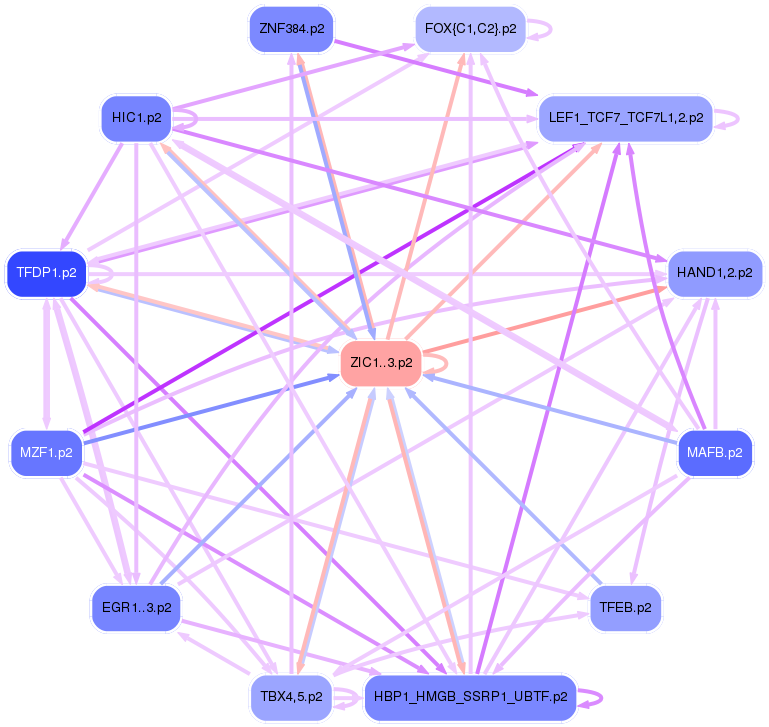
ZIC1
|
Zic family member 1 (odd-paired homolog, Drosophila)
|
|
chr3_+_142979639
|
0.377
|
NM_139209
|
GRK7
|
G protein-coupled receptor kinase 7
|
|
chr3_+_49566901
|
0.375
|
NM_003458
|
BSN
|
bassoon (presynaptic cytomatrix protein)
|
|
chrX_-_24941098
|
0.374
|
|
ARX
|
aristaless related homeobox
|
|
chr22_+_35290271
|
0.373
|
|
|
|
|
chr13_-_94162249
|
0.372
|
NM_007084
|
SOX21
|
SRY (sex determining region Y)-box 21
|
|
chr11_-_289518
|
0.371
|
NM_001025295
|
IFITM5
|
interferon induced transmembrane protein 5
|
|
chr6_-_107542328
|
0.371
|
NM_001080450
|
BEND3
|
BEN domain containing 3
|
|
chr19_-_19599973
|
0.366
|
NM_004720
|
LPAR2
|
lysophosphatidic acid receptor 2
|
|
chrX_+_90576252
|
0.365
|
NM_080832
|
PABPC5
|
poly(A) binding protein, cytoplasmic 5
|
|
chr3_-_107070400
|
0.362
|
NM_170662
|
CBLB
|
Cas-Br-M (murine) ecotropic retroviral transforming sequence b
|
|
chr1_-_114156429
|
0.362
|
NM_018364
|
RSBN1
|
round spermatid basic protein 1
|
|
chr19_-_5291700
|
0.361
|
NM_002850
NM_130853
NM_130854
NM_130855
|
PTPRS
|
protein tyrosine phosphatase, receptor type, S
|
|
chr17_-_59923547
|
0.359
|
NM_007215
|
POLG2
|
polymerase (DNA directed), gamma 2, accessory subunit
|
|
chr17_+_58058783
|
0.358
|
|
MRC2
|
mannose receptor, C type 2
|
|
chr3_-_130807865
|
0.356
|
NM_015103
|
PLXND1
|
plexin D1
|
|
chr16_-_34262262
|
0.355
|
|
UBE2MP1
|
ubiquitin-conjugating enzyme E2M pseudogene 1
|
|
chr14_+_64077171
|
0.353
|
|
HSPA2
|
heat shock 70kDa protein 2
|
|
chr17_+_6867138
|
0.352
|
|
BCL6B
|
B-cell CLL/lymphoma 6, member B
|
|
chr17_+_7264366
|
0.352
|
NM_199339
|
SPEM1
|
spermatid maturation 1
|
|
chr12_+_6745947
|
0.351
|
|
PTMS
|
parathymosin
|
|
chr17_+_6867090
|
0.350
|
NM_181844
|
BCL6B
|
B-cell CLL/lymphoma 6, member B
|
|
chr12_-_4425040
|
0.350
|
NM_020996
|
FGF6
|
fibroblast growth factor 6
|
|
chrX_-_70248022
|
0.348
|
NM_000206
|
IL2RG
|
interleukin 2 receptor, gamma
|
|
chr13_+_110565587
|
0.348
|
NM_001113511
NM_001113512
NM_145735
|
ARHGEF7
|
Rho guanine nucleotide exchange factor (GEF) 7
|
|
chr2_+_130846263
|
0.346
|
|
PTPN18
|
protein tyrosine phosphatase, non-receptor type 18 (brain-derived)
|
|
chr4_-_149582754
|
0.345
|
|
NR3C2
|
nuclear receptor subfamily 3, group C, member 2
|
|
chr2_+_159533329
|
0.344
|
NM_001145909
NM_033394
|
TANC1
|
tetratricopeptide repeat, ankyrin repeat and coiled-coil containing 1
|
|
chrX_-_134013644
|
0.344
|
NM_001078172
NM_001134321
|
FAM127B
|
family with sequence similarity 127, member B
|
|
chr19_-_51097694
|
0.343
|
NM_001012643
|
MYPOP
|
Myb-related transcription factor, partner of profilin
|
|
chr14_+_104261578
|
0.342
|
NM_152328
|
ADSSL1
|
adenylosuccinate synthase like 1
|
|
chr1_+_154351200
|
0.339
|
|
LMNA
|
lamin A/C
|
|
chr20_+_61622985
|
0.337
|
|
PPDPF
|
pancreatic progenitor cell differentiation and proliferation factor homolog (zebrafish)
|
|
chr11_-_61415429
|
0.337
|
NM_021727
|
FADS3
|
fatty acid desaturase 3
|
|
chr11_+_2355119
|
0.335
|
NM_004356
|
CD81
|
CD81 molecule
|
|
chr11_-_3035172
|
0.334
|
NM_001014437
NM_001194997
NM_001751
NM_139273
|
CARS
|
cysteinyl-tRNA synthetase
|
|
chrX_+_151991474
|
0.333
|
NM_001170944
NM_032882
|
LOC100287428
PNMA6A
|
paraneoplastic antigen-like protein 6A related gene
paraneoplastic antigen like 6A
|
|
chr16_+_1979959
|
0.332
|
NM_004209
|
SYNGR3
|
synaptogyrin 3
|
|
chr16_-_265868
|
0.330
|
NM_003834
NM_183337
|
RGS11
|
regulator of G-protein signaling 11
|
|
chr10_-_126706442
|
0.329
|
NM_022802
|
CTBP2
|
C-terminal binding protein 2
|
|
chr12_+_109536214
|
0.328
|
NM_001082537
NM_001082538
NM_001173976
NM_024549
NM_001173975
|
TCTN1
|
tectonic family member 1
|
|
chr12_+_52653176
|
0.327
|
NM_014212
|
HOXC11
|
homeobox C11
|
|
chrX_-_8729377
|
0.327
|
NM_001171186
NM_174951
|
FAM9A
|
family with sequence similarity 9, member A
|
|
chrX_+_101853912
|
0.324
|
NM_001004051
NM_001184874
NM_001184875
NM_001184876
NM_138437
|
GPRASP2
|
G protein-coupled receptor associated sorting protein 2
|
|
chr17_-_8020332
|
0.322
|
NM_032354
NM_183065
|
TMEM107
|
transmembrane protein 107
|
|
chr3_+_185377430
|
0.321
|
|
AP2M1
|
adaptor-related protein complex 2, mu 1 subunit
|
|
chr15_-_41669690
|
0.318
|
NM_001130858
NM_001130859
NM_001190214
|
PPIP5K1
|
diphosphoinositol pentakisphosphate kinase 1
|
|
chrX_-_111970662
|
0.317
|
NM_133265
|
AMOT
|
angiomotin
|
|
chr21_+_41461962
|
0.314
|
|
BACE2
|
beta-site APP-cleaving enzyme 2
|
|
chrX_-_114374860
|
0.314
|
NM_020871
|
LRCH2
|
leucine-rich repeats and calponin homology (CH) domain containing 2
|
|
chr7_+_119700924
|
0.313
|
NM_012281
|
KCND2
|
potassium voltage-gated channel, Shal-related subfamily, member 2
|
|
chr14_+_64076916
|
0.311
|
NM_021979
|
HSPA2
|
heat shock 70kDa protein 2
|
|
chr20_+_36786540
|
0.310
|
|
SLC32A1
|
solute carrier family 32 (GABA vesicular transporter), member 1
|
|
chr17_+_7549138
|
0.309
|
NM_001406
|
EFNB3
|
ephrin-B3
|
|
chrX_-_52700674
|
0.309
|
NM_173358
|
SSX7
|
synovial sarcoma, X breakpoint 7
|
|
chr16_+_30583278
|
0.307
|
NM_001105079
|
FBRS
|
fibrosin
|
|
chr11_+_122936145
|
0.306
|
|
GRAMD1B
|
GRAM domain containing 1B
|
|
chr8_-_134653194
|
0.306
|
NM_003033
NM_173344
|
ST3GAL1
|
ST3 beta-galactoside alpha-2,3-sialyltransferase 1
|
|
chrX_-_119329307
|
0.305
|
|
FAM70A
|
family with sequence similarity 70, member A
|
|
chr9_-_94566823
|
0.303
|
NM_001003800
NM_015250
|
BICD2
|
bicaudal D homolog 2 (Drosophila)
|
|
chr1_+_32251988
|
0.303
|
NM_006559
|
KHDRBS1
|
KH domain containing, RNA binding, signal transduction associated 1
|
|
chr17_+_7776197
|
0.303
|
NM_001037144
NM_053051
|
CNTROB
|
centrobin, centrosomal BRCA2 interacting protein
|
|
chr14_+_102662416
|
0.303
|
NM_006291
|
TNFAIP2
|
tumor necrosis factor, alpha-induced protein 2
|
|
chr22_+_40107878
|
0.302
|
NM_003216
|
TEF
|
thyrotrophic embryonic factor
|
|
chr12_+_11694172
|
0.302
|
|
ETV6
|
ets variant 6
|
|
chr19_+_60487345
|
0.301
|
NM_032430
|
BRSK1
|
BR serine/threonine kinase 1
|
|
chrX_+_48127911
|
0.300
|
NM_001034832
NM_001040612
NM_005636
NM_175729
|
SSX4B
SSX4
|
synovial sarcoma, X breakpoint 4B
synovial sarcoma, X breakpoint 4
|
|
chr14_-_60260211
|
0.298
|
NM_017420
|
SIX4
|
SIX homeobox 4
|
|
chr19_-_48976852
|
0.298
|
|
KCNN4
|
potassium intermediate/small conductance calcium-activated channel, subfamily N, member 4
|
|
chr11_-_106394039
|
0.298
|
NM_000855
|
GUCY1A2
|
guanylate cyclase 1, soluble, alpha 2
|
|
chr12_-_6668680
|
0.298
|
|
ZNF384
|
zinc finger protein 384
|
|
chr22_+_38090120
|
0.296
|
NM_145738
|
SYNGR1
|
synaptogyrin 1
|
|
chr19_+_12709281
|
0.295
|
NM_004317
|
ASNA1
|
arsA arsenite transporter, ATP-binding, homolog 1 (bacterial)
|
|
chr1_+_154351162
|
0.295
|
|
LMNA
|
lamin A/C
|
|
chr19_-_48998365
|
0.294
|
NM_001031749
|
LYPD5
|
LY6/PLAUR domain containing 5
|
|
chr1_+_143304983
|
0.293
|
|
NBPF10
NBPF1
|
neuroblastoma breakpoint family, member 10
neuroblastoma breakpoint family, member 1
|
|
chr11_-_31796061
|
0.292
|
NM_001127612
|
PAX6
|
paired box 6
|
|
chr19_+_19510056
|
0.292
|
NM_153221
|
CILP2
|
cartilage intermediate layer protein 2
|
|
chrX_-_20044670
|
0.291
|
NM_001168467
|
MAP7D2
|
MAP7 domain containing 2
|
|
chr22_-_29231597
|
0.291
|
NM_001161368
NM_174977
|
SEC14L4
|
SEC14-like 4 (S. cerevisiae)
|
|
chr15_-_39195701
|
0.291
|
|
INO80
|
INO80 homolog (S. cerevisiae)
|
|
chr19_-_12858956
|
0.290
|
NM_006563
|
KLF1
|
Kruppel-like factor 1 (erythroid)
|
|
chr19_+_19510098
|
0.289
|
|
CILP2
|
cartilage intermediate layer protein 2
|
|
chr11_+_122936246
|
0.289
|
|
GRAMD1B
|
GRAM domain containing 1B
|
|
chrX_+_72140076
|
0.288
|
NM_001042506
|
PABPC1L2B
|
poly(A) binding protein, cytoplasmic 1-like 2B
|
|
chr20_+_36786518
|
0.288
|
NM_080552
|
SLC32A1
|
solute carrier family 32 (GABA vesicular transporter), member 1
|
|
chr1_-_29321599
|
0.288
|
NM_001171868
|
TMEM200B
|
transmembrane protein 200B
|
|
chr15_+_72209039
|
0.287
|
NM_001130137
|
ISLR2
|
immunoglobulin superfamily containing leucine-rich repeat 2
|
|
chr19_+_40795456
|
0.287
|
NM_015302
|
HAUS5
|
HAUS augmin-like complex, subunit 5
|
|
chr3_+_185377341
|
0.286
|
|
AP2M1
|
adaptor-related protein complex 2, mu 1 subunit
|
|
chr17_-_30838870
|
0.285
|
NM_001195790
|
SLFN12L
|
schlafen family member 12-like
|
|
chr19_+_2200112
|
0.285
|
NM_000479
|
AMH
|
anti-Mullerian hormone
|
|
chr12_-_53071285
|
0.283
|
NM_001130967
NM_001130968
|
ZNF385A
|
zinc finger protein 385A
|
