|
chr11_-_31782169
|
1.199
|
|
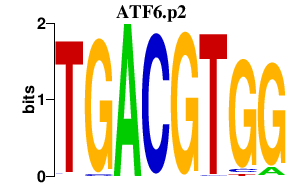
PAX6
|
paired box 6
|
|
chrX_+_101267315
|
1.132
|
NM_080390
|
TCEAL2
|
transcription elongation factor A (SII)-like 2
|
|
chr2_-_27384617
|
1.080
|
NM_003353
|
UCN
|
urocortin
|
|
chr11_+_65945050
|
1.071
|
NM_178864
|
NPAS4
|
neuronal PAS domain protein 4
|
|
chr17_+_56884560
|
0.926
|
|
TBX4
|
T-box 4
|
|
chr3_-_24511180
|
0.922
|
NM_001128176
NM_000461
NM_001128177
|
THRB
|
thyroid hormone receptor, beta (erythroblastic leukemia viral (v-erb-a) oncogene homolog 2, avian)
|
|
chrX_-_139414890
|
0.850
|
NM_005634
|
SOX3
|
SRY (sex determining region Y)-box 3
|
|
chr4_-_111763356
|
0.849
|
|
PITX2
|
paired-like homeodomain 2
|
|
chr10_+_50488352
|
0.844
|
NM_003055
|
SLC18A3
|
solute carrier family 18 (vesicular acetylcholine), member 3
|
|
chr1_-_50661716
|
0.842
|
NM_032110
|
DMRTA2
|
DMRT-like family A2
|
|
chr7_-_72822471
|
0.770
|
NM_001306
|
CLDN3
|
claudin 3
|
|
chr1_-_110414756
|
0.758
|
NM_006492
|
ALX3
|
ALX homeobox 3
|
|
chr2_+_220116986
|
0.734
|
NM_001005209
|
TMEM198
|
transmembrane protein 198
|
|
chr11_-_31796061
|
0.734
|
NM_001127612
|
PAX6
|
paired box 6
|
|
chr2_+_220117009
|
0.732
|
|
TMEM198
|
transmembrane protein 198
|
|
chr3_-_24511456
|
0.713
|
|
THRB
|
thyroid hormone receptor, beta (erythroblastic leukemia viral (v-erb-a) oncogene homolog 2, avian)
|
|
chr17_-_72045218
|
0.706
|
NM_134268
|
CYGB
|
cytoglobin
|
|
chr7_-_35260213
|
0.701
|
NM_001077653
NM_001166220
|
TBX20
|
T-box 20
|
|
chr22_-_42589543
|
0.694
|
NM_014351
|
SULT4A1
|
sulfotransferase family 4A, member 1
|
|
chr4_-_111763655
|
0.690
|
NM_000325
|
PITX2
|
paired-like homeodomain 2
|
|
chr19_-_51608665
|
0.684
|
NM_032040
|
CCDC8
|
coiled-coil domain containing 8
|
|
chr7_-_19123765
|
0.673
|
|
TWIST1
|
twist homolog 1 (Drosophila)
|
|
chr14_+_100362204
|
0.653
|
|
MEG3
|
maternally expressed 3 (non-protein coding)
|
|
chr11_-_118740069
|
0.640
|
NM_171997
|
USP2
|
ubiquitin specific peptidase 2
|
|
chr7_-_19123787
|
0.638
|
NM_000474
|
TWIST1
|
twist homolog 1 (Drosophila)
|
|
chr8_-_22606653
|
0.636
|
NM_004430
|
EGR3
|
early growth response 3
|
|
chr11_-_75599433
|
0.635
|
|
WNT11
|
wingless-type MMTV integration site family, member 11
|
|
chr10_-_131652364
|
0.632
|
|
EBF3
|
early B-cell factor 3
|
|
chr11_+_108798047
|
0.617
|
NM_207645
|
C11orf87
|
chromosome 11 open reading frame 87
|
|
chr5_-_176760242
|
0.612
|
NM_001029886
|
PFN3
|
profilin 3
|
|
chr2_-_172675480
|
0.611
|
NM_004405
|
DLX2
|
distal-less homeobox 2
|
|
chr10_+_22674379
|
0.605
|
NM_012443
NM_172242
|
SPAG6
|
sperm associated antigen 6
|
|
chr11_-_118739838
|
0.603
|
|
USP2
|
ubiquitin specific peptidase 2
|
|
chr18_+_13208777
|
0.594
|
NM_181481
NM_181482
|
C18orf1
|
chromosome 18 open reading frame 1
|
|
chr10_+_94823636
|
0.589
|
NM_000783
|
CYP26A1
|
cytochrome P450, family 26, subfamily A, polypeptide 1
|
|
chr19_+_18584666
|
0.588
|
NM_012109
|
TMEM59L
|
transmembrane protein 59-like
|
|
chr12_+_52665196
|
0.587
|
NM_017409
|
HOXC10
|
homeobox C10
|
|
chr1_-_233879617
|
0.581
|
NM_001098722
|
GNG4
|
guanine nucleotide binding protein (G protein), gamma 4
|
|
chr1_-_181654027
|
0.579
|
|
|
|
|
chr12_+_48641545
|
0.560
|
NM_001651
|
AQP5
|
aquaporin 5
|
|
chr10_-_118022965
|
0.555
|
NM_005264
|
GFRA1
|
GDNF family receptor alpha 1
|
|
chr17_-_13445942
|
0.554
|
NM_006042
|
HS3ST3A1
|
heparan sulfate (glucosamine) 3-O-sulfotransferase 3A1
|
|
chr2_-_192767494
|
0.551
|
|
TMEFF2
|
transmembrane protein with EGF-like and two follistatin-like domains 2
|
|
chr8_+_54015020
|
0.551
|
NM_005285
|
NPBWR1
|
neuropeptides B/W receptor 1
|
|
chr14_+_102458745
|
0.537
|
NM_030943
|
AMN
|
amnionless homolog (mouse)
|
|
chr19_+_10261646
|
0.530
|
NM_003259
|
ICAM5
|
intercellular adhesion molecule 5, telencephalin
|
|
chr14_-_94306104
|
0.516
|
NM_173849
|
GSC
|
goosecoid homeobox
|
|
chrX_+_117992603
|
0.514
|
|
LONRF3
|
LON peptidase N-terminal domain and ring finger 3
|
|
chr3_+_148609841
|
0.508
|
NM_003412
|
ZIC1
|
Zic family member 1 (odd-paired homolog, Drosophila)
|
|
chr14_+_100362236
|
0.504
|
|
MEG3
|
maternally expressed 3 (non-protein coding)
|
|
chr7_-_37923040
|
0.500
|
NM_003014
|
SFRP4
|
secreted frizzled-related protein 4
|
|
chr20_-_4177519
|
0.488
|
NM_000678
|
ADRA1D
|
adrenergic, alpha-1D-, receptor
|
|
chr12_+_52680143
|
0.488
|
NM_006897
|
HOXC9
|
homeobox C9
|
|
chr7_+_154943466
|
0.486
|
NM_001427
|
EN2
|
engrailed homeobox 2
|
|
chr7_-_37922902
|
0.486
|
|
SFRP4
|
secreted frizzled-related protein 4
|
|
chr5_+_80292313
|
0.482
|
NM_006909
|
RASGRF2
|
Ras protein-specific guanine nucleotide-releasing factor 2
|
|
chr6_+_101953581
|
0.480
|
NM_001166247
NM_021956
NM_175768
|
GRIK2
|
glutamate receptor, ionotropic, kainate 2
|
|
chr2_-_182253457
|
0.473
|
NM_002500
|
NEUROD1
|
neurogenic differentiation 1
|
|
chr1_-_114497994
|
0.472
|
NM_205848
|
SYT6
|
synaptotagmin VI
|
|
chr2_-_172675873
|
0.470
|
|
DLX2
|
distal-less homeobox 2
|
|
chr11_+_68208583
|
0.469
|
|
GAL
|
galanin prepropeptide
|
|
chr11_+_68208554
|
0.469
|
NM_015973
|
GAL
|
galanin prepropeptide
|
|
chr5_-_37875538
|
0.465
|
NM_000514
|
GDNF
|
glial cell derived neurotrophic factor
|
|
chrX_+_152565849
|
0.465
|
|
DUSP9
|
dual specificity phosphatase 9
|
|
chr10_-_62373828
|
0.456
|
NM_014836
|
RHOBTB1
|
Rho-related BTB domain containing 1
|
|
chr5_+_80292213
|
0.452
|
|
RASGRF2
|
Ras protein-specific guanine nucleotide-releasing factor 2
|
|
chr2_+_26249463
|
0.450
|
NM_001168241
|
FAM59B
|
family with sequence similarity 59, member B
|
|
chr11_+_108798084
|
0.450
|
|
C11orf87
|
chromosome 11 open reading frame 87
|
|
chr11_+_65311142
|
0.448
|
|
OVOL1
|
ovo-like 1(Drosophila)
|
|
chr2_-_96899396
|
0.443
|
NM_017789
|
SEMA4C
|
sema domain, immunoglobulin domain (Ig), transmembrane domain (TM) and short cytoplasmic domain, (semaphorin) 4C
|
|
chr8_-_24869945
|
0.442
|
NM_006158
|
NEFL
|
neurofilament, light polypeptide
|
|
chr10_+_24023680
|
0.440
|
NM_001098500
|
KIAA1217
|
KIAA1217
|
|
chr17_-_32368033
|
0.437
|
|
|
|
|
chr5_-_95794416
|
0.437
|
NM_000439
|
PCSK1
|
proprotein convertase subtilisin/kexin type 1
|
|
chr7_-_100595552
|
0.435
|
NM_003378
|
VGF
|
VGF nerve growth factor inducible
|
|
chr11_+_65311104
|
0.428
|
NM_004561
|
OVOL1
|
ovo-like 1(Drosophila)
|
|
chr15_+_39739864
|
0.427
|
NM_001080541
NM_001164273
|
MGA
|
MAX gene associated
|
|
chr10_-_7491204
|
0.427
|
NM_001018039
|
SFMBT2
|
Scm-like with four mbt domains 2
|
|
chr3_+_32834513
|
0.425
|
NM_001039111
|
TRIM71
|
tripartite motif containing 71
|
|
chr12_+_4788602
|
0.421
|
NM_002235
|
KCNA6
|
potassium voltage-gated channel, shaker-related subfamily, member 6
|
|
chr15_+_39739933
|
0.420
|
|
MGA
|
MAX gene associated
|
|
chr16_-_52877868
|
0.419
|
NM_024336
|
IRX3
|
iroquois homeobox 3
|
|
chr6_+_101953389
|
0.417
|
|
GRIK2
|
glutamate receptor, ionotropic, kainate 2
|
|
chr6_-_84475424
|
0.413
|
|
SNAP91
|
synaptosomal-associated protein, 91kDa homolog (mouse)
|
|
chr19_-_17660005
|
0.412
|
NM_001080421
|
UNC13A
|
unc-13 homolog A (C. elegans)
|
|
chrX_-_18282698
|
0.410
|
NM_006089
|
SCML2
|
sex comb on midleg-like 2 (Drosophila)
|
|
chr6_+_1336077
|
0.408
|
|
|
|
|
chrX_+_21302317
|
0.401
|
NM_001168647
NM_001168648
NM_001168649
NM_014927
|
CNKSR2
|
connector enhancer of kinase suppressor of Ras 2
|
|
chr1_-_181654124
|
0.401
|
NM_015039
|
NMNAT2
|
nicotinamide nucleotide adenylyltransferase 2
|
|
chr10_-_64246129
|
0.397
|
NM_000399
NM_001136177
NM_001136179
|
EGR2
|
early growth response 2
|
|
chr10_-_88116181
|
0.396
|
NM_017551
|
GRID1
|
glutamate receptor, ionotropic, delta 1
|
|
chrX_+_117992623
|
0.396
|
NM_001031855
NM_024778
|
LONRF3
|
LON peptidase N-terminal domain and ring finger 3
|
|
chr11_+_125279481
|
0.392
|
NM_013264
|
DDX25
|
DEAD (Asp-Glu-Ala-Asp) box polypeptide 25
|
|
chr1_-_37272295
|
0.388
|
NM_000831
|
GRIK3
|
glutamate receptor, ionotropic, kainate 3
|
|
chrX_-_138114817
|
0.388
|
|
FGF13
|
fibroblast growth factor 13
|
|
chr16_-_65742323
|
0.387
|
NM_033309
|
B3GNT9
|
UDP-GlcNAc:betaGal beta-1,3-N-acetylglucosaminyltransferase 9
|
|
chr20_+_21634515
|
0.385
|
|
PAX1
|
paired box 1
|
|
chr16_-_52877829
|
0.383
|
|
IRX3
|
iroquois homeobox 3
|
|
chr22_+_37193961
|
0.378
|
NM_006855
NM_016657
|
KDELR3
|
KDEL (Lys-Asp-Glu-Leu) endoplasmic reticulum protein retention receptor 3
|
|
chr12_-_112394259
|
0.374
|
NM_022363
|
LHX5
|
LIM homeobox 5
|
|
chr1_+_110494654
|
0.367
|
NM_001010898
|
SLC6A17
|
solute carrier family 6, member 17
|
|
chr9_+_86474500
|
0.360
|
|
NTRK2
|
neurotrophic tyrosine kinase, receptor, type 2
|
|
chr12_+_52634950
|
0.360
|
NM_173860
|
HOXC12
|
homeobox C12
|
|
chr13_+_24940965
|
0.357
|
|
ATP8A2
|
ATPase, aminophospholipid transporter, class I, type 8A, member 2
|
|
chr7_-_98305599
|
0.353
|
NM_001134450
NM_001134451
NM_152913
|
TMEM130
|
transmembrane protein 130
|
|
chr12_+_70120028
|
0.353
|
NM_003667
|
LGR5
|
leucine-rich repeat containing G protein-coupled receptor 5
|
|
chr2_-_192767844
|
0.353
|
NM_016192
|
TMEFF2
|
transmembrane protein with EGF-like and two follistatin-like domains 2
|
|
chr1_+_4614528
|
0.348
|
|
AJAP1
|
adherens junctions associated protein 1
|
|
chr2_+_176680251
|
0.348
|
NM_021192
|
HOXD11
|
homeobox D11
|
|
chr19_-_62912347
|
0.346
|
NM_001085384
|
ZNF154
|
zinc finger protein 154
|
|
chr7_-_98305551
|
0.345
|
|
TMEM130
|
transmembrane protein 130
|
|
chr9_+_86474457
|
0.342
|
|
NTRK2
|
neurotrophic tyrosine kinase, receptor, type 2
|
|
chr19_-_52710129
|
0.337
|
NM_003827
|
NAPA
|
N-ethylmaleimide-sensitive factor attachment protein, alpha
|
|
chr1_+_63561632
|
0.337
|
|
FOXD3
|
forkhead box D3
|
|
chr17_-_77824849
|
0.335
|
NM_001893
NM_139062
|
CSNK1D
|
casein kinase 1, delta
|
|
chr9_+_86474553
|
0.335
|
|
NTRK2
|
neurotrophic tyrosine kinase, receptor, type 2
|
|
chr17_-_7138590
|
0.333
|
NM_015982
|
YBX2
|
Y box binding protein 2
|
|
chr4_+_166519392
|
0.332
|
NM_001873
|
CPE
|
carboxypeptidase E
|
|
chr19_+_10388448
|
0.332
|
|
PDE4A
|
phosphodiesterase 4A, cAMP-specific
|
|
chr1_+_155097230
|
0.332
|
NM_001012331
NM_002529
|
NTRK1
|
neurotrophic tyrosine kinase, receptor, type 1
|
|
chr13_+_24940917
|
0.331
|
|
ATP8A2
|
ATPase, aminophospholipid transporter, class I, type 8A, member 2
|
|
chr22_-_45037882
|
0.331
|
NM_006071
|
PKDREJ
|
polycystic kidney disease (polycystin) and REJ homolog (sperm receptor for egg jelly homolog, sea urchin)
|
|
chrX_-_101297417
|
0.329
|
NM_001159560
NM_001012978
|
BEX5
|
brain expressed, X-linked 5
|
|
chr1_+_41022066
|
0.329
|
NM_004700
NM_172163
|
KCNQ4
|
potassium voltage-gated channel, KQT-like subfamily, member 4
|
|
chr15_-_77169894
|
0.327
|
|
RASGRF1
|
Ras protein-specific guanine nucleotide-releasing factor 1
|
|
chr16_-_27982277
|
0.323
|
NM_001109763
|
GSG1L
|
GSG1-like
|
|
chr6_-_137857213
|
0.323
|
NM_175747
|
OLIG3
|
oligodendrocyte transcription factor 3
|
|
chr12_+_117903682
|
0.322
|
NM_194286
|
SRRM4
|
serine/arginine repetitive matrix 4
|
|
chr8_+_120289735
|
0.322
|
NM_052886
|
MAL2
|
mal, T-cell differentiation protein 2 (gene/pseudogene)
|
|
chr17_-_7138535
|
0.321
|
|
YBX2
|
Y box binding protein 2
|
|
chr10_-_128067062
|
0.319
|
NM_003474
NM_021641
|
ADAM12
|
ADAM metallopeptidase domain 12
|
|
chr3_-_73756668
|
0.318
|
NM_015009
|
PDZRN3
|
PDZ domain containing ring finger 3
|
|
chr10_-_120830301
|
0.317
|
NM_003750
|
EIF3A
|
eukaryotic translation initiation factor 3, subunit A
|
|
chr19_+_54558798
|
0.317
|
NM_001197302
NM_001197301
NM_014419
|
DKKL1
|
dickkopf-like 1
|
|
chr15_-_66511488
|
0.315
|
NM_001004439
|
ITGA11
|
integrin, alpha 11
|
|
chr16_-_3008162
|
0.313
|
NM_021195
|
CLDN6
|
claudin 6
|
|
chr19_+_55398680
|
0.313
|
NM_001077186
NM_001145809
NM_024729
|
MYH14
|
myosin, heavy chain 14, non-muscle
|
|
chr7_+_5598964
|
0.311
|
|
FSCN1
|
fascin homolog 1, actin-bundling protein (Strongylocentrotus purpuratus)
|
|
chr17_-_7138620
|
0.309
|
|
YBX2
|
Y box binding protein 2
|
|
chr2_-_27195276
|
0.309
|
NM_001166239
|
CGREF1
|
cell growth regulator with EF-hand domain 1
|
|
chr9_+_86474393
|
0.309
|
NM_001018065
NM_001018066
|
NTRK2
|
neurotrophic tyrosine kinase, receptor, type 2
|
|
chr10_-_120830286
|
0.304
|
|
EIF3A
|
eukaryotic translation initiation factor 3, subunit A
|
|
chr5_-_131591380
|
0.302
|
NM_001017974
NM_001142598
NM_001142599
|
P4HA2
|
prolyl 4-hydroxylase, alpha polypeptide II
|
|
chr6_-_119441045
|
0.301
|
|
FAM184A
|
family with sequence similarity 184, member A
|
|
chr10_-_64246080
|
0.300
|
|
EGR2
|
early growth response 2
|
|
chr5_+_170779264
|
0.299
|
NM_003862
|
FGF18
|
fibroblast growth factor 18
|
|
chr5_-_146238336
|
0.298
|
NM_004576
NM_181675
NM_001127381
|
PPP2R2B
|
protein phosphatase 2, regulatory subunit B, beta
|
|
chr13_-_94162249
|
0.297
|
NM_007084
|
SOX21
|
SRY (sex determining region Y)-box 21
|
|
chr11_-_57173823
|
0.297
|
NM_145008
|
YPEL4
|
yippee-like 4 (Drosophila)
|
|
chr1_+_29435534
|
0.291
|
NM_001195001
NM_005704
NM_133177
NM_133178
|
PTPRU
|
protein tyrosine phosphatase, receptor type, U
|
|
chr9_+_86474445
|
0.289
|
NM_001007097
|
NTRK2
|
neurotrophic tyrosine kinase, receptor, type 2
|
|
chr20_+_32610161
|
0.289
|
NM_032514
|
MAP1LC3A
|
microtubule-associated protein 1 light chain 3 alpha
|
|
chr14_+_71468902
|
0.286
|
|
RGS6
|
regulator of G-protein signaling 6
|
|
chr7_+_100041143
|
0.284
|
|
PCOLCE
|
procollagen C-endopeptidase enhancer
|
|
chr17_+_7151653
|
0.283
|
|
EIF5A
|
eukaryotic translation initiation factor 5A
|
|
chr2_-_27195401
|
0.279
|
NM_001166240
NM_006569
|
CGREF1
|
cell growth regulator with EF-hand domain 1
|
|
chr20_-_60484420
|
0.279
|
NM_080473
|
GATA5
|
GATA binding protein 5
|
|
chr19_-_52709975
|
0.279
|
|
NAPA
|
N-ethylmaleimide-sensitive factor attachment protein, alpha
|
|
chr19_+_54723044
|
0.278
|
|
RCN3
|
reticulocalbin 3, EF-hand calcium binding domain
|
|
chr14_+_67156386
|
0.277
|
|
ARG2
|
arginase, type II
|
|
chr3_+_185580554
|
0.274
|
NM_003741
|
CHRD
|
chordin
|
|
chr17_-_44058612
|
0.273
|
NM_024017
|
HOXB9
|
homeobox B9
|
|
chr9_-_78710698
|
0.271
|
NM_015225
|
PRUNE2
|
prune homolog 2 (Drosophila)
|
|
chr19_+_5632016
|
0.269
|
NM_198704
NM_198705
NM_198533
NM_198707
NM_198706
NM_198708
|
HSD11B1L
|
hydroxysteroid (11-beta) dehydrogenase 1-like
|
|
chr11_-_59139755
|
0.268
|
|
OSBP
|
oxysterol binding protein
|
|
chr14_+_67156405
|
0.268
|
|
ARG2
|
arginase, type II
|
|
chr19_+_54149963
|
0.267
|
|
BAX
|
BCL2-associated X protein
|
|
chr7_-_98305419
|
0.267
|
|
TMEM130
|
transmembrane protein 130
|
|
chr6_-_33494042
|
0.267
|
NM_001014433
NM_001014837
NM_001014838
NM_001014840
NM_015921
|
CUTA
|
cutA divalent cation tolerance homolog (E. coli)
|
|
chr19_+_10673105
|
0.266
|
NM_031209
|
QTRT1
|
queuine tRNA-ribosyltransferase 1
|
|
chr9_-_98421894
|
0.265
|
NM_003671
NM_033331
|
CDC14B
|
CDC14 cell division cycle 14 homolog B (S. cerevisiae)
|
|
chr10_-_128067052
|
0.263
|
|
ADAM12
|
ADAM metallopeptidase domain 12
|
|
chr19_-_52710089
|
0.261
|
|
NAPA
|
N-ethylmaleimide-sensitive factor attachment protein, alpha
|
|
chr20_+_21634293
|
0.260
|
NM_006192
|
PAX1
|
paired box 1
|
|
chr17_-_37828643
|
0.260
|
NM_012232
|
PTRF
|
polymerase I and transcript release factor
|
|
chr5_-_1935764
|
0.259
|
NM_016358
|
IRX4
|
iroquois homeobox 4
|
|
chr13_-_35818603
|
0.259
|
NM_001142296
NM_015087
|
SPG20
|
spastic paraplegia 20 (Troyer syndrome)
|
|
chr12_+_6768960
|
0.259
|
|
CD4
|
CD4 molecule
|
|
chr1_+_26368969
|
0.255
|
NM_015871
|
ZNF593
|
zinc finger protein 593
|
|
chr12_-_112058403
|
0.253
|
NM_001193520
NM_004658
|
RASAL1
|
RAS protein activator like 1 (GAP1 like)
|
|
chr12_+_110935612
|
0.252
|
|
|
|
|
chrX_-_13866565
|
0.251
|
NM_001001994
|
GPM6B
|
glycoprotein M6B
|
|
chr22_-_29833484
|
0.251
|
NM_080430
|
SELM
|
selenoprotein M
|
|
chr4_-_164473107
|
0.250
|
NM_000909
|
NPY1R
|
neuropeptide Y receptor Y1
|
|
chr19_+_54149941
|
0.250
|
|
BAX
|
BCL2-associated X protein
|
|
chr12_-_131415854
|
0.249
|
NM_001122636
|
GALNT9
|
UDP-N-acetyl-alpha-D-galactosamine:polypeptide N-acetylgalactosaminyltransferase 9 (GalNAc-T9)
|
|
chr9_-_103289154
|
0.249
|
NM_032342
|
C9orf125
|
chromosome 9 open reading frame 125
|
|
chr9_-_89779413
|
0.247
|
NM_001039803
NM_001170639
NM_001170640
NM_012119
NM_178432
|
CDK20
|
cyclin-dependent kinase 20
|
|
chr20_-_22512893
|
0.247
|
|
FOXA2
|
forkhead box A2
|
|
chr12_+_6768934
|
0.247
|
NM_001195014
NM_001195015
NM_001195016
NM_001195017
|
CD4
|
CD4 molecule
|
|
chr17_-_35017691
|
0.245
|
NM_006160
|
NEUROD2
|
neurogenic differentiation 2
|
|
chr4_-_44145580
|
0.244
|
NM_198353
|
KCTD8
|
potassium channel tetramerisation domain containing 8
|
|
chr14_+_92721048
|
0.243
|
NM_015676
NM_001098621
|
C14orf109
|
chromosome 14 open reading frame 109
|
|
chr1_+_109810622
|
0.241
|
NM_001040709
|
SYPL2
|
synaptophysin-like 2
|
|
chr17_-_35017650
|
0.240
|
|
NEUROD2
|
neurogenic differentiation 2
|
|
chr7_+_5598979
|
0.238
|
NM_003088
|
FSCN1
|
fascin homolog 1, actin-bundling protein (Strongylocentrotus purpuratus)
|
|
chr16_-_4528739
|
0.238
|
NM_001199055
NM_001199056
NM_013399
|
C16orf5
|
chromosome 16 open reading frame 5
|
|
chr10_-_128067001
|
0.237
|
|
ADAM12
|
ADAM metallopeptidase domain 12
|
|
chr19_+_55045754
|
0.236
|
|
PTOV1
|
prostate tumor overexpressed 1
|
|
chr9_+_123501186
|
0.236
|
|
DAB2IP
|
DAB2 interacting protein
|
