|
chr12_+_79625538
|
3.136
|
NM_002469
|
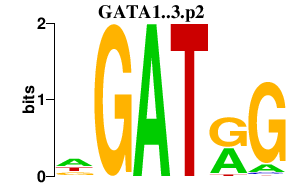
MYF6
|
myogenic factor 6 (herculin)
|
|
chr3_+_51964369
|
3.118
|
NM_080865
|
GPR62
|
G protein-coupled receptor 62
|
|
chrX_-_50403412
|
2.980
|
|
SHROOM4
|
shroom family member 4
|
|
chr5_+_170668892
|
2.846
|
NM_021025
|
TLX3
|
T-cell leukemia homeobox 3
|
|
chr5_-_63293301
|
2.742
|
NM_000524
|
HTR1A
|
5-hydroxytryptamine (serotonin) receptor 1A
|
|
chr12_+_93066370
|
2.677
|
NM_005761
|
PLXNC1
|
plexin C1
|
|
chr9_-_21207303
|
2.601
|
NM_002173
|
IFNA16
|
interferon, alpha 16
|
|
chr7_-_19778928
|
2.487
|
NM_152774
|
TMEM196
|
transmembrane protein 196
|
|
chr20_-_21326046
|
2.479
|
NM_033176
|
NKX2-4
|
NK2 homeobox 4
|
|
chr3_+_138966268
|
2.476
|
NM_004189
|
SOX14
|
SRY (sex determining region Y)-box 14
|
|
chr21_+_42946719
|
2.417
|
NM_001001567
NM_001001568
NM_001001569
NM_001001570
NM_001001571
NM_001001572
NM_001001573
NM_001001574
NM_001001575
NM_001001576
NM_001001577
NM_001001578
NM_001001579
NM_001001580
NM_001001581
NM_001001582
NM_001001583
NM_001001584
NM_001001585
NM_002606
|
PDE9A
|
phosphodiesterase 9A
|
|
chr4_+_134292630
|
2.414
|
|
PCDH10
|
protocadherin 10
|
|
chr1_+_229365296
|
2.372
|
NM_001004342
|
TRIM67
|
tripartite motif containing 67
|
|
chr14_-_23117614
|
2.339
|
|
JPH4
|
junctophilin 4
|
|
chr9_+_21399132
|
2.338
|
NM_002170
|
IFNA8
|
interferon, alpha 8
|
|
chr4_+_134293171
|
2.299
|
|
PCDH10
|
protocadherin 10
|
|
chr14_+_28306633
|
2.263
|
|
FOXG1
|
forkhead box G1
|
|
chr1_-_143075560
|
2.228
|
NM_178230
NM_001143883
NM_001135789
|
PPIAL4A
PPIAL4G
PPIAL4B
PPIAL4C
|
peptidylprolyl isomerase A (cyclophilin A)-like 4A
peptidylprolyl isomerase A (cyclophilin A)-like 4G
peptidylprolyl isomerase A (cyclophilin A)-like 4B
peptidylprolyl isomerase A (cyclophilin A)-like 4C
|
|
chr6_-_101018271
|
2.218
|
NM_005068
|
SIM1
|
single-minded homolog 1 (Drosophila)
|
|
chr11_-_31782169
|
2.118
|
|
PAX6
|
paired box 6
|
|
chr15_-_70385709
|
2.108
|
NM_001172685
|
CELF6
|
CUGBP, Elav-like family member 6
|
|
chr10_+_25504295
|
2.094
|
NM_020752
|
GPR158
|
G protein-coupled receptor 158
|
|
chr8_-_25958291
|
2.087
|
NM_022659
|
EBF2
|
early B-cell factor 2
|
|
chr12_+_79634820
|
2.075
|
NM_005593
|
MYF5
|
myogenic factor 5
|
|
chr7_+_94377145
|
2.038
|
NM_001166161
NM_001166162
NM_001166163
|
PPP1R9A
|
protein phosphatase 1, regulatory (inhibitor) subunit 9A
|
|
chr20_+_36786518
|
1.977
|
NM_080552
|
SLC32A1
|
solute carrier family 32 (GABA vesicular transporter), member 1
|
|
chr10_+_22674379
|
1.962
|
NM_012443
NM_172242
|
SPAG6
|
sperm associated antigen 6
|
|
chr1_-_75854281
|
1.873
|
|
SLC44A5
|
solute carrier family 44, member 5
|
|
chr3_-_173648896
|
1.823
|
NM_004122
NM_198407
|
GHSR
|
growth hormone secretagogue receptor
|
|
chr9_-_21177529
|
1.822
|
NM_021068
|
IFNA4
|
interferon, alpha 4
|
|
chr4_-_13155135
|
1.797
|
NM_001189
|
NKX3-2
|
NK3 homeobox 2
|
|
chr7_+_38984133
|
1.743
|
NM_001166018
NM_007252
|
POU6F2
|
POU class 6 homeobox 2
|
|
chr11_-_123918759
|
1.740
|
NM_001005195
|
OR8B12
|
olfactory receptor, family 8, subfamily B, member 12
|
|
chr21_-_30234100
|
1.737
|
NM_000830
NM_175611
|
GRIK1
|
glutamate receptor, ionotropic, kainate 1
|
|
chr4_-_111763356
|
1.710
|
|
PITX2
|
paired-like homeodomain 2
|
|
chr8_-_25958556
|
1.699
|
|
EBF2
|
early B-cell factor 2
|
|
chr6_-_132952517
|
1.697
|
NM_003967
|
TAAR5
|
trace amine associated receptor 5
|
|
chr3_-_144164867
|
1.690
|
NM_198504
|
PAQR9
|
progestin and adipoQ receptor family member IX
|
|
chr8_-_37943143
|
1.658
|
NM_000025
|
ADRB3
|
adrenergic, beta-3-, receptor
|
|
chr5_-_95794416
|
1.657
|
NM_000439
|
PCSK1
|
proprotein convertase subtilisin/kexin type 1
|
|
chrX_+_53095230
|
1.656
|
NM_018969
|
GPR173
|
G protein-coupled receptor 173
|
|
chr20_+_36786540
|
1.655
|
|
SLC32A1
|
solute carrier family 32 (GABA vesicular transporter), member 1
|
|
chr8_-_121893196
|
1.651
|
|
|
|
|
chr1_-_175400665
|
1.650
|
|
ASTN1
|
astrotactin 1
|
|
chr5_+_156752739
|
1.645
|
|
CYFIP2
|
cytoplasmic FMR1 interacting protein 2
|
|
chrX_-_44945025
|
1.622
|
NM_024689
NM_176819
|
CXorf36
|
chromosome X open reading frame 36
|
|
chr4_-_138673078
|
1.605
|
NM_019035
|
PCDH18
|
protocadherin 18
|
|
chr12_-_10853940
|
1.587
|
NM_023917
|
TAS2R9
|
taste receptor, type 2, member 9
|
|
chr1_-_142559339
|
1.558
|
NM_001123068
|
PPIAL4G
|
peptidylprolyl isomerase A (cyclophilin A)-like 4G
|
|
chr9_+_94987032
|
1.554
|
NM_006648
|
WNK2
|
WNK lysine deficient protein kinase 2
|
|
chr4_-_44145266
|
1.529
|
|
KCTD8
|
potassium channel tetramerisation domain containing 8
|
|
chr13_-_50315832
|
1.528
|
NM_198989
|
DLEU7
|
deleted in lymphocytic leukemia, 7
|
|
chrX_-_135941498
|
1.507
|
NM_054021
|
GPR101
|
G protein-coupled receptor 101
|
|
chr18_+_53253775
|
1.502
|
NM_004852
|
ONECUT2
|
one cut homeobox 2
|
|
chr19_+_59068787
|
1.500
|
|
MYADM
|
myeloid-associated differentiation marker
|
|
chr22_-_36809094
|
1.500
|
NM_013356
|
SLC16A8
|
solute carrier family 16, member 8 (monocarboxylic acid transporter 3)
|
|
chr14_+_64077171
|
1.499
|
|
HSPA2
|
heat shock 70kDa protein 2
|
|
chr7_-_19151509
|
1.485
|
NM_152898
|
FERD3L
|
Fer3-like (Drosophila)
|
|
chr15_+_100175888
|
1.482
|
NM_001001674
|
OR4F15
|
olfactory receptor, family 4, subfamily F, member 15
|
|
chr15_-_50869379
|
1.481
|
NM_004498
|
ONECUT1
|
one cut homeobox 1
|
|
chr6_+_108593907
|
1.466
|
NM_003269
|
NR2E1
|
nuclear receptor subfamily 2, group E, member 1
|
|
chr7_-_4867963
|
1.446
|
NM_020144
|
PAPOLB
|
poly(A) polymerase beta (testis specific)
|
|
chr7_+_103756339
|
1.436
|
NM_199000
|
LHFPL3
|
lipoma HMGIC fusion partner-like 3
|
|
chr17_-_4636248
|
1.427
|
NM_001144939
NM_001144940
NM_001144941
NM_182566
|
VMO1
|
vitelline membrane outer layer 1 homolog (chicken)
|
|
chr13_+_95002942
|
1.422
|
NM_006984
|
CLDN10
|
claudin 10
|
|
chr10_-_54201400
|
1.416
|
NM_000242
|
MBL2
|
mannose-binding lectin (protein C) 2, soluble
|
|
chr1_-_156657279
|
1.409
|
NM_001004476
|
OR10K2
|
olfactory receptor, family 10, subfamily K, member 2
|
|
chr1_+_147819626
|
1.409
|
NM_178230
NM_001135789
|
PPIAL4A
PPIAL4G
PPIAL4C
|
peptidylprolyl isomerase A (cyclophilin A)-like 4A
peptidylprolyl isomerase A (cyclophilin A)-like 4G
peptidylprolyl isomerase A (cyclophilin A)-like 4C
|
|
chr2_-_38156769
|
1.402
|
|
CYP1B1
|
cytochrome P450, family 1, subfamily B, polypeptide 1
|
|
chr14_-_47213906
|
1.397
|
NM_001113498
|
MDGA2
|
MAM domain containing glycosylphosphatidylinositol anchor 2
|
|
chr4_-_41445479
|
1.397
|
|
PHOX2B
|
paired-like homeobox 2b
|
|
chr4_-_41445693
|
1.376
|
NM_003924
|
PHOX2B
|
paired-like homeobox 2b
|
|
chrX_-_63362227
|
1.375
|
NM_130388
|
ASB12
|
ankyrin repeat and SOCS box containing 12
|
|
chr3_+_52788976
|
1.374
|
NM_001166435
NM_001166436
|
ITIH1
|
inter-alpha (globulin) inhibitor H1
|
|
chr18_-_33399601
|
1.360
|
|
CELF4
|
CUGBP, Elav-like family member 4
|
|
chr1_+_207823667
|
1.355
|
NM_020439
|
CAMK1G
|
calcium/calmodulin-dependent protein kinase IG
|
|
chrX_-_39532391
|
1.354
|
|
|
|
|
chr2_-_38156811
|
1.354
|
NM_000104
|
CYP1B1
|
cytochrome P450, family 1, subfamily B, polypeptide 1
|
|
chr8_-_93176819
|
1.352
|
|
RUNX1T1
|
runt-related transcription factor 1; translocated to, 1 (cyclin D-related)
|
|
chr7_+_143263191
|
1.346
|
NM_001004685
|
OR2F2
|
olfactory receptor, family 2, subfamily F, member 2
|
|
chr2_-_39040981
|
1.338
|
|
LOC375196
|
hypothetical LOC375196
|
|
chr7_-_44071640
|
1.335
|
NM_000290
|
PGAM2
|
phosphoglycerate mutase 2 (muscle)
|
|
chr1_-_175400441
|
1.331
|
|
ASTN1
|
astrotactin 1
|
|
chrX_-_152889815
|
1.315
|
NM_005334
|
HCFC1
|
host cell factor C1 (VP16-accessory protein)
|
|
chr8_-_121892877
|
1.301
|
|
SNTB1
|
syntrophin, beta 1 (dystrophin-associated protein A1, 59kDa, basic component 1)
|
|
chr11_-_27698800
|
1.300
|
NM_001143805
NM_001143806
NM_170732
|
BDNF
|
brain-derived neurotrophic factor
|
|
chr8_-_144583718
|
1.294
|
NM_201589
|
MAFA
|
v-maf musculoaponeurotic fibrosarcoma oncogene homolog A (avian)
|
|
chr3_-_48675321
|
1.292
|
NM_001407
|
CELSR3
|
cadherin, EGF LAG seven-pass G-type receptor 3 (flamingo homolog, Drosophila)
|
|
chr3_+_19164973
|
1.289
|
NM_144633
|
KCNH8
|
potassium voltage-gated channel, subfamily H (eag-related), member 8
|
|
chr9_+_139892049
|
1.288
|
NM_000718
|
CACNA1B
|
calcium channel, voltage-dependent, N type, alpha 1B subunit
|
|
chr1_+_156991133
|
1.282
|
NM_001005184
|
OR6K6
|
olfactory receptor, family 6, subfamily K, member 6
|
|
chr1_+_2975590
|
1.272
|
NM_022114
NM_199454
|
PRDM16
|
PR domain containing 16
|
|
chr4_-_138673014
|
1.271
|
|
PCDH18
|
protocadherin 18
|
|
chr20_-_47532585
|
1.267
|
NM_004975
|
KCNB1
|
potassium voltage-gated channel, Shab-related subfamily, member 1
|
|
chrX_+_82649924
|
1.264
|
NM_000307
|
POU3F4
|
POU class 3 homeobox 4
|
|
chr2_-_51112743
|
1.253
|
|
NRXN1
|
neurexin 1
|
|
chr3_-_51968995
|
1.238
|
|
PCBP4
|
poly(rC) binding protein 4
|
|
chr1_-_181654027
|
1.229
|
|
|
|
|
chr6_-_114490701
|
1.221
|
NM_153612
|
HS3ST5
|
heparan sulfate (glucosamine) 3-O-sulfotransferase 5
|
|
chr14_-_23117833
|
1.217
|
NM_001146028
NM_032452
|
JPH4
|
junctophilin 4
|
|
chr14_-_79747592
|
1.214
|
NM_001007023
|
DIO2
|
deiodinase, iodothyronine, type II
|
|
chr13_+_111769913
|
1.209
|
NM_005986
|
SOX1
|
SRY (sex determining region Y)-box 1
|
|
chr4_-_123073642
|
1.208
|
NM_003305
|
TRPC3
|
transient receptor potential cation channel, subfamily C, member 3
|
|
chr19_-_14030970
|
1.206
|
NM_001145028
|
PALM3
|
paralemmin 3
|
|
chr7_-_36992221
|
1.200
|
NM_130442
|
ELMO1
|
engulfment and cell motility 1
|
|
chr5_+_38294289
|
1.190
|
NM_152403
|
EGFLAM
|
EGF-like, fibronectin type III and laminin G domains
|
|
chr9_-_114692782
|
1.185
|
NM_033051
|
SLC46A2
|
solute carrier family 46, member 2
|
|
chr1_-_146569159
|
1.183
|
NM_001164261
NM_001164262
NM_001144032
|
PPIAL4D
PPIAL4F
PPIAL4E
|
peptidylprolyl isomerase A (cyclophilin A)-like 4D
peptidylprolyl isomerase A (cyclophilin A)-like 4F
peptidylprolyl isomerase A (cyclophilin A)-like 4E
|
|
chr11_-_72063059
|
1.174
|
NM_002599
|
PDE2A
|
phosphodiesterase 2A, cGMP-stimulated
|
|
chr4_-_41848874
|
1.173
|
|
BEND4
|
BEN domain containing 4
|
|
chr11_-_71632864
|
1.160
|
NM_005169
|
PHOX2A
|
paired-like homeobox 2a
|
|
chrX_+_69559605
|
1.159
|
NM_001171191
NM_001171192
NM_001171193
NM_017711
|
GDPD2
|
glycerophosphodiester phosphodiesterase domain containing 2
|
|
chr10_-_99780574
|
1.157
|
NM_018058
|
CRTAC1
|
cartilage acidic protein 1
|
|
chr22_+_36549334
|
1.155
|
NM_003614
|
GALR3
|
galanin receptor 3
|
|
chr11_-_16380967
|
1.153
|
NM_001145819
NM_017508
|
SOX6
|
SRY (sex determining region Y)-box 6
|
|
chr17_+_1120607
|
1.149
|
NM_001164405
|
BHLHA9
|
basic helix-loop-helix family, member a9
|
|
chr4_-_24641404
|
1.134
|
NM_018176
|
LGI2
|
leucine-rich repeat LGI family, member 2
|
|
chr2_-_96145614
|
1.134
|
NM_000682
|
ADRA2B
|
adrenergic, alpha-2B-, receptor
|
|
chrX_+_38305634
|
1.124
|
NM_004615
|
TSPAN7
|
tetraspanin 7
|
|
chr11_-_64133908
|
1.123
|
|
|
|
|
chr1_-_218168548
|
1.121
|
NM_018713
|
SLC30A10
|
solute carrier family 30, member 10
|
|
chrX_-_55037235
|
1.121
|
NM_002625
|
PFKFB1
|
6-phosphofructo-2-kinase/fructose-2,6-biphosphatase 1
|
|
chr8_-_132122016
|
1.116
|
NM_001115
|
ADCY8
|
adenylate cyclase 8 (brain)
|
|
chrX_+_113724806
|
1.114
|
NM_000868
|
HTR2C
|
5-hydroxytryptamine (serotonin) receptor 2C
|
|
chr7_-_99312591
|
1.114
|
NM_001005276
|
OR2AE1
|
olfactory receptor, family 2, subfamily AE, member 1
|
|
chr17_+_23735637
|
1.113
|
|
SARM1
|
sterile alpha and TIR motif containing 1
|
|
chr15_+_58083712
|
1.112
|
NM_012182
|
FOXB1
|
forkhead box B1
|
|
chr3_+_134976965
|
1.108
|
|
TF
|
transferrin
|
|
chr5_+_175241449
|
1.105
|
|
CPLX2
|
complexin 2
|
|
chr1_-_156635879
|
1.104
|
NM_001004475
|
OR10T2
|
olfactory receptor, family 10, subfamily T, member 2
|
|
chr6_+_69401660
|
1.103
|
NM_001704
|
BAI3
|
brain-specific angiogenesis inhibitor 3
|
|
chr4_-_70539922
|
1.103
|
NM_001105677
|
UGT2A2
|
UDP glucuronosyltransferase 2 family, polypeptide A2
|
|
chr7_-_31347032
|
1.100
|
NM_022728
|
NEUROD6
|
neurogenic differentiation 6
|
|
chr6_+_72653369
|
1.099
|
NM_014989
|
RIMS1
|
regulating synaptic membrane exocytosis 1
|
|
chr6_+_72653420
|
1.093
|
|
RIMS1
|
regulating synaptic membrane exocytosis 1
|
|
chr8_+_50987149
|
1.090
|
NM_018967
|
SNTG1
|
syntrophin, gamma 1
|
|
chr8_-_23619866
|
1.088
|
NM_001136271
|
NKX2-6
|
NK2 transcription factor related, locus 6 (Drosophila)
|
|
chr10_+_50487146
|
1.087
|
NM_020984
|
CHAT
|
choline O-acetyltransferase
|
|
chr10_+_106391032
|
1.078
|
|
SORCS3
|
sortilin-related VPS10 domain containing receptor 3
|
|
chr11_-_123772456
|
1.074
|
NM_001005467
|
OR8B3
|
olfactory receptor, family 8, subfamily B, member 3
|
|
chr14_+_61532293
|
1.074
|
NM_031914
|
SYT16
|
synaptotagmin XVI
|
|
chr14_+_68796621
|
1.071
|
|
GALNTL1
|
UDP-N-acetyl-alpha-D-galactosamine:polypeptide N-acetylgalactosaminyltransferase-like 1
|
|
chr6_+_132901119
|
1.065
|
NM_175057
|
TAAR9
|
trace amine associated receptor 9 (gene/pseudogene)
|
|
chr9_+_70107602
|
1.063
|
NM_199135
|
FOXD4L3
FOXD4L6
|
forkhead box D4-like 3
forkhead box D4-like 6
|
|
chr13_-_83354474
|
1.063
|
NM_052910
|
SLITRK1
|
SLIT and NTRK-like family, member 1
|
|
chr11_+_104986620
|
1.058
|
NM_001112812
|
GRIA4
|
glutamate receptor, ionotrophic, AMPA 4
|
|
chr4_-_164754106
|
1.057
|
NM_017923
|
MARCH1
|
membrane-associated ring finger (C3HC4) 1
|
|
chr15_-_86600658
|
1.053
|
NM_001007156
NM_001012338
NM_002530
|
NTRK3
|
neurotrophic tyrosine kinase, receptor, type 3
|
|
chr14_-_23117268
|
1.052
|
|
JPH4
|
junctophilin 4
|
|
chr4_-_44145580
|
1.050
|
NM_198353
|
KCTD8
|
potassium channel tetramerisation domain containing 8
|
|
chr9_+_124321239
|
1.048
|
NM_001004452
|
OR1J4
|
olfactory receptor, family 1, subfamily J, member 4
|
|
chrX_+_72140076
|
1.047
|
NM_001042506
|
PABPC1L2B
|
poly(A) binding protein, cytoplasmic 1-like 2B
|
|
chr9_-_21340885
|
1.042
|
NM_021002
|
IFNA6
|
interferon, alpha 6
|
|
chr11_+_123391491
|
1.039
|
NM_001004462
|
OR10G4
|
olfactory receptor, family 10, subfamily G, member 4
|
|
chr17_-_35017650
|
1.038
|
|
NEUROD2
|
neurogenic differentiation 2
|
|
chr9_-_115901157
|
1.037
|
NM_138424
|
KIF12
|
kinesin family member 12
|
|
chr12_+_52105131
|
1.031
|
|
AMHR2
|
anti-Mullerian hormone receptor, type II
|
|
chr12_+_50568010
|
1.030
|
NM_001130015
NM_182608
|
ANKRD33
|
ankyrin repeat domain 33
|
|
chr3_+_52787478
|
1.030
|
NM_001166434
|
ITIH1
|
inter-alpha (globulin) inhibitor H1
|
|
chr16_+_3345889
|
1.022
|
NM_012368
|
OR2C1
|
olfactory receptor, family 2, subfamily C, member 1
|
|
chrX_+_70359780
|
1.016
|
NM_000166
|
GJB1
|
gap junction protein, beta 1, 32kDa
|
|
chr11_-_6148131
|
1.015
|
NM_001004052
|
OR52B2
|
olfactory receptor, family 52, subfamily B, member 2
|
|
chr13_+_49487390
|
1.013
|
NM_173605
NM_199464
|
TRIM13
KCNRG
|
tripartite motif containing 13
potassium channel regulator
|
|
chr6_+_43373972
|
1.013
|
NM_006672
NM_153320
|
SLC22A7
|
solute carrier family 22 (organic anion transporter), member 7
|
|
chr10_-_116408046
|
1.012
|
NM_002313
|
ABLIM1
|
actin binding LIM protein 1
|
|
chr17_-_77824849
|
1.011
|
NM_001893
NM_139062
|
CSNK1D
|
casein kinase 1, delta
|
|
chr10_+_105334704
|
1.010
|
|
NEURL
|
neuralized homolog (Drosophila)
|
|
chr19_-_14813688
|
1.007
|
NM_001005190
|
OR7A10
|
olfactory receptor, family 7, subfamily A, member 10
|
|
chr1_+_50348052
|
1.007
|
|
ELAVL4
|
ELAV (embryonic lethal, abnormal vision, Drosophila)-like 4 (Hu antigen D)
|
|
chrX_-_72215949
|
1.007
|
NM_001012977
|
PABPC1L2A
PABPC1L2B
|
poly(A) binding protein, cytoplasmic 1-like 2A
poly(A) binding protein, cytoplasmic 1-like 2B
|
|
chr16_-_29817841
|
1.005
|
NM_001114099
NM_001114100
NM_012410
NM_201575
|
SEZ6L2
|
seizure related 6 homolog (mouse)-like 2
|
|
chr8_+_110168828
|
1.005
|
NM_003301
|
TRHR
|
thyrotropin-releasing hormone receptor
|
|
chr12_-_48246488
|
1.002
|
NM_001012300
|
MCRS1
|
microspherule protein 1
|
|
chr9_+_130231027
|
1.001
|
|
CERCAM
|
cerebral endothelial cell adhesion molecule
|
|
chr8_+_22266256
|
1.001
|
|
PIWIL2
|
piwi-like 2 (Drosophila)
|
|
chr17_+_7495436
|
1.001
|
|
ATP1B2
|
ATPase, Na+/K+ transporting, beta 2 polypeptide
|
|
chr8_-_114518194
|
0.997
|
NM_052900
NM_198123
|
CSMD3
|
CUB and Sushi multiple domains 3
|
|
chr5_-_59225377
|
0.995
|
NM_001104631
|
PDE4D
|
phosphodiesterase 4D, cAMP-specific
|
|
chr21_+_36993860
|
0.992
|
NM_005069
NM_009586
|
SIM2
|
single-minded homolog 2 (Drosophila)
|
|
chr2_+_137464931
|
0.990
|
NM_001080427
|
THSD7B
|
thrombospondin, type I, domain containing 7B
|
|
chr6_-_48144344
|
0.990
|
NM_001013732
NM_207499
|
C6orf138
|
chromosome 6 open reading frame 138
|
|
chr17_-_17340219
|
0.985
|
NM_016084
|
RASD1
|
RAS, dexamethasone-induced 1
|
|
chr9_+_78824390
|
0.985
|
NM_001013735
|
FOXB2
|
forkhead box B2
|
|
chr1_-_149955870
|
0.984
|
NM_007185
|
CELF3
|
CUGBP, Elav-like family member 3
|
|
chrX_+_77267477
|
0.980
|
|
PGK1
|
phosphoglycerate kinase 1
|
|
chr1_+_158317967
|
0.979
|
NM_004983
|
KCNJ9
|
potassium inwardly-rectifying channel, subfamily J, member 9
|
|
chr18_+_53170718
|
0.977
|
NM_015879
|
ST8SIA3
|
ST8 alpha-N-acetyl-neuraminide alpha-2,8-sialyltransferase 3
|
|
chr1_+_156842852
|
0.975
|
NM_001004478
|
OR10Z1
|
olfactory receptor, family 10, subfamily Z, member 1
|
|
chr5_-_160044844
|
0.973
|
|
ATP10B
|
ATPase, class V, type 10B
|
|
chr11_-_123182266
|
0.972
|
NM_001005325
|
OR6M1
|
olfactory receptor, family 6, subfamily M, member 1
|
|
chr3_-_69064364
|
0.972
|
NM_001005527
NM_182522
|
FAM19A4
|
family with sequence similarity 19 (chemokine (C-C motif)-like), member A4
|
|
chr4_+_61749540
|
0.970
|
|
LPHN3
|
latrophilin 3
|
|
chr1_-_226679648
|
0.969
|
NM_003493
|
HIST3H3
|
histone cluster 3, H3
|
|
chr14_-_60185659
|
0.967
|
NM_005982
|
SIX1
|
SIX homeobox 1
|
|
chr12_+_101876151
|
0.965
|
|
ASCL1
|
achaete-scute complex homolog 1 (Drosophila)
|
|
chr7_-_5534252
|
0.962
|
|
ACTB
|
actin, beta
|
|
chr1_+_116181927
|
0.960
|
|
NHLH2
|
nescient helix loop helix 2
|
|
chr9_+_76302071
|
0.959
|
NM_006914
|
RORB
|
RAR-related orphan receptor B
|
|
chr1_-_218168404
|
0.958
|
|
|
|
|
chr13_-_83354425
|
0.957
|
|
SLITRK1
|
SLIT and NTRK-like family, member 1
|
