|
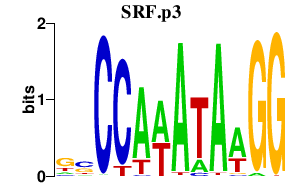
chr15_-_32875040
|
3.907
|
NM_005159
|
ACTC1
|
actin, alpha, cardiac muscle 1
|
|
chr10_-_64246129
|
2.936
|
NM_000399
NM_001136177
NM_001136179
|
EGR2
|
early growth response 2
|
|
chr10_-_64246080
|
2.611
|
|
EGR2
|
early growth response 2
|
|
chr10_-_131652364
|
2.262
|
|
EBF3
|
early B-cell factor 3
|
|
chr9_+_91409746
|
2.078
|
NM_006705
|
GADD45G
|
growth arrest and DNA-damage-inducible, gamma
|
|
chr19_-_50517971
|
2.072
|
|
CKM
|
creatine kinase, muscle
|
|
chr5_+_149526533
|
1.992
|
NM_001804
|
CDX1
|
caudal type homeobox 1
|
|
chr20_+_34603290
|
1.904
|
NM_006097
NM_181526
|
MYL9
|
myosin, light chain 9, regulatory
|
|
chr9_+_36126667
|
1.896
|
|
GLIPR2
|
GLI pathogenesis-related 2
|
|
chr17_-_44026042
|
1.837
|
NM_002147
|
HOXB5
|
homeobox B5
|
|
chr9_+_36126710
|
1.790
|
NM_022343
|
GLIPR2
|
GLI pathogenesis-related 2
|
|
chr2_+_42128521
|
1.675
|
NM_138370
|
PKDCC
|
protein kinase domain containing, cytoplasmic homolog (mouse)
|
|
chr2_-_128149112
|
1.481
|
NM_001136037
NM_001161403
|
LIMS2
|
LIM and senescent cell antigen-like domains 2
|
|
chr20_+_34603311
|
1.441
|
|
MYL9
|
myosin, light chain 9, regulatory
|
|
chr17_-_44026321
|
1.345
|
|
HOXB5
|
homeobox B5
|
|
chr19_-_50518072
|
1.218
|
NM_001824
|
CKM
|
creatine kinase, muscle
|
|
chr19_-_15204767
|
1.059
|
NM_001142886
|
EPHX3
|
epoxide hydrolase 3
|
|
chr4_+_81337663
|
1.056
|
NM_001099403
|
PRDM8
|
PR domain containing 8
|
|
chr11_-_2118743
|
1.026
|
|
IGF2
|
insulin-like growth factor 2 (somatomedin A)
|
|
chr2_+_88148413
|
0.993
|
NM_198274
|
SMYD1
|
SET and MYND domain containing 1
|
|
chr6_-_123999640
|
0.978
|
NM_006073
|
TRDN
|
triadin
|
|
chr9_+_139892049
|
0.971
|
NM_000718
|
CACNA1B
|
calcium channel, voltage-dependent, N type, alpha 1B subunit
|
|
chr5_-_33928049
|
0.969
|
|
ADAMTS12
|
ADAM metallopeptidase with thrombospondin type 1 motif, 12
|
|
chr6_+_151602787
|
0.944
|
NM_005100
|
AKAP12
|
A kinase (PRKA) anchor protein 12
|
|
chr1_-_152431175
|
0.941
|
NM_152263
|
TPM3
|
tropomyosin 3
|
|
chr2_-_30883775
|
0.941
|
NM_144575
|
CAPN13
|
calpain 13
|
|
chr12_-_11439752
|
0.918
|
NM_006248
|
PRB1
PRB2
|
proline-rich protein BstNI subfamily 1
proline-rich protein BstNI subfamily 2
|
|
chr17_+_39990124
|
0.880
|
NM_001466
|
FZD2
|
frizzled homolog 2 (Drosophila)
|
|
chr1_-_16217025
|
0.814
|
|
HSPB7
|
heat shock 27kDa protein family, member 7 (cardiovascular)
|
|
chr7_-_44147436
|
0.795
|
NM_021223
|
MYL7
|
myosin, light chain 7, regulatory
|
|
chr11_-_57038891
|
0.794
|
NM_001198810
|
SLC43A1
|
solute carrier family 43, member 1
|
|
chr5_-_33927724
|
0.793
|
NM_030955
|
ADAMTS12
|
ADAM metallopeptidase with thrombospondin type 1 motif, 12
|
|
chr2_-_105381855
|
0.786
|
NM_001039492
NM_001450
NM_201555
|
FHL2
|
four and a half LIM domains 2
|
|
chr9_-_78710698
|
0.772
|
NM_015225
|
PRUNE2
|
prune homolog 2 (Drosophila)
|
|
chr10_+_88418147
|
0.729
|
NM_001171610
|
LDB3
|
LIM domain binding 3
|
|
chr15_+_43193810
|
0.717
|
NM_207581
|
DUOXA2
|
dual oxidase maturation factor 2
|
|
chr2_-_160765008
|
0.716
|
|
ITGB6
|
integrin, beta 6
|
|
chr11_-_47330797
|
0.687
|
NM_000256
|
MYBPC3
|
myosin binding protein C, cardiac
|
|
chr1_+_165866127
|
0.686
|
|
RCSD1
|
RCSD domain containing 1
|
|
chr15_-_63147350
|
0.672
|
NM_016563
|
RASL12
|
RAS-like, family 12
|
|
chr5_+_92944680
|
0.672
|
NM_005654
|
NR2F1
|
nuclear receptor subfamily 2, group F, member 1
|
|
chr5_+_88220846
|
0.646
|
|
|
|
|
chr19_+_53650577
|
0.642
|
NM_013348
|
KCNJ14
|
potassium inwardly-rectifying channel, subfamily J, member 14
|
|
chr6_-_105691675
|
0.633
|
|
BVES
|
blood vessel epicardial substance
|
|
chr1_+_165865953
|
0.596
|
NM_052862
|
RCSD1
|
RCSD domain containing 1
|
|
chr6_+_151603201
|
0.559
|
|
AKAP12
|
A kinase (PRKA) anchor protein 12
|
|
chr15_-_43193637
|
0.556
|
NM_014080
|
DUOX2
|
dual oxidase 2
|
|
chrX_-_11194015
|
0.552
|
NM_013423
|
ARHGAP6
|
Rho GTPase activating protein 6
|
|
chr2_-_40593074
|
0.549
|
NM_001112802
|
SLC8A1
|
solute carrier family 8 (sodium/calcium exchanger), member 1
|
|
chr20_-_42249146
|
0.510
|
|
JPH2
|
junctophilin 2
|
|
chr12_+_50731457
|
0.504
|
NM_002135
NM_173157
|
NR4A1
|
nuclear receptor subfamily 4, group A, member 1
|
|
chr2_+_107969410
|
0.503
|
NM_021815
|
SLC5A7
|
solute carrier family 5 (choline transporter), member 7
|
|
chr11_-_75599433
|
0.490
|
|
WNT11
|
wingless-type MMTV integration site family, member 11
|
|
chr7_-_121731721
|
0.489
|
NM_001024613
NM_001160264
|
FEZF1
|
FEZ family zinc finger 1
|
|
chr11_+_66070949
|
0.486
|
NM_001104
|
ACTN3
|
actinin, alpha 3
|
|
chr19_+_12995782
|
0.479
|
|
NFIX
|
nuclear factor I/X (CCAAT-binding transcription factor)
|
|
chr5_-_58331515
|
0.474
|
NM_001197223
|
PDE4D
|
phosphodiesterase 4D, cAMP-specific
|
|
chr11_-_118799058
|
0.456
|
|
THY1
|
Thy-1 cell surface antigen
|
|
chr20_+_60558104
|
0.454
|
NM_178463
|
C20orf166
|
chromosome 20 open reading frame 166
|
|
chr12_+_52713098
|
0.454
|
NM_018953
|
HOXC5
|
homeobox C5
|
|
chr11_+_59564323
|
0.453
|
NM_173801
|
PLAC1L
|
placenta-specific 1-like
|
|
chr5_+_169749068
|
0.445
|
|
|
|
|
chr10_+_88418243
|
0.444
|
NM_001080116
NM_001080114
NM_001080115
NM_001171611
NM_007078
|
LDB3
|
LIM domain binding 3
|
|
chr8_+_1937711
|
0.443
|
|
KBTBD11
|
kelch repeat and BTB (POZ) domain containing 11
|
|
chr10_+_31650069
|
0.442
|
NM_001128128
NM_001174094
|
ZEB1
|
zinc finger E-box binding homeobox 1
|
|
chr15_-_43193614
|
0.433
|
|
DUOX2
|
dual oxidase 2
|
|
chr19_+_16039170
|
0.423
|
NM_001145160
|
TPM4
|
tropomyosin 4
|
|
chr17_-_69869552
|
0.420
|
NM_001080466
|
BTBD17
|
BTB (POZ) domain containing 17
|
|
chrX_-_99873728
|
0.416
|
NM_001129896
|
SYTL4
|
synaptotagmin-like 4
|
|
chr12_-_48902692
|
0.409
|
NM_001113547
|
LIMA1
|
LIM domain and actin binding 1
|
|
chr3_-_71376919
|
0.405
|
|
FOXP1
|
forkhead box P1
|
|
chr20_-_1922701
|
0.401
|
NM_001190899
NM_001190898
NM_024411
|
PDYN
|
prodynorphin
|
|
chr1_-_227636462
|
0.398
|
NM_001100
|
ACTA1
|
actin, alpha 1, skeletal muscle
|
|
chr2_+_73973600
|
0.394
|
NM_001615
|
ACTG2
|
actin, gamma 2, smooth muscle, enteric
|
|
chr2_-_21120420
|
0.390
|
NM_000384
|
APOB
|
apolipoprotein B (including Ag(x) antigen)
|
|
chr17_+_29707583
|
0.385
|
NM_005408
|
CCL13
|
chemokine (C-C motif) ligand 13
|
|
chr3_-_124821868
|
0.381
|
|
MYLK
|
myosin light chain kinase
|
|
chr22_+_28206180
|
0.377
|
NM_021076
|
NEFH
|
neurofilament, heavy polypeptide
|
|
chr20_-_21442663
|
0.376
|
NM_002509
|
NKX2-2
|
NK2 homeobox 2
|
|
chr6_-_29635680
|
0.374
|
NM_006398
|
UBD
|
ubiquitin D
|
|
chr20_-_604443
|
0.371
|
|
|
|
|
chr12_-_46405477
|
0.362
|
NM_001172439
NM_001172440
NM_006025
|
ENDOU
|
endonuclease, polyU-specific
|
|
chr7_-_94123308
|
0.362
|
|
SGCE
|
sarcoglycan, epsilon
|
|
chr2_-_31659472
|
0.360
|
NM_000348
|
SRD5A2
|
steroid-5-alpha-reductase, alpha polypeptide 2 (3-oxo-5 alpha-steroid delta 4-dehydrogenase alpha 2)
|
|
chr7_+_94123612
|
0.357
|
NM_001172437
NM_001172438
|
PEG10
|
paternally expressed 10
|
|
chr1_-_166373434
|
0.352
|
|
GPR161
|
G protein-coupled receptor 161
|
|
chr11_-_8982107
|
0.352
|
NM_020645
|
NRIP3
|
nuclear receptor interacting protein 3
|
|
chr6_+_12824873
|
0.351
|
|
PHACTR1
|
phosphatase and actin regulator 1
|
|
chr1_-_925332
|
0.346
|
NM_001142467
NM_021170
|
HES4
|
hairy and enhancer of split 4 (Drosophila)
|
|
chr4_+_156899575
|
0.342
|
NM_000857
|
GUCY1B3
|
guanylate cyclase 1, soluble, beta 3
|
|
chrX_-_103386215
|
0.341
|
NM_153448
|
ESX1
|
ESX homeobox 1
|
|
chr4_+_24406182
|
0.339
|
NM_003102
|
SOD3
|
superoxide dismutase 3, extracellular
|
|
chr14_+_73775927
|
0.329
|
NM_182894
|
VSX2
|
visual system homeobox 2
|
|
chr5_+_140730014
|
0.320
|
NM_018924
NM_032097
|
PCDHGB3
|
protocadherin gamma subfamily B, 3
|
|
chrX_+_99726445
|
0.316
|
NM_022144
|
TNMD
|
tenomodulin
|
|
chr1_-_31618405
|
0.314
|
NM_004102
|
FABP3
|
fatty acid binding protein 3, muscle and heart (mammary-derived growth inhibitor)
|
|
chr2_+_87536106
|
0.307
|
|
NCRNA00152
|
non-protein coding RNA 152
|
|
chr20_+_32610161
|
0.304
|
NM_032514
|
MAP1LC3A
|
microtubule-associated protein 1 light chain 3 alpha
|
|
chr17_-_3129017
|
0.295
|
NM_002551
|
OR3A2
|
olfactory receptor, family 3, subfamily A, member 2
|
|
chr20_+_155898
|
0.291
|
NM_080831
|
DEFB129
|
defensin, beta 129
|
|
chr19_+_12996368
|
0.290
|
|
NFIX
|
nuclear factor I/X (CCAAT-binding transcription factor)
|
|
chr7_+_113842470
|
0.290
|
|
FOXP2
|
forkhead box P2
|
|
chr5_+_137829077
|
0.288
|
NM_001964
|
EGR1
|
early growth response 1
|
|
chr20_-_33706532
|
0.278
|
|
RBM12
|
RNA binding motif protein 12
|
|
chr2_-_215956429
|
0.275
|
|
FN1
|
fibronectin 1
|
|
chr7_-_94123413
|
0.274
|
NM_001099400
NM_001099401
NM_003919
|
SGCE
|
sarcoglycan, epsilon
|
|
chr3_+_189413414
|
0.266
|
NM_005578
|
LPP
|
LIM domain containing preferred translocation partner in lipoma
|
|
chr7_-_94123362
|
0.263
|
|
SGCE
|
sarcoglycan, epsilon
|
|
chr7_+_94123672
|
0.263
|
|
PEG10
|
paternally expressed 10
|
|
chr1_-_925215
|
0.262
|
|
HES4
|
hairy and enhancer of split 4 (Drosophila)
|
|
chr14_+_74815233
|
0.258
|
NM_005252
|
FOS
|
FBJ murine osteosarcoma viral oncogene homolog
|
|
chr17_+_55269974
|
0.257
|
|
|
|
|
chr1_+_6226838
|
0.257
|
NM_001024598
|
HES3
|
hairy and enhancer of split 3 (Drosophila)
|
|
chr2_-_21120398
|
0.256
|
|
APOB
|
apolipoprotein B (including Ag(x) antigen)
|
|
chr14_+_104338423
|
0.250
|
|
ZBTB42
|
zinc finger and BTB domain containing 42
|
|
chr1_-_150599105
|
0.250
|
NM_001014342
|
FLG2
|
filaggrin family member 2
|
|
chr10_+_112247614
|
0.241
|
NM_004419
|
DUSP5
|
dual specificity phosphatase 5
|
|
chr16_+_29984611
|
0.238
|
|
ALDOA
|
aldolase A, fructose-bisphosphate
|
|
chr16_+_29984647
|
0.235
|
|
ALDOA
|
aldolase A, fructose-bisphosphate
|
|
chr8_-_22606653
|
0.230
|
NM_004430
|
EGR3
|
early growth response 3
|
|
chr15_-_63147228
|
0.229
|
|
RASL12
|
RAS-like, family 12
|
|
chr2_+_73973640
|
0.219
|
|
ACTG2
|
actin, gamma 2, smooth muscle, enteric
|
|
chr3_-_46879883
|
0.217
|
NM_000258
|
MYL3
|
myosin, light chain 3, alkali; ventricular, skeletal, slow
|
|
chr7_-_107430566
|
0.214
|
NM_002291
|
LAMB1
|
laminin, beta 1
|
|
chr6_-_26216299
|
0.213
|
NM_005323
|
HIST1H1T
|
histone cluster 1, H1t
|
|
chr10_-_29963906
|
0.208
|
NM_021738
|
SVIL
|
supervillin
|
|
chr16_+_54247400
|
0.208
|
|
SLC6A2
|
solute carrier family 6 (neurotransmitter transporter, noradrenalin), member 2
|
|
chr15_+_94670160
|
0.207
|
NM_001145155
|
NR2F2
|
nuclear receptor subfamily 2, group F, member 2
|
|
chr3_+_25445071
|
0.193
|
|
RARB
|
retinoic acid receptor, beta
|
|
chr3_+_54131731
|
0.190
|
NM_018398
|
CACNA2D3
|
calcium channel, voltage-dependent, alpha 2/delta subunit 3
|
|
chr19_+_50109416
|
0.190
|
|
APOC1
|
apolipoprotein C-I
|
|
chr5_-_150264696
|
0.189
|
NM_001172831
NM_001172832
NM_052860
|
ZNF300
|
zinc finger protein 300
|
|
chr16_+_29984621
|
0.189
|
|
ALDOA
|
aldolase A, fructose-bisphosphate
|
|
chr16_+_29984591
|
0.186
|
|
ALDOA
|
aldolase A, fructose-bisphosphate
|
|
chr8_+_24827173
|
0.185
|
NM_005382
|
NEFM
|
neurofilament, medium polypeptide
|
|
chrX_+_153318662
|
0.185
|
|
GDI1
|
GDP dissociation inhibitor 1
|
|
chr3_-_158704056
|
0.184
|
NM_001167915
NM_001167916
|
VEPH1
|
ventricular zone expressed PH domain homolog 1 (zebrafish)
|
|
chr2_-_105421661
|
0.181
|
NM_201557
|
FHL2
|
four and a half LIM domains 2
|
|
chr15_+_31390454
|
0.180
|
NM_001036
|
RYR3
|
ryanodine receptor 3
|
|
chr19_-_63550712
|
0.180
|
|
A1BG
|
alpha-1-B glycoprotein
|
|
chr15_-_99847395
|
0.178
|
|
PCSK6
|
proprotein convertase subtilisin/kexin type 6
|
|
chr11_-_30562324
|
0.177
|
|
MPPED2
|
metallophosphoesterase domain containing 2
|
|
chr11_+_43920385
|
0.173
|
NM_001145033
|
C11orf96
|
chromosome 11 open reading frame 96
|
|
chr1_-_166373351
|
0.172
|
|
GPR161
|
G protein-coupled receptor 161
|
|
chr7_+_113842284
|
0.172
|
NM_001172766
NM_014491
NM_148898
NM_148900
|
FOXP2
|
forkhead box P2
|
|
chr16_+_29984544
|
0.169
|
NM_184041
|
ALDOA
|
aldolase A, fructose-bisphosphate
|
|
chr19_+_39402167
|
0.167
|
|
LSM14A
|
LSM14A, SCD6 homolog A (S. cerevisiae)
|
|
chr1_-_166373159
|
0.165
|
|
GPR161
|
G protein-coupled receptor 161
|
|
chr20_-_18425811
|
0.164
|
NM_006606
|
RBBP9
|
retinoblastoma binding protein 9
|
|
chr3_-_102888090
|
0.163
|
NM_000986
|
RPL24
|
ribosomal protein L24
|
|
chr2_-_27384617
|
0.161
|
NM_003353
|
UCN
|
urocortin
|
|
chr12_+_60940404
|
0.159
|
NM_006313
|
USP15
|
ubiquitin specific peptidase 15
|
|
chrX_-_37591760
|
0.158
|
NM_006520
|
DYNLT3
|
dynein, light chain, Tctex-type 3
|
|
chrX_+_82649924
|
0.156
|
NM_000307
|
POU3F4
|
POU class 3 homeobox 4
|
|
chr14_-_104507862
|
0.155
|
|
AHNAK2
|
AHNAK nucleoprotein 2
|
|
chr4_-_88669267
|
0.155
|
|
SPARCL1
|
SPARC-like 1 (hevin)
|
|
chr2_-_231697999
|
0.154
|
NM_000867
|
HTR2B
|
5-hydroxytryptamine (serotonin) receptor 2B
|
|
chr12_-_11313907
|
0.153
|
NM_006249
|
PRB3
|
proline-rich protein BstNI subfamily 3
|
|
chr3_-_124822113
|
0.151
|
NM_053031
NM_053032
|
MYLK
|
myosin light chain kinase
|
|
chr17_-_3814334
|
0.148
|
NM_005173
NM_174953
NM_174954
NM_174955
NM_174956
NM_174957
NM_174958
|
ATP2A3
|
ATPase, Ca++ transporting, ubiquitous
|
|
chr14_-_73296643
|
0.145
|
NM_194278
|
C14orf43
|
chromosome 14 open reading frame 43
|
|
chr10_-_29963847
|
0.145
|
|
|
|
|
chr17_-_38385511
|
0.144
|
NM_025267
|
AARSD1
|
alanyl-tRNA synthetase domain containing 1
|
|
chr12_-_90029672
|
0.142
|
NM_002345
|
LUM
|
lumican
|
|
chr3_-_9809357
|
0.133
|
NM_006354
NM_133480
|
TADA3
|
transcriptional adaptor 3
|
|
chr2_-_49235059
|
0.132
|
NM_000145
NM_181446
|
FSHR
|
follicle stimulating hormone receptor
|
|
chr20_-_33783409
|
0.132
|
|
RBM39
|
RNA binding motif protein 39
|
|
chr20_+_2224612
|
0.130
|
NM_003245
|
TGM3
|
transglutaminase 3 (E polypeptide, protein-glutamine-gamma-glutamyltransferase)
|
|
chr11_+_74950893
|
0.129
|
|
SERPINH1
|
serpin peptidase inhibitor, clade H (heat shock protein 47), member 1, (collagen binding protein 1)
|
|
chr5_-_169657360
|
0.128
|
|
LCP2
|
lymphocyte cytosolic protein 2 (SH2 domain containing leukocyte protein of 76kDa)
|
|
chr14_+_95222506
|
0.128
|
NM_004918
NM_199206
|
TCL1B
|
T-cell leukemia/lymphoma 1B
|
|
chr6_+_158322904
|
0.127
|
|
SYNJ2
|
synaptojanin 2
|
|
chr14_-_105163301
|
0.124
|
|
IGHG4
|
immunoglobulin heavy constant gamma 4 (G4m marker)
|
|
chr2_-_96174502
|
0.122
|
|
DUSP2
|
dual specificity phosphatase 2
|
|
chr1_-_35097232
|
0.121
|
NM_001164824
|
C1orf212
|
chromosome 1 open reading frame 212
|
|
chrX_-_68301974
|
0.121
|
NM_001032396
NM_022368
NM_145119
|
PJA1
|
praja ring finger 1
|
|
chr12_+_48784057
|
0.119
|
NM_005276
|
GPD1
|
glycerol-3-phosphate dehydrogenase 1 (soluble)
|
|
chr14_-_105308720
|
0.118
|
|
IGHM
|
immunoglobulin heavy constant mu
|
|
chr17_-_10313600
|
0.118
|
NM_017533
|
MYH4
|
myosin, heavy chain 4, skeletal muscle
|
|
chr7_+_94123556
|
0.117
|
NM_001040152
NM_001184961
NM_001184962
NM_015068
|
PEG10
|
paternally expressed 10
|
|
chr5_-_53642060
|
0.117
|
|
ARL15
|
ADP-ribosylation factor-like 15
|
|
chr2_-_151052391
|
0.117
|
NM_005168
|
RND3
|
Rho family GTPase 3
|
|
chrX_-_151370325
|
0.116
|
NM_000808
|
GABRA3
|
gamma-aminobutyric acid (GABA) A receptor, alpha 3
|
|
chr16_-_67943157
|
0.116
|
NM_144676
|
TMED6
|
transmembrane emp24 protein transport domain containing 6
|
|
chr15_+_72006015
|
0.115
|
|
LOXL1
|
lysyl oxidase-like 1
|
|
chr19_+_2427122
|
0.114
|
NM_015675
|
GADD45B
|
growth arrest and DNA-damage-inducible, beta
|
|
chr2_+_87536174
|
0.114
|
|
NCRNA00152
|
non-protein coding RNA 152
|
|
chr19_-_9646717
|
0.113
|
|
ZNF562
|
zinc finger protein 562
|
|
chr6_+_126282078
|
0.112
|
|
NCOA7
|
nuclear receptor coactivator 7
|
|
chr20_+_60558369
|
0.111
|
|
C20orf166
|
chromosome 20 open reading frame 166
|
|
chr13_-_77447664
|
0.111
|
NM_000115
|
EDNRB
|
endothelin receptor type B
|
|
chr14_-_105280425
|
0.108
|
|
IGHG1
|
immunoglobulin heavy constant gamma 1 (G1m marker)
|
|
chrX_-_142432884
|
0.107
|
NM_001009609
|
SPANXN3
|
SPANX family, member N3
|
|
chr7_+_113842407
|
0.107
|
|
FOXP2
|
forkhead box P2
|
|
chr5_-_178983281
|
0.104
|
NM_005520
|
HNRNPH1
|
heterogeneous nuclear ribonucleoprotein H1 (H)
|
|
chr19_-_9646750
|
0.102
|
NM_001130031
NM_001130032
NM_017656
|
ZNF562
|
zinc finger protein 562
|
|
chr19_-_12653698
|
0.100
|
|
DHPS
|
deoxyhypusine synthase
|
|
chr18_+_9698299
|
0.099
|
|
RAB31
|
RAB31, member RAS oncogene family
|
|
chr7_-_75280962
|
0.097
|
NM_002991
|
CCL24
|
chemokine (C-C motif) ligand 24
|
|
chr10_+_63950212
|
0.097
|
NM_199452
|
ZNF365
|
zinc finger protein 365
|