|
chr1_+_26609893
|
1.667
|
|
LIN28A
|
lin-28 homolog A (C. elegans)
|
|
chr1_+_43661383
|
1.551
|
NM_015284
|
KIAA0467
|
KIAA0467
|
|
chr1_+_26609819
|
1.312
|
NM_024674
|
LIN28A
|
lin-28 homolog A (C. elegans)
|
|
chr9_-_34387786
|
0.985
|
NM_032596
|
C9orf24
|
chromosome 9 open reading frame 24
|
|
chr18_+_30810889
|
0.929
|
NM_001143826
|
MAPRE2
|
microtubule-associated protein, RP/EB family, member 2
|
|
chr4_+_8633116
|
0.925
|
NM_080819
|
GPR78
|
G protein-coupled receptor 78
|
|
chr4_-_66218777
|
0.890
|
|
EPHA5
|
EPH receptor A5
|
|
chr11_-_72063059
|
0.882
|
NM_002599
|
PDE2A
|
phosphodiesterase 2A, cGMP-stimulated
|
|
chr3_+_129690735
|
0.852
|
|
|
|
|
chr3_+_26639300
|
0.843
|
NM_052953
|
LRRC3B
|
leucine rich repeat containing 3B
|
|
chr1_-_47468029
|
0.838
|
NM_003189
|
TAL1
|
T-cell acute lymphocytic leukemia 1
|
|
chr11_+_61204392
|
0.799
|
NM_006133
|
DAGLA
|
diacylglycerol lipase, alpha
|
|
chr12_-_56312696
|
0.798
|
|
B4GALNT1
|
beta-1,4-N-acetyl-galactosaminyl transferase 1
|
|
chr2_-_133144094
|
0.759
|
|
LYPD1
|
LY6/PLAUR domain containing 1
|
|
chr2_+_176761552
|
0.756
|
NM_024501
|
HOXD1
|
homeobox D1
|
|
chr3_+_12020803
|
0.737
|
NM_003178
NM_133625
|
SYN2
|
synapsin II
|
|
chr19_-_51829778
|
0.735
|
NM_033258
|
GNG8
|
guanine nucleotide binding protein (G protein), gamma 8
|
|
chr3_-_173648896
|
0.728
|
NM_004122
NM_198407
|
GHSR
|
growth hormone secretagogue receptor
|
|
chr12_-_3472245
|
0.725
|
|
LOC100129223
|
hypothetical LOC100129223
|
|
chr20_+_8060762
|
0.712
|
NM_015192
NM_182734
|
PLCB1
|
phospholipase C, beta 1 (phosphoinositide-specific)
|
|
chr22_-_31732648
|
0.699
|
NM_003490
NM_133633
|
SYN3
|
synapsin III
|
|
chr16_+_88517187
|
0.693
|
NM_006086
|
TUBB3
|
tubulin, beta 3
|
|
chr3_-_135231518
|
0.679
|
NM_005630
|
SLCO2A1
|
solute carrier organic anion transporter family, member 2A1
|
|
chr4_-_108176901
|
0.675
|
NM_014421
|
DKK2
|
dickkopf homolog 2 (Xenopus laevis)
|
|
chr3_+_127596471
|
0.670
|
NM_182628
|
CCDC37
|
coiled-coil domain containing 37
|
|
chr22_+_23153529
|
0.668
|
NM_000675
|
ADORA2A
|
adenosine A2a receptor
|
|
chr8_+_56177567
|
0.668
|
NM_052898
|
XKR4
|
XK, Kell blood group complex subunit-related family, member 4
|
|
chr5_-_114543632
|
0.661
|
NM_001017397
NM_001017398
NM_018700
|
TRIM36
|
tripartite motif containing 36
|
|
chr3_-_135231417
|
0.658
|
|
SLCO2A1
|
solute carrier organic anion transporter family, member 2A1
|
|
chr2_+_171280182
|
0.657
|
|
|
|
|
chr17_-_10682123
|
0.654
|
NM_001101387
|
PIRT
|
phosphoinositide-interacting regulator of transient receptor potential channels
|
|
chr13_+_34414390
|
0.646
|
NM_015678
|
NBEA
|
neurobeachin
|
|
chr2_+_171280046
|
0.641
|
NM_001003845
|
SP5
|
Sp5 transcription factor
|
|
chr12_-_6626858
|
0.638
|
|
ACRBP
|
acrosin binding protein
|
|
chr4_-_66218247
|
0.634
|
NM_004439
NM_182472
|
EPHA5
|
EPH receptor A5
|
|
chr7_+_70235724
|
0.632
|
NM_022479
|
WBSCR17
|
Williams-Beuren syndrome chromosome region 17
|
|
chr19_+_55398680
|
0.629
|
NM_001077186
NM_001145809
NM_024729
|
MYH14
|
myosin, heavy chain 14, non-muscle
|
|
chr15_+_77362200
|
0.628
|
NM_001146341
|
ANKRD34C
|
ankyrin repeat domain 34C
|
|
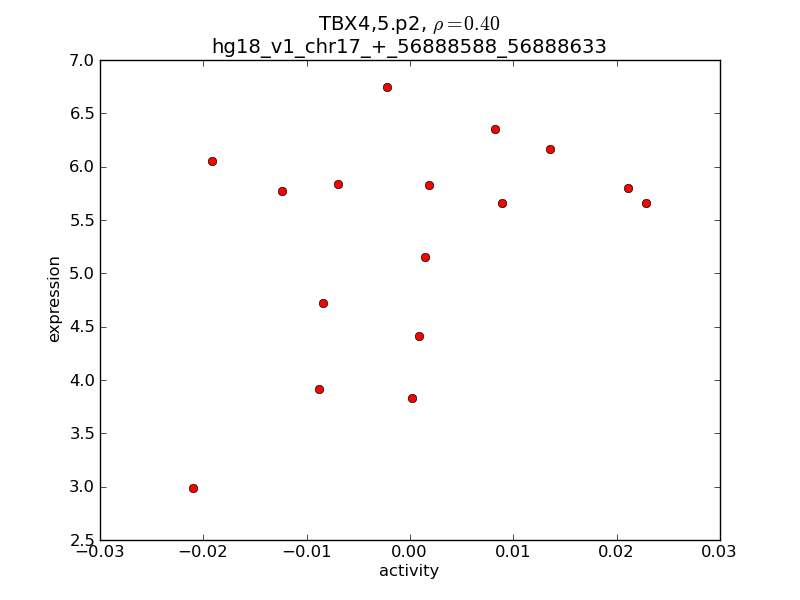
chr17_+_56888588
|
0.627
|
NM_018488
|
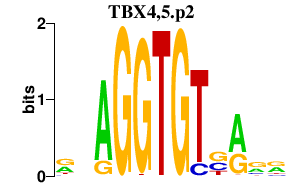
TBX4
|
T-box 4
|
|
chr15_-_71830868
|
0.627
|
NM_001039614
|
C15orf59
|
chromosome 15 open reading frame 59
|
|
chr6_-_71069347
|
0.625
|
NM_001851
|
COL9A1
|
collagen, type IX, alpha 1
|
|
chr12_-_116021473
|
0.619
|
NM_001168325
NM_017899
|
TESC
|
tescalcin
|
|
chr1_+_157441133
|
0.613
|
NM_002036
|
DARC
|
Duffy blood group, chemokine receptor
|
|
chrX_-_142551587
|
0.613
|
NM_001184749
|
SLITRK4
|
SLIT and NTRK-like family, member 4
|
|
chr9_-_103237851
|
0.611
|
NM_000035
|
ALDOB
|
aldolase B, fructose-bisphosphate
|
|
chr4_+_155884600
|
0.594
|
NM_004744
|
LRAT
|
lecithin retinol acyltransferase (phosphatidylcholine--retinol O-acyltransferase)
|
|
chr15_+_72209039
|
0.592
|
NM_001130137
|
ISLR2
|
immunoglobulin superfamily containing leucine-rich repeat 2
|
|
chr1_+_183970093
|
0.590
|
NM_031935
|
HMCN1
|
hemicentin 1
|
|
chr2_+_74594093
|
0.584
|
|
TLX2
|
T-cell leukemia homeobox 2
|
|
chr7_-_123460722
|
0.577
|
NM_001136002
|
TMEM229A
|
transmembrane protein 229A
|
|
chr12_+_70952729
|
0.571
|
NM_013381
|
TRHDE
|
thyrotropin-releasing hormone degrading enzyme
|
|
chr9_+_128416542
|
0.566
|
NM_001174146
NM_001174147
NM_002316
|
LMX1B
|
LIM homeobox transcription factor 1, beta
|
|
chr16_-_1410710
|
0.565
|
|
C16orf91
|
chromosome 16 open reading frame 91
|
|
chr7_-_155019299
|
0.555
|
NM_001103176
|
CNPY1
|
canopy 1 homolog (zebrafish)
|
|
chr12_-_70952410
|
0.552
|
|
LOC283392
|
hypothetical LOC283392
|
|
chr19_+_45794895
|
0.547
|
NM_001042544
|
LTBP4
|
latent transforming growth factor beta binding protein 4
|
|
chr13_+_99432258
|
0.544
|
NM_007129
|
ZIC2
|
Zic family member 2 (odd-paired homolog, Drosophila)
|
|
chr15_+_72208751
|
0.542
|
NM_001130136
|
ISLR2
|
immunoglobulin superfamily containing leucine-rich repeat 2
|
|
chr9_+_139152595
|
0.542
|
|
GRIN1
|
glutamate receptor, ionotropic, N-methyl D-aspartate 1
|
|
chr22_+_25383392
|
0.540
|
|
MIAT
|
myocardial infarction associated transcript (non-protein coding)
|
|
chrX_-_107866262
|
0.535
|
NM_003604
|
IRS4
|
insulin receptor substrate 4
|
|
chr11_+_26310253
|
0.534
|
NM_031418
|
ANO3
|
anoctamin 3
|
|
chr4_+_156900053
|
0.531
|
|
GUCY1B3
|
guanylate cyclase 1, soluble, beta 3
|
|
chr1_-_20122638
|
0.529
|
NM_014589
|
PLA2G2E
|
phospholipase A2, group IIE
|
|
chr5_+_113726203
|
0.523
|
|
KCNN2
|
potassium intermediate/small conductance calcium-activated channel, subfamily N, member 2
|
|
chr11_-_3620060
|
0.521
|
NM_053017
NM_001079536
|
ART5
|
ADP-ribosyltransferase 5
|
|
chr11_-_2108035
|
0.515
|
|
IGF2
|
insulin-like growth factor 2 (somatomedin A)
|
|
chrX_-_48578878
|
0.514
|
NM_013271
|
PCSK1N
|
proprotein convertase subtilisin/kexin type 1 inhibitor
|
|
chr3_+_19164973
|
0.512
|
NM_144633
|
KCNH8
|
potassium voltage-gated channel, subfamily H (eag-related), member 8
|
|
chr19_+_810673
|
0.511
|
|
CFD
|
complement factor D (adipsin)
|
|
chr12_-_70952572
|
0.511
|
|
LOC283392
|
hypothetical LOC283392
|
|
chr19_+_10261646
|
0.507
|
NM_003259
|
ICAM5
|
intercellular adhesion molecule 5, telencephalin
|
|
chr9_+_136912474
|
0.506
|
NM_004108
NM_015837
|
FCN2
|
ficolin (collagen/fibrinogen domain containing lectin) 2 (hucolin)
|
|
chr1_-_36721501
|
0.502
|
NM_000760
NM_156039
NM_172313
|
CSF3R
|
colony stimulating factor 3 receptor (granulocyte)
|
|
chr15_-_93671314
|
0.499
|
|
LOC400456
|
hypothetical LOC400456
|
|
chr16_+_88512769
|
0.495
|
|
MC1R
|
melanocortin 1 receptor (alpha melanocyte stimulating hormone receptor)
|
|
chr11_-_118739838
|
0.488
|
|
USP2
|
ubiquitin specific peptidase 2
|
|
chr11_-_103539895
|
0.485
|
|
PDGFD
|
platelet derived growth factor D
|
|
chr8_+_21968273
|
0.485
|
NM_001114136
NM_001114139
|
EPB49
|
erythrocyte membrane protein band 4.9 (dematin)
|
|
chr5_-_44424423
|
0.483
|
NM_004465
|
FGF10
|
fibroblast growth factor 10
|
|
chr6_+_127481740
|
0.483
|
NM_032784
|
RSPO3
|
R-spondin 3 homolog (Xenopus laevis)
|
|
chr5_-_177355848
|
0.479
|
NM_006261
|
PROP1
|
PROP paired-like homeobox 1
|
|
chr21_-_41801778
|
0.476
|
NM_001135099
|
TMPRSS2
|
transmembrane protease, serine 2
|
|
chr9_+_123501186
|
0.472
|
|
DAB2IP
|
DAB2 interacting protein
|
|
chr11_-_114880275
|
0.471
|
NM_001098517
NM_014333
|
CADM1
|
cell adhesion molecule 1
|
|
chr6_-_32121784
|
0.471
|
NM_032470
|
TNXB
|
tenascin XB
|
|
chr2_+_171280944
|
0.470
|
|
SP5
|
Sp5 transcription factor
|
|
chr12_+_130004404
|
0.469
|
NM_198827
|
GPR133
|
G protein-coupled receptor 133
|
|
chr5_-_134899537
|
0.466
|
NM_006161
|
NEUROG1
|
neurogenin 1
|
|
chr12_-_60872814
|
0.464
|
NM_178539
|
FAM19A2
|
family with sequence similarity 19 (chemokine (C-C motif)-like), member A2
|
|
chr11_+_61279436
|
0.462
|
NM_013279
|
C11orf9
|
chromosome 11 open reading frame 9
|
|
chr5_+_71050745
|
0.456
|
NM_004291
|
CARTPT
|
CART prepropeptide
|
|
chr6_-_40003295
|
0.456
|
NM_005943
|
MOCS1
|
molybdenum cofactor synthesis 1
|
|
chr22_-_27405708
|
0.452
|
NM_001145418
|
TTC28
|
tetratricopeptide repeat domain 28
|
|
chr7_-_150604752
|
0.451
|
NM_001003802
|
SMARCD3
|
SWI/SNF related, matrix associated, actin dependent regulator of chromatin, subfamily d, member 3
|
|
chr5_+_71438796
|
0.450
|
NM_005909
|
MAP1B
|
microtubule-associated protein 1B
|
|
chr19_+_40325993
|
0.450
|
NM_022006
|
FXYD7
|
FXYD domain containing ion transport regulator 7
|
|
chr8_+_21968375
|
0.450
|
|
EPB49
|
erythrocyte membrane protein band 4.9 (dematin)
|
|
chr9_-_72926333
|
0.448
|
NM_001007471
|
TRPM3
|
transient receptor potential cation channel, subfamily M, member 3
|
|
chrX_-_114374860
|
0.446
|
NM_020871
|
LRCH2
|
leucine-rich repeats and calponin homology (CH) domain containing 2
|
|
chr4_-_149582754
|
0.445
|
|
NR3C2
|
nuclear receptor subfamily 3, group C, member 2
|
|
chr1_+_17121012
|
0.444
|
NM_014675
|
CROCC
|
ciliary rootlet coiled-coil, rootletin
|
|
chr8_+_99508425
|
0.442
|
NM_020697
|
KCNS2
|
potassium voltage-gated channel, delayed-rectifier, subfamily S, member 2
|
|
chr12_+_77782925
|
0.440
|
|
SYT1
|
synaptotagmin I
|
|
chr19_-_4468715
|
0.434
|
NM_001080400
|
PLIN4
|
perilipin 4
|
|
chr5_-_83715947
|
0.433
|
|
EDIL3
|
EGF-like repeats and discoidin I-like domains 3
|
|
chr1_+_34415139
|
0.432
|
NM_001134734
|
C1orf94
|
chromosome 1 open reading frame 94
|
|
chr11_+_48303047
|
0.430
|
NM_001004702
|
OR4C3
|
olfactory receptor, family 4, subfamily C, member 3
|
|
chr19_-_54557450
|
0.424
|
NM_003598
|
TEAD2
|
TEA domain family member 2
|
|
chr11_+_131286513
|
0.420
|
|
NTM
|
neurotrimin
|
|
chr7_-_36992221
|
0.417
|
NM_130442
|
ELMO1
|
engulfment and cell motility 1
|
|
chr12_+_117903682
|
0.414
|
NM_194286
|
SRRM4
|
serine/arginine repetitive matrix 4
|
|
chr18_+_58143499
|
0.411
|
NM_003839
|
TNFRSF11A
|
tumor necrosis factor receptor superfamily, member 11a, NFKB activator
|
|
chr11_-_2138984
|
0.409
|
NM_000207
NM_001185097
NM_001185098
NM_001042376
|
INS
INS-IGF2
|
insulin
INS-IGF2 readthrough transcript
|
|
chr15_+_81567327
|
0.409
|
NM_001144903
NM_023003
|
TM6SF1
|
transmembrane 6 superfamily member 1
|
|
chr1_-_11830328
|
0.409
|
NM_006172
|
NPPA
|
natriuretic peptide A
|
|
chr19_+_55571493
|
0.408
|
NM_007121
|
NR1H2
|
nuclear receptor subfamily 1, group H, member 2
|
|
chr5_-_132194122
|
0.404
|
|
|
|
|
chr11_+_122214415
|
0.403
|
NM_019604
|
CRTAM
|
cytotoxic and regulatory T cell molecule
|
|
chr14_-_91403609
|
0.401
|
NM_001128596
|
TC2N
|
tandem C2 domains, nuclear
|
|
chr4_+_3285671
|
0.399
|
NM_002926
NM_198229
|
RGS12
|
regulator of G-protein signaling 12
|
|
chr19_+_810658
|
0.397
|
NM_001928
|
CFD
|
complement factor D (adipsin)
|
|
chr17_-_30440351
|
0.396
|
NM_057178
|
RFFL
|
ring finger and FYVE-like domain containing 1
|
|
chr17_-_33178987
|
0.396
|
|
HNF1B
|
HNF1 homeobox B
|
|
chr19_+_51059357
|
0.395
|
NM_004497
|
FOXA3
|
forkhead box A3
|
|
chr1_+_17719405
|
0.394
|
|
ARHGEF10L
|
Rho guanine nucleotide exchange factor (GEF) 10-like
|
|
chr17_-_28644118
|
0.393
|
NM_183377
|
ACCN1
|
amiloride-sensitive cation channel 1, neuronal
|
|
chr5_-_88016397
|
0.392
|
|
LOC645323
|
hypothetical LOC645323
|
|
chr5_+_113725914
|
0.391
|
NM_021614
|
KCNN2
|
potassium intermediate/small conductance calcium-activated channel, subfamily N, member 2
|
|
chrX_+_101853912
|
0.391
|
NM_001004051
NM_001184874
NM_001184875
NM_001184876
NM_138437
|
GPRASP2
|
G protein-coupled receptor associated sorting protein 2
|
|
chr17_+_31562577
|
0.390
|
NM_207007
NM_001001435
|
CCL4L2
CCL4L1
|
chemokine (C-C motif) ligand 4-like 2
chemokine (C-C motif) ligand 4-like 1
|
|
chr21_-_44784499
|
0.390
|
NM_198691
|
KRTAP10-1
|
keratin associated protein 10-1
|
|
chr3_-_184756101
|
0.389
|
NM_130446
|
KLHL6
|
kelch-like 6 (Drosophila)
|
|
chr2_+_74595073
|
0.382
|
NM_016170
|
TLX2
|
T-cell leukemia homeobox 2
|
|
chr7_-_124192916
|
0.382
|
NM_005302
|
GPR37
|
G protein-coupled receptor 37 (endothelin receptor type B-like)
|
|
chr3_-_51971915
|
0.381
|
NM_033010
|
PCBP4
|
poly(rC) binding protein 4
|
|
chr13_+_112704077
|
0.380
|
|
MCF2L
|
MCF.2 cell line derived transforming sequence-like
|
|
chrX_+_101887562
|
0.377
|
NM_001142529
NM_001142530
|
BHLHB9
|
basic helix-loop-helix domain containing, class B, 9
|
|
chr21_-_44824907
|
0.375
|
NM_198694
|
KRTAP10-5
|
keratin associated protein 10-5
|
|
chr8_+_144428083
|
0.375
|
|
GLI4
|
GLI family zinc finger 4
|
|
chr5_-_172688024
|
0.374
|
|
STC2
|
stanniocalcin 2
|
|
chrX_+_122145776
|
0.372
|
NM_000828
NM_007325
|
GRIA3
|
glutamate receptor, ionotrophic, AMPA 3
|
|
chr18_-_45975163
|
0.370
|
NM_001080467
|
MYO5B
|
myosin VB
|
|
chr9_-_138757175
|
0.369
|
NM_001001712
|
LCN10
|
lipocalin 10
|
|
chr1_-_202595666
|
0.367
|
NM_014935
|
PLEKHA6
|
pleckstrin homology domain containing, family A member 6
|
|
chr1_-_175400441
|
0.365
|
|
ASTN1
|
astrotactin 1
|
|
chr15_+_41879912
|
0.365
|
NM_016400
|
C15orf63
|
chromosome 15 open reading frame 63
|
|
chr17_+_22823151
|
0.364
|
NM_014238
|
KSR1
|
kinase suppressor of ras 1
|
|
chr4_-_165523856
|
0.363
|
NM_001166373
|
MARCH1
|
membrane-associated ring finger (C3HC4) 1
|
|
chr12_-_43556220
|
0.362
|
|
NELL2
|
NEL-like 2 (chicken)
|
|
chr17_+_65612589
|
0.361
|
NM_170742
|
KCNJ16
|
potassium inwardly-rectifying channel, subfamily J, member 16
|
|
chr19_+_15765760
|
0.361
|
NM_001004466
|
OR10H5
|
olfactory receptor, family 10, subfamily H, member 5
|
|
chr13_-_99983945
|
0.360
|
NM_033110
|
A2LD1
|
AIG2-like domain 1
|
|
chr11_-_63138061
|
0.359
|
|
PLA2G16
|
phospholipase A2, group XVI
|
|
chr3_+_134239906
|
0.359
|
|
TMEM108
|
transmembrane protein 108
|
|
chr1_+_166516901
|
0.356
|
NM_005149
|
TBX19
|
T-box 19
|
|
chr8_-_142446546
|
0.355
|
NM_005293
|
GPR20
|
G protein-coupled receptor 20
|
|
chr12_-_56312879
|
0.354
|
|
B4GALNT1
|
beta-1,4-N-acetyl-galactosaminyl transferase 1
|
|
chr3_-_129690056
|
0.350
|
NM_001145661
|
GATA2
|
GATA binding protein 2
|
|
chr22_-_28992787
|
0.350
|
NM_020530
|
OSM
|
oncostatin M
|
|
chr4_+_91035025
|
0.349
|
NM_007351
|
MMRN1
|
multimerin 1
|
|
chr9_+_33740463
|
0.347
|
NM_001197097
NM_007343
NM_001197098
|
PRSS3
|
protease, serine, 3
|
|
chrX_+_101792949
|
0.347
|
NM_001099410
NM_001099411
NM_014710
NM_001184727
|
GPRASP1
|
G protein-coupled receptor associated sorting protein 1
|
|
chr3_+_10832867
|
0.345
|
NM_014229
|
SLC6A11
|
solute carrier family 6 (neurotransmitter transporter, GABA), member 11
|
|
chr12_-_6626794
|
0.344
|
NM_032489
|
ACRBP
|
acrosin binding protein
|
|
chr2_+_176680251
|
0.344
|
NM_021192
|
HOXD11
|
homeobox D11
|
|
chr9_-_115877104
|
0.343
|
|
AMBP
|
alpha-1-microglobulin/bikunin precursor
|
|
chr5_-_134942867
|
0.341
|
NM_004887
|
CXCL14
|
chemokine (C-X-C motif) ligand 14
|
|
chr22_+_36531059
|
0.339
|
NM_005318
|
H1F0
|
H1 histone family, member 0
|
|
chr19_+_10242763
|
0.339
|
|
ICAM1
|
intercellular adhesion molecule 1
|
|
chr9_+_70107602
|
0.339
|
NM_199135
|
FOXD4L3
FOXD4L6
|
forkhead box D4-like 3
forkhead box D4-like 6
|
|
chr4_+_114433551
|
0.338
|
|
ANK2
|
ankyrin 2, neuronal
|
|
chr3_+_134239860
|
0.337
|
NM_001136469
NM_023943
|
TMEM108
|
transmembrane protein 108
|
|
chr6_-_32184975
|
0.335
|
NM_019105
|
TNXB
|
tenascin XB
|
|
chr19_+_40716153
|
0.335
|
NM_014364
|
GAPDHS
|
glyceraldehyde-3-phosphate dehydrogenase, spermatogenic
|
|
chr3_+_135996990
|
0.335
|
|
EPHB1
|
EPH receptor B1
|
|
chr22_+_38213174
|
0.334
|
NM_001098270
|
MGAT3
|
mannosyl (beta-1,4-)-glycoprotein beta-1,4-N-acetylglucosaminyltransferase
|
|
chr10_-_13584950
|
0.334
|
NM_001100912
NM_152751
|
BEND7
|
BEN domain containing 7
|
|
chr19_-_44386731
|
0.333
|
NM_001080468
|
SYCN
|
syncollin
|
|
chr13_+_112704028
|
0.332
|
|
MCF2L
|
MCF.2 cell line derived transforming sequence-like
|
|
chr18_+_75760434
|
0.332
|
|
|
|
|
chr19_+_53559468
|
0.330
|
NM_012451
|
SYNGR4
|
synaptogyrin 4
|
|
chr5_-_132194488
|
0.330
|
NM_001172700
|
SHROOM1
|
shroom family member 1
|
|
chr11_+_129190942
|
0.330
|
NM_138788
|
TMEM45B
|
transmembrane protein 45B
|
|
chr17_-_37222349
|
0.330
|
|
LEPREL4
|
leprecan-like 4
|
|
chr10_-_102978678
|
0.329
|
NM_006562
|
LBX1
|
ladybird homeobox 1
|
|
chr13_-_19244398
|
0.328
|
|
PSPC1
|
paraspeckle component 1
|
|
chr11_-_62445587
|
0.328
|
NM_000738
|
CHRM1
|
cholinergic receptor, muscarinic 1
|
|
chr6_+_97479216
|
0.327
|
NM_052904
|
KLHL32
|
kelch-like 32 (Drosophila)
|
|
chr2_+_170298487
|
0.325
|
|
|
|
|
chr22_-_49363711
|
0.324
|
NM_004377
NM_152246
NM_001145134
NM_001145135
NM_001145136
NM_152245
|
CPT1B
|
carnitine palmitoyltransferase 1B (muscle)
|
|
chr13_+_112704051
|
0.324
|
|
MCF2L
|
MCF.2 cell line derived transforming sequence-like
|
|
chr8_-_22606401
|
0.324
|
|
EGR3
|
early growth response 3
|
|
chr12_-_43556338
|
0.323
|
|
NELL2
|
NEL-like 2 (chicken)
|
|
chr3_+_39826032
|
0.322
|
NM_015460
|
MYRIP
|
myosin VIIA and Rab interacting protein
|
|
chr3_+_52254782
|
0.322
|
|
PPM1M
|
protein phosphatase, Mg2+/Mn2+ dependent, 1M
|
|
chr11_+_125279481
|
0.320
|
NM_013264
|
DDX25
|
DEAD (Asp-Glu-Ala-Asp) box polypeptide 25
|
|
chr11_+_6237541
|
0.318
|
NM_176875
|
CCKBR
|
cholecystokinin B receptor
|
|
chr6_+_42896771
|
0.318
|
NM_015349
|
KIAA0240
|
KIAA0240
|
|
chr1_+_6226838
|
0.316
|
NM_001024598
|
HES3
|
hairy and enhancer of split 3 (Drosophila)
|