|
chr14_+_28306633
|
5.997
|
|
FOXG1
|
forkhead box G1
|
|
chr4_-_174687104
|
4.636
|
|
HAND2
|
heart and neural crest derivatives expressed 2
|
|
chrX_-_107866262
|
4.462
|
NM_003604
|
IRS4
|
insulin receptor substrate 4
|
|
chr14_-_103058568
|
4.080
|
|
CKB
|
creatine kinase, brain
|
|
chr1_-_38285033
|
3.406
|
NM_002699
|
POU3F1
|
POU class 3 homeobox 1
|
|
chr4_-_174686918
|
3.214
|
|
HAND2
|
heart and neural crest derivatives expressed 2
|
|
chr11_-_75056761
|
3.011
|
|
MAP6
|
microtubule-associated protein 6
|
|
chr10_-_95350949
|
2.976
|
NM_006744
|
RBP4
|
retinol binding protein 4, plasma
|
|
chr12_-_42231990
|
2.870
|
NM_025003
|
ADAMTS20
|
ADAM metallopeptidase with thrombospondin type 1 motif, 20
|
|
chr13_-_52320774
|
2.750
|
NM_002590
NM_032949
|
PCDH8
|
protocadherin 8
|
|
chr16_-_47872880
|
2.737
|
|
|
|
|
chr9_+_99656013
|
2.692
|
|
|
|
|
chr19_+_10404110
|
2.589
|
NM_001111309
|
PDE4A
|
phosphodiesterase 4A, cAMP-specific
|
|
chr14_+_100362236
|
2.507
|
|
MEG3
|
maternally expressed 3 (non-protein coding)
|
|
chr8_+_1937711
|
2.504
|
|
KBTBD11
|
kelch repeat and BTB (POZ) domain containing 11
|
|
chr14_+_100362204
|
2.482
|
|
MEG3
|
maternally expressed 3 (non-protein coding)
|
|
chr14_-_103058865
|
2.478
|
NM_001823
|
CKB
|
creatine kinase, brain
|
|
chr11_-_75057062
|
2.475
|
NM_033063
NM_207577
|
MAP6
|
microtubule-associated protein 6
|
|
chr9_+_78824390
|
2.462
|
NM_001013735
|
FOXB2
|
forkhead box B2
|
|
chr3_-_73756668
|
2.334
|
NM_015009
|
PDZRN3
|
PDZ domain containing ring finger 3
|
|
chr16_-_47872973
|
2.331
|
|
CBLN1
|
cerebellin 1 precursor
|
|
chr17_-_72045218
|
2.297
|
NM_134268
|
CYGB
|
cytoglobin
|
|
chr2_+_219991342
|
2.260
|
NM_001927
|
DES
|
desmin
|
|
chr7_-_150737980
|
2.232
|
NM_198285
|
WDR86
|
WD repeat domain 86
|
|
chr20_+_36786540
|
2.174
|
|
SLC32A1
|
solute carrier family 32 (GABA vesicular transporter), member 1
|
|
chr2_+_137239583
|
2.173
|
|
THSD7B
|
thrombospondin, type I, domain containing 7B
|
|
chr7_-_27191287
|
2.146
|
NM_005523
|
HOXA11
|
homeobox A11
|
|
chr20_+_36786518
|
2.098
|
NM_080552
|
SLC32A1
|
solute carrier family 32 (GABA vesicular transporter), member 1
|
|
chr11_-_75057299
|
2.095
|
|
MAP6
|
microtubule-associated protein 6
|
|
chr17_-_25642962
|
2.069
|
NM_000386
|
BLMH
|
bleomycin hydrolase
|
|
chr8_+_31616809
|
2.014
|
NM_013962
|
NRG1
|
neuregulin 1
|
|
chr2_+_15999599
|
1.977
|
|
MYCN
|
v-myc myelocytomatosis viral related oncogene, neuroblastoma derived (avian)
|
|
chr3_+_171619346
|
1.967
|
NM_005602
|
CLDN11
|
claudin 11
|
|
chrX_+_106057984
|
1.947
|
|
CLDN2
|
claudin 2
|
|
chr16_+_54247852
|
1.924
|
NM_001043
NM_001172504
|
SLC6A2
|
solute carrier family 6 (neurotransmitter transporter, noradrenalin), member 2
|
|
chr14_+_100263066
|
1.920
|
|
DLK1
|
delta-like 1 homolog (Drosophila)
|
|
chr3_-_130807865
|
1.911
|
NM_015103
|
PLXND1
|
plexin D1
|
|
chr19_-_51856129
|
1.897
|
NM_145056
|
DACT3
|
dapper, antagonist of beta-catenin, homolog 3 (Xenopus laevis)
|
|
chr6_-_85529884
|
1.884
|
|
TBX18
|
T-box 18
|
|
chr11_+_111288669
|
1.828
|
NM_001541
|
HSPB2-C11ORF52
HSPB2
|
HSPB2-C11orf52 read-through transcript
heat shock 27kDa protein 2
|
|
chr13_+_32488477
|
1.793
|
NM_004795
|
KL
|
klotho
|
|
chr9_-_72673753
|
1.779
|
NM_001007470
NM_020952
NM_024971
NM_206944
NM_206945
NM_206946
NM_206947
NM_206948
|
TRPM3
|
transient receptor potential cation channel, subfamily M, member 3
|
|
chr2_+_96355661
|
1.773
|
NM_178495
NM_001163524
|
ITPRIPL1
|
inositol 1,4,5-triphosphate receptor interacting protein-like 1
|
|
chrX_-_30237403
|
1.747
|
NM_000475
|
NR0B1
|
nuclear receptor subfamily 0, group B, member 1
|
|
chr15_+_58083798
|
1.733
|
|
FOXB1
|
forkhead box B1
|
|
chr5_-_132189762
|
1.728
|
NM_133456
|
SHROOM1
|
shroom family member 1
|
|
chr16_+_54247400
|
1.715
|
|
SLC6A2
|
solute carrier family 6 (neurotransmitter transporter, noradrenalin), member 2
|
|
chr4_+_72271218
|
1.701
|
NM_001098484
NM_001134742
|
SLC4A4
|
solute carrier family 4, sodium bicarbonate cotransporter, member 4
|
|
chr12_+_56140184
|
1.691
|
NM_001160045
NM_001167609
NM_005269
|
GLI1
|
GLI family zinc finger 1
|
|
chr2_+_200031333
|
1.689
|
|
|
|
|
chr11_+_19691397
|
1.676
|
NM_145117
NM_182964
|
NAV2
|
neuron navigator 2
|
|
chr11_+_111288686
|
1.675
|
|
HSPB2-C11ORF52
HSPB2
|
HSPB2-C11orf52 read-through transcript
heat shock 27kDa protein 2
|
|
chrX_+_90576252
|
1.668
|
NM_080832
|
PABPC5
|
poly(A) binding protein, cytoplasmic 5
|
|
chr15_+_58083737
|
1.665
|
|
|
|
|
chr18_-_30057166
|
1.658
|
|
NOL4
|
nucleolar protein 4
|
|
chr22_-_36809094
|
1.656
|
NM_013356
|
SLC16A8
|
solute carrier family 16, member 8 (monocarboxylic acid transporter 3)
|
|
chr4_+_4912272
|
1.643
|
NM_002448
|
MSX1
|
msh homeobox 1
|
|
chr14_+_64077171
|
1.642
|
|
HSPA2
|
heat shock 70kDa protein 2
|
|
chr5_+_71438796
|
1.640
|
NM_005909
|
MAP1B
|
microtubule-associated protein 1B
|
|
chr5_-_577444
|
1.639
|
NM_004174
|
SLC9A3
|
solute carrier family 9 (sodium/hydrogen exchanger), member 3
|
|
chrX_+_72140076
|
1.630
|
NM_001042506
|
PABPC1L2B
|
poly(A) binding protein, cytoplasmic 1-like 2B
|
|
chrX_-_114374860
|
1.604
|
NM_020871
|
LRCH2
|
leucine-rich repeats and calponin homology (CH) domain containing 2
|
|
chr15_+_58083712
|
1.601
|
NM_012182
|
FOXB1
|
forkhead box B1
|
|
chr15_+_72208751
|
1.586
|
NM_001130136
|
ISLR2
|
immunoglobulin superfamily containing leucine-rich repeat 2
|
|
chr18_+_53170718
|
1.583
|
NM_015879
|
ST8SIA3
|
ST8 alpha-N-acetyl-neuraminide alpha-2,8-sialyltransferase 3
|
|
chr16_+_85158357
|
1.582
|
NM_005251
|
FOXC2
|
forkhead box C2 (MFH-1, mesenchyme forkhead 1)
|
|
chr10_-_99780574
|
1.581
|
NM_018058
|
CRTAC1
|
cartilage acidic protein 1
|
|
chrX_+_101792949
|
1.569
|
NM_001099410
NM_001099411
NM_014710
NM_001184727
|
GPRASP1
|
G protein-coupled receptor associated sorting protein 1
|
|
chr7_-_27180398
|
1.564
|
NM_018951
|
HOXA10
|
homeobox A10
|
|
chr8_+_19841209
|
1.563
|
|
LPL
|
lipoprotein lipase
|
|
chr6_-_33268177
|
1.561
|
NM_001163771
NM_080679
NM_080680
NM_080681
|
COL11A2
|
collagen, type XI, alpha 2
|
|
chr17_-_47592159
|
1.549
|
NM_001082533
|
CA10
|
carbonic anhydrase X
|
|
chr2_-_133144094
|
1.530
|
|
LYPD1
|
LY6/PLAUR domain containing 1
|
|
chr5_+_167889123
|
1.516
|
|
|
|
|
chr11_-_132318741
|
1.512
|
|
OPCML
|
opioid binding protein/cell adhesion molecule-like
|
|
chr10_-_62373828
|
1.508
|
NM_014836
|
RHOBTB1
|
Rho-related BTB domain containing 1
|
|
chr7_-_4867963
|
1.504
|
NM_020144
|
PAPOLB
|
poly(A) polymerase beta (testis specific)
|
|
chr9_-_138757175
|
1.491
|
NM_001001712
|
LCN10
|
lipocalin 10
|
|
chr12_-_3732478
|
1.486
|
|
EFCAB4B
|
EF-hand calcium binding domain 4B
|
|
chr3_+_49566901
|
1.482
|
NM_003458
|
BSN
|
bassoon (presynaptic cytomatrix protein)
|
|
chr17_+_56884560
|
1.482
|
|
TBX4
|
T-box 4
|
|
chr3_-_166397142
|
1.479
|
NM_014926
|
SLITRK3
|
SLIT and NTRK-like family, member 3
|
|
chr17_-_47592341
|
1.476
|
NM_001082534
|
CA10
|
carbonic anhydrase X
|
|
chr17_-_47591949
|
1.472
|
|
CA10
|
carbonic anhydrase X
|
|
chr9_-_121171400
|
1.467
|
NM_014618
|
DBC1
|
deleted in bladder cancer 1
|
|
chr2_+_176695658
|
1.457
|
NM_014213
|
HOXD9
|
homeobox D9
|
|
chr15_+_72209039
|
1.446
|
NM_001130137
|
ISLR2
|
immunoglobulin superfamily containing leucine-rich repeat 2
|
|
chr16_+_66244314
|
1.444
|
|
RLTPR
|
RGD motif, leucine rich repeats, tropomodulin domain and proline-rich containing
|
|
chr3_+_63238854
|
1.442
|
NM_001130003
|
SYNPR
|
synaptoporin
|
|
chr17_-_6887965
|
1.430
|
NM_153357
|
SLC16A11
|
solute carrier family 16, member 11 (monocarboxylic acid transporter 11)
|
|
chr14_+_28305922
|
1.424
|
NM_005249
|
FOXG1
|
forkhead box G1
|
|
chr1_-_39877883
|
1.422
|
|
HEYL
|
hairy/enhancer-of-split related with YRPW motif-like
|
|
chr2_+_15999396
|
1.415
|
|
MYCN
|
v-myc myelocytomatosis viral related oncogene, neuroblastoma derived (avian)
|
|
chr3_+_134601479
|
1.413
|
NM_003571
|
BFSP2
|
beaded filament structural protein 2, phakinin
|
|
chr18_-_30057512
|
1.405
|
NM_001198546
NM_001198548
NM_003787
|
NOL4
|
nucleolar protein 4
|
|
chr21_+_33364420
|
1.403
|
|
OLIG1
|
oligodendrocyte transcription factor 1
|
|
chr1_+_11674365
|
1.403
|
NM_198545
|
C1orf187
|
chromosome 1 open reading frame 187
|
|
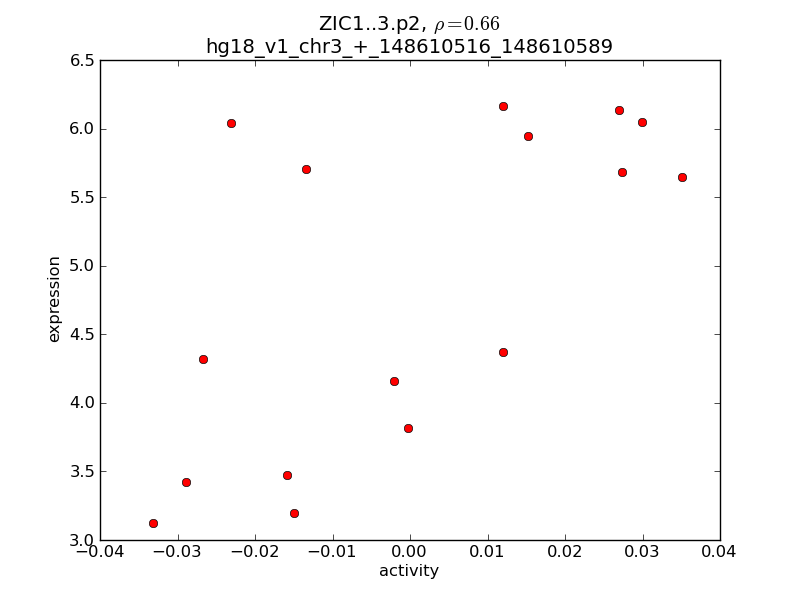
chr3_+_148610516
|
1.402
|
|
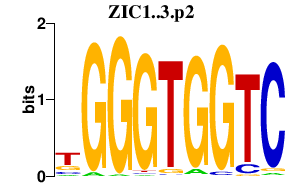
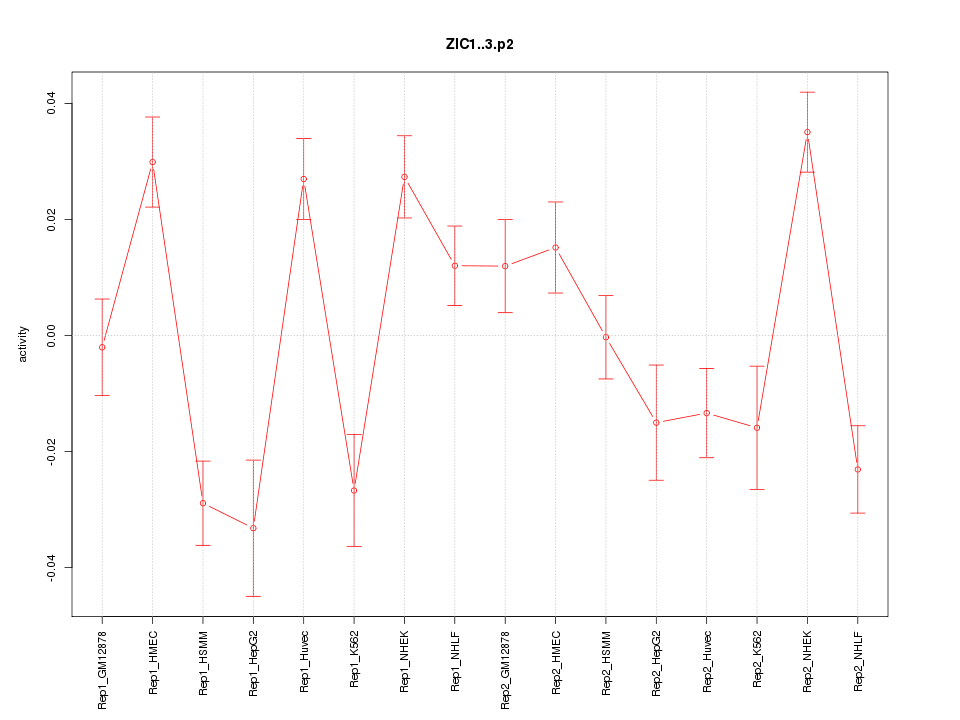
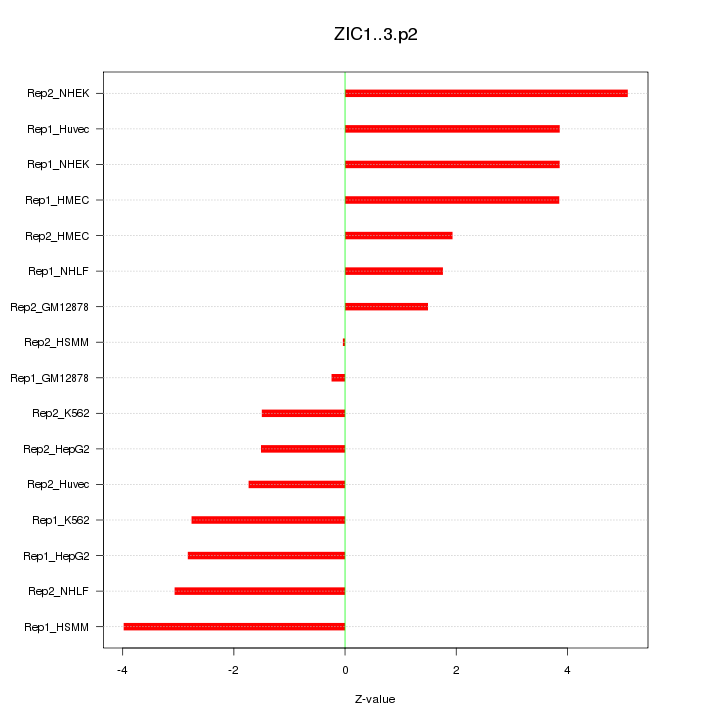
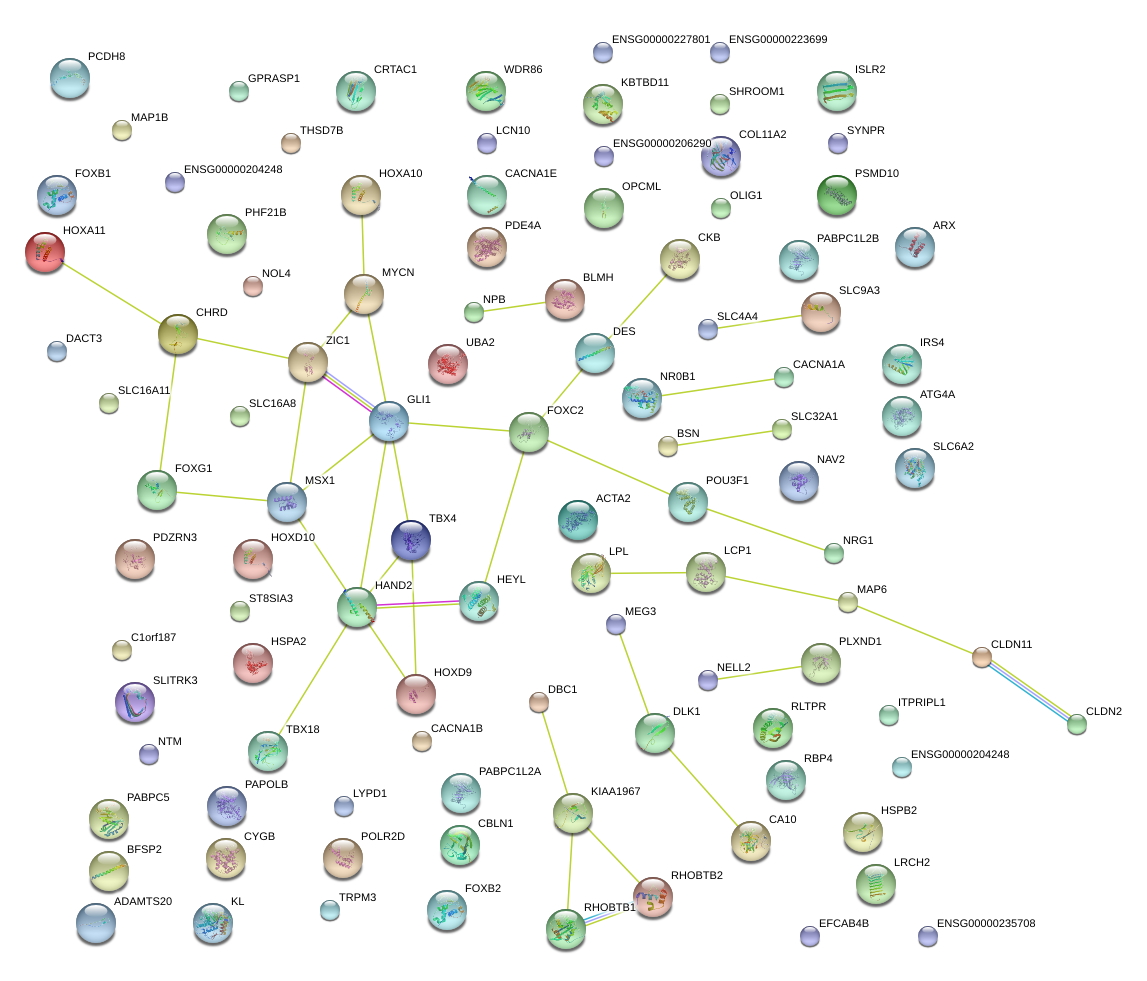
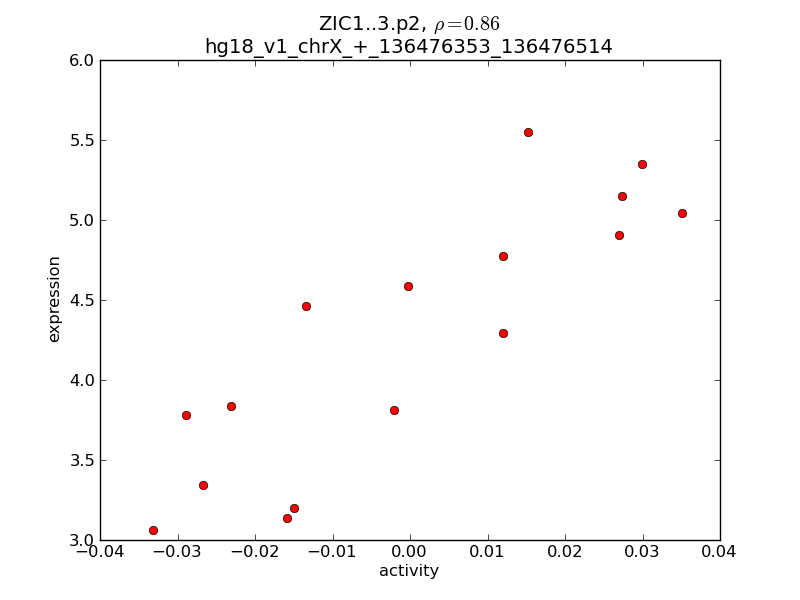
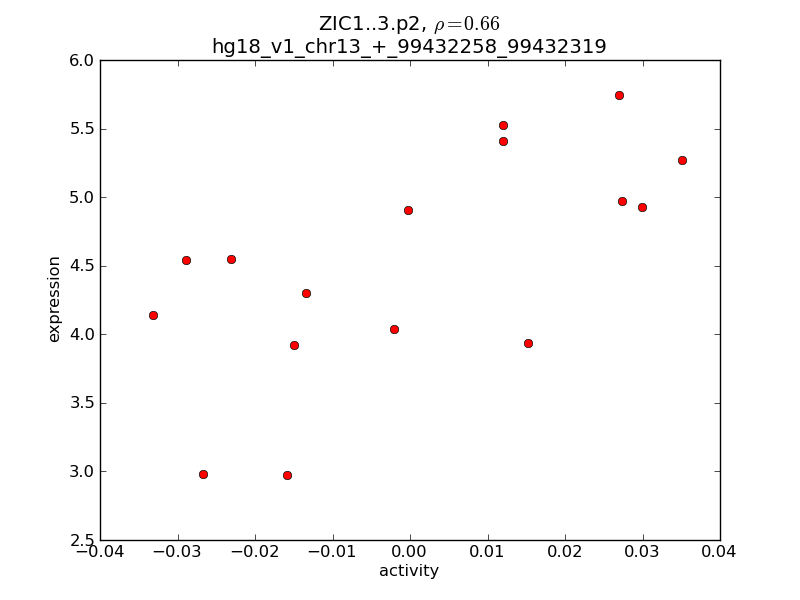
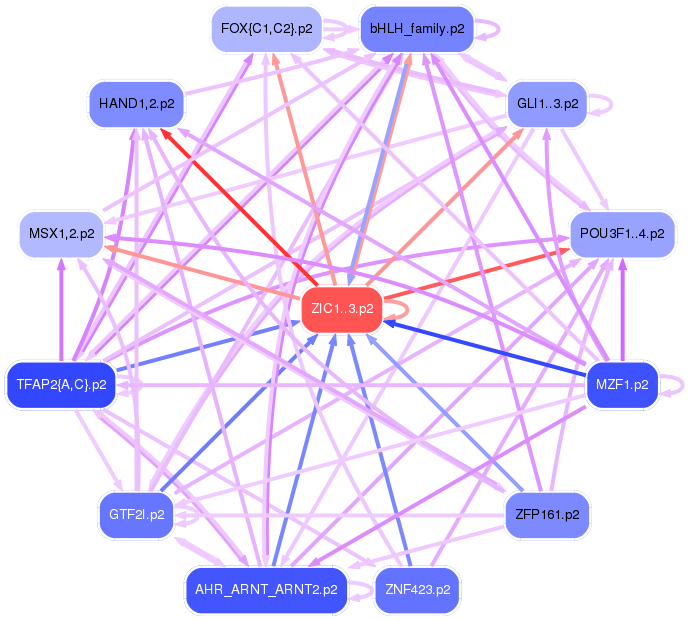
ZIC1
|
Zic family member 1 (odd-paired homolog, Drosophila)
|
|
chrX_-_24941098
|
1.395
|
|
ARX
|
aristaless related homeobox
|
|
chr3_+_185580554
|
1.388
|
NM_003741
|
CHRD
|
chordin
|
|
chr14_+_100270222
|
1.386
|
|
DLK1
|
delta-like 1 homolog (Drosophila)
|
|
chr22_-_43783449
|
1.383
|
|
PHF21B
|
PHD finger protein 21B
|
|
chrX_-_107221405
|
1.374
|
NM_002814
NM_170750
|
PSMD10
|
proteasome (prosome, macropain) 26S subunit, non-ATPase, 10
|
|
chrX_+_107221552
|
1.359
|
NM_052936
NM_178270
|
ATG4A
|
ATG4 autophagy related 4 homolog A (S. cerevisiae)
|
|
chr12_-_43556220
|
1.354
|
|
NELL2
|
NEL-like 2 (chicken)
|
|
chr19_-_13478037
|
1.354
|
NM_000068
NM_001127221
NM_001127222
NM_001174080
NM_023035
|
CACNA1A
|
calcium channel, voltage-dependent, P/Q type, alpha 1A subunit
|
|
chr1_-_39877928
|
1.342
|
NM_014571
|
HEYL
|
hairy/enhancer-of-split related with YRPW motif-like
|
|
chr17_-_47591691
|
1.334
|
|
CA10
|
carbonic anhydrase X
|
|
chr12_-_3732614
|
1.333
|
NM_001144958
NM_001144959
NM_032680
|
EFCAB4B
|
EF-hand calcium binding domain 4B
|
|
chr14_-_50631407
|
1.329
|
|
TRIM9
|
tripartite motif containing 9
|
|
chr17_+_56832492
|
1.325
|
|
TBX2
|
T-box 2
|
|
chr8_-_132122016
|
1.324
|
NM_001115
|
ADCY8
|
adenylate cyclase 8 (brain)
|
|
chr8_+_19841120
|
1.323
|
|
LPL
|
lipoprotein lipase
|
|
chr3_+_3816079
|
1.319
|
NM_020873
|
LRRN1
|
leucine rich repeat neuronal 1
|
|
chr19_+_19510098
|
1.311
|
|
CILP2
|
cartilage intermediate layer protein 2
|
|
chr1_-_29321599
|
1.308
|
NM_001171868
|
TMEM200B
|
transmembrane protein 200B
|
|
chr5_-_83715947
|
1.308
|
|
EDIL3
|
EGF-like repeats and discoidin I-like domains 3
|
|
chr1_-_90955365
|
1.293
|
NM_020063
|
BARHL2
|
BarH-like homeobox 2
|
|
chrX_+_101853912
|
1.288
|
NM_001004051
NM_001184874
NM_001184875
NM_001184876
NM_138437
|
GPRASP2
|
G protein-coupled receptor associated sorting protein 2
|
|
chr12_-_43556338
|
1.286
|
|
NELL2
|
NEL-like 2 (chicken)
|
|
chr13_-_24643620
|
1.279
|
|
FAM123A
|
family with sequence similarity 123A
|
|
chr6_+_101948102
|
1.278
|
|
|
|
|
chr4_+_156808261
|
1.258
|
NM_001130684
|
GUCY1A3
|
guanylate cyclase 1, soluble, alpha 3
|
|
chr2_-_144991386
|
1.253
|
|
ZEB2
|
zinc finger E-box binding homeobox 2
|
|
chr11_-_126375864
|
1.250
|
|
KIRREL3
|
kin of IRRE like 3 (Drosophila)
|
|
chr16_+_65840275
|
1.244
|
NM_004594
|
SLC9A5
|
solute carrier family 9 (sodium/hydrogen exchanger), member 5
|
|
chr12_+_79625538
|
1.244
|
NM_002469
|
MYF6
|
myogenic factor 6 (herculin)
|
|
chr17_+_70244945
|
1.241
|
NM_001006638
NM_001163990
|
RAB37
|
RAB37, member RAS oncogene family
|
|
chr22_-_42589543
|
1.236
|
NM_014351
|
SULT4A1
|
sulfotransferase family 4A, member 1
|
|
chr19_+_19510056
|
1.236
|
NM_153221
|
CILP2
|
cartilage intermediate layer protein 2
|
|
chr5_-_174803768
|
1.232
|
NM_000794
|
DRD1
|
dopamine receptor D1
|
|
chr15_+_39573363
|
1.225
|
NM_002220
|
ITPKA
|
inositol 1,4,5-trisphosphate 3-kinase A
|
|
chr20_-_22512893
|
1.218
|
|
FOXA2
|
forkhead box A2
|
|
chr11_+_122806196
|
1.214
|
|
LOC100128242
|
hypothetical LOC100128242
|
|
chrX_-_134013644
|
1.213
|
NM_001078172
NM_001134321
|
FAM127B
|
family with sequence similarity 127, member B
|
|
chr9_+_135389698
|
1.212
|
NM_014694
|
ADAMTSL2
|
ADAMTS-like 2
|
|
chr7_+_44110470
|
1.209
|
NM_001129
|
AEBP1
|
AE binding protein 1
|
|
chr11_-_67163600
|
1.196
|
NM_005995
|
TBX10
|
T-box 10
|
|
chr8_+_19841010
|
1.194
|
|
LPL
|
lipoprotein lipase
|
|
chr7_-_150306169
|
1.192
|
|
KCNH2
|
potassium voltage-gated channel, subfamily H (eag-related), member 2
|
|
chr3_+_53504070
|
1.184
|
NM_000720
NM_001128839
NM_001128840
|
CACNA1D
|
calcium channel, voltage-dependent, L type, alpha 1D subunit
|
|
chr12_+_5411534
|
1.177
|
NM_001102654
|
NTF3
|
neurotrophin 3
|
|
chr6_+_72653126
|
1.171
|
|
RIMS1
|
regulating synaptic membrane exocytosis 1
|
|
chr2_+_74595073
|
1.169
|
NM_016170
|
TLX2
|
T-cell leukemia homeobox 2
|
|
chrX_-_20044670
|
1.166
|
NM_001168467
|
MAP7D2
|
MAP7 domain containing 2
|
|
chrX_-_53367246
|
1.160
|
NM_001111125
|
IQSEC2
|
IQ motif and Sec7 domain 2
|
|
chrX_-_13866565
|
1.158
|
NM_001001994
|
GPM6B
|
glycoprotein M6B
|
|
chr12_-_56312696
|
1.158
|
|
B4GALNT1
|
beta-1,4-N-acetyl-galactosaminyl transferase 1
|
|
chr2_-_74580173
|
1.157
|
|
LBX2
|
ladybird homeobox 2
|
|
chr11_-_32413486
|
1.153
|
|
WT1
|
Wilms tumor 1
|
|
chr22_-_17891777
|
1.151
|
|
CLDN5
|
claudin 5
|
|
chr5_-_44424423
|
1.140
|
NM_004465
|
FGF10
|
fibroblast growth factor 10
|
|
chr2_-_27339278
|
1.138
|
NM_003459
|
SLC30A3
|
solute carrier family 30 (zinc transporter), member 3
|
|
chr9_-_35948150
|
1.137
|
NM_019897
|
OR2S2
|
olfactory receptor, family 2, subfamily S, member 2
|
|
chr12_-_131256525
|
1.136
|
NM_021808
|
GALNT9
|
UDP-N-acetyl-alpha-D-galactosamine:polypeptide N-acetylgalactosaminyltransferase 9 (GalNAc-T9)
|
|
chr19_-_11452439
|
1.135
|
NM_001420
NM_032281
|
ELAVL3
|
ELAV (embryonic lethal, abnormal vision, Drosophila)-like 3 (Hu antigen C)
|
|
chr20_-_22514092
|
1.133
|
NM_153675
|
FOXA2
|
forkhead box A2
|
|
chr8_+_1909437
|
1.128
|
NM_014867
|
KBTBD11
|
kelch repeat and BTB (POZ) domain containing 11
|
|
chr16_+_1979959
|
1.126
|
NM_004209
|
SYNGR3
|
synaptogyrin 3
|
|
chr17_+_70244553
|
1.124
|
NM_001163989
|
RAB37
|
RAB37, member RAS oncogene family
|
|
chr11_+_67871999
|
1.124
|
|
LRP5
|
low density lipoprotein receptor-related protein 5
|
|
chr4_-_5940893
|
1.121
|
|
CRMP1
|
collapsin response mediator protein 1
|
|
chr3_+_112273464
|
1.119
|
NM_015480
|
PVRL3
|
poliovirus receptor-related 3
|
|
chr11_-_2115086
|
1.118
|
|
IGF2
|
insulin-like growth factor 2 (somatomedin A)
|
|
chr7_+_68702252
|
1.118
|
|
AUTS2
|
autism susceptibility candidate 2
|
|
chr16_-_265868
|
1.113
|
NM_003834
NM_183337
|
RGS11
|
regulator of G-protein signaling 11
|
|
chr17_+_42686217
|
1.111
|
|
ITGB3
|
integrin, beta 3 (platelet glycoprotein IIIa, antigen CD61)
|
|
chr14_+_101097440
|
1.107
|
NM_001362
|
DIO3
|
deiodinase, iodothyronine, type III
|
|
chr21_+_33364316
|
1.104
|
NM_138983
|
OLIG1
|
oligodendrocyte transcription factor 1
|
|
chr20_-_1922393
|
1.102
|
NM_001190900
|
PDYN
|
prodynorphin
|
|
chr12_-_80676562
|
1.099
|
|
PPFIA2
|
protein tyrosine phosphatase, receptor type, f polypeptide (PTPRF), interacting protein (liprin), alpha 2
|
|
chr2_-_51112743
|
1.095
|
|
NRXN1
|
neurexin 1
|
|
chr6_+_99389318
|
1.095
|
|
POU3F2
|
POU class 3 homeobox 2
|
|
chr1_+_168899936
|
1.084
|
NM_006902
NM_022716
|
PRRX1
|
paired related homeobox 1
|
|
chr11_+_43920385
|
1.078
|
NM_001145033
|
C11orf96
|
chromosome 11 open reading frame 96
|
|
chr1_-_111018798
|
1.078
|
|
KCNA3
|
potassium voltage-gated channel, shaker-related subfamily, member 3
|
|
chr9_+_831689
|
1.077
|
NM_021951
|
DMRT1
|
doublesex and mab-3 related transcription factor 1
|
|
chr3_+_112273352
|
1.074
|
|
PVRL3
|
poliovirus receptor-related 3
|
|
chr11_-_289518
|
1.072
|
NM_001025295
|
IFITM5
|
interferon induced transmembrane protein 5
|
|
chrX_-_13866366
|
1.069
|
|
|
|
|
chr10_-_132999973
|
1.067
|
NM_174937
|
TCERG1L
|
transcription elongation regulator 1-like
|
|
chr13_-_24643778
|
1.066
|
NM_152704
NM_199138
|
FAM123A
|
family with sequence similarity 123A
|
|
chr7_+_44110527
|
1.064
|
|
AEBP1
|
AE binding protein 1
|
|
chr11_-_27697768
|
1.062
|
NM_001143807
|
BDNF
|
brain-derived neurotrophic factor
|
|
chr18_-_68685789
|
1.062
|
NM_138966
|
NETO1
|
neuropilin (NRP) and tolloid (TLL)-like 1
|
|
chr12_-_21985433
|
1.051
|
|
ABCC9
|
ATP-binding cassette, sub-family C (CFTR/MRP), member 9
|
|
chr6_+_19946591
|
1.051
|
|
|
|
|
chr5_+_170779664
|
1.048
|
|
FGF18
|
fibroblast growth factor 18
|
|
chr16_+_30952382
|
1.048
|
NM_004604
|
STX4
|
syntaxin 4
|
|
chr9_+_130909926
|
1.046
|
|
|
|
|
chr6_-_166502119
|
1.043
|
NM_003181
|
T
|
T, brachyury homolog (mouse)
|
|
chr22_-_29231597
|
1.042
|
NM_001161368
NM_174977
|
SEC14L4
|
SEC14-like 4 (S. cerevisiae)
|
|
chr14_+_100262916
|
1.042
|
|
DLK1
|
delta-like 1 homolog (Drosophila)
|
|
chr9_-_103289154
|
1.042
|
NM_032342
|
C9orf125
|
chromosome 9 open reading frame 125
|
|
chr22_-_17892001
|
1.039
|
|
CLDN5
|
claudin 5
|
|
chr15_-_39593285
|
1.037
|
NM_001135685
NM_002344
NM_206961
|
LTK
|
leukocyte receptor tyrosine kinase
|
|
chr5_+_176170041
|
1.035
|
NM_133369
|
UNC5A
|
unc-5 homolog A (C. elegans)
|
|
chr2_-_192767844
|
1.032
|
NM_016192
|
TMEFF2
|
transmembrane protein with EGF-like and two follistatin-like domains 2
|
|
chr12_+_117903682
|
1.029
|
NM_194286
|
SRRM4
|
serine/arginine repetitive matrix 4
|
|
chr4_+_156807311
|
1.026
|
NM_000856
NM_001130682
NM_001130686
NM_001130687
NM_001130683
NM_001130685
|
GUCY1A3
|
guanylate cyclase 1, soluble, alpha 3
|