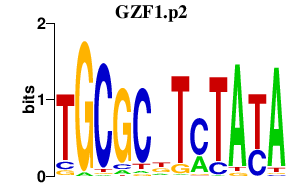
|
chr3_-_87122958
|
3.430
|
|
VGLL3
|
vestigial like 3 (Drosophila)
|
|
chr3_-_87122936
|
3.113
|
NM_016206
|
VGLL3
|
vestigial like 3 (Drosophila)
|
|
chr1_+_22107137
|
2.960
|
|
RPL21
|
ribosomal protein L21
|
|
chr1_-_143706265
|
1.011
|
|
PDE4DIP
|
phosphodiesterase 4D interacting protein
|
|
chr18_-_12647736
|
0.707
|
|
SPIRE1
|
spire homolog 1 (Drosophila)
|
|
chr9_+_130173418
|
0.699
|
NM_001135947
NM_030914
|
URM1
|
ubiquitin related modifier 1
|
|
chr14_-_51605515
|
0.671
|
|
NID2
|
nidogen 2 (osteonidogen)
|
|
chr1_+_26479030
|
0.661
|
|
SH3BGRL3
|
SH3 domain binding glutamic acid-rich protein like 3
|
|
chr14_+_100362236
|
0.651
|
|
MEG3
|
maternally expressed 3 (non-protein coding)
|
|
chr18_-_12647911
|
0.642
|
NM_001128626
NM_020148
|
SPIRE1
|
spire homolog 1 (Drosophila)
|
|
chr14_+_100362204
|
0.626
|
|
MEG3
|
maternally expressed 3 (non-protein coding)
|
|
chr1_+_216585298
|
0.607
|
NM_001135599
NM_003238
|
TGFB2
|
transforming growth factor, beta 2
|
|
chr1_+_26479167
|
0.553
|
|
SH3BGRL3
|
SH3 domain binding glutamic acid-rich protein like 3
|
|
chr1_+_26479208
|
0.545
|
|
SH3BGRL3
|
SH3 domain binding glutamic acid-rich protein like 3
|
|
chr1_-_143706196
|
0.523
|
|
PDE4DIP
|
phosphodiesterase 4D interacting protein
|
|
chr9_+_130173458
|
0.503
|
|
URM1
|
ubiquitin related modifier 1
|
|
chr1_-_2447848
|
0.459
|
NM_018216
|
PANK4
|
pantothenate kinase 4
|
|
chr7_-_27149750
|
0.442
|
NM_019102
|
HOXA5
|
homeobox A5
|
|
chr1_-_224441023
|
0.433
|
|
ACBD3
|
acyl-CoA binding domain containing 3
|
|
chr12_+_56406296
|
0.425
|
|
LOC100130776
|
hypothetical LOC100130776
|
|
chr1_+_26479173
|
0.420
|
|
SH3BGRL3
|
SH3 domain binding glutamic acid-rich protein like 3
|
|
chr18_+_12648191
|
0.392
|
|
|
|
|
chr1_-_224441024
|
0.391
|
NM_022735
|
ACBD3
|
acyl-CoA binding domain containing 3
|
|
chr10_-_103869923
|
0.335
|
NM_001113407
|
LDB1
|
LIM domain binding 1
|
|
chr1_-_1283770
|
0.304
|
NM_032348
|
MXRA8
|
matrix-remodelling associated 8
|
|
chr3_+_30623376
|
0.255
|
|
TGFBR2
|
transforming growth factor, beta receptor II (70/80kDa)
|
|
chr14_-_51605487
|
0.231
|
|
NID2
|
nidogen 2 (osteonidogen)
|
|
chr17_+_3515217
|
0.178
|
|
RPL21
|
ribosomal protein L21
|
|
chr11_+_93917214
|
0.134
|
|
FUT4
|
fucosyltransferase 4 (alpha (1,3) fucosyltransferase, myeloid-specific)
|
|
chrX_-_153686890
|
0.130
|
|
MPP1
|
membrane protein, palmitoylated 1, 55kDa
|
|
chr10_+_59698891
|
0.124
|
NM_018464
|
CISD1
|
CDGSH iron sulfur domain 1
|
|
chr6_+_116798791
|
0.118
|
NM_013352
|
DSE
|
dermatan sulfate epimerase
|
|
chrX_-_153686818
|
0.117
|
|
MPP1
|
membrane protein, palmitoylated 1, 55kDa
|
|
chr18_-_5882102
|
0.107
|
NM_001080209
|
TMEM200C
|
transmembrane protein 200C
|
|
chr16_+_86194075
|
0.093
|
|
JPH3
|
junctophilin 3
|
|
chr19_-_41237138
|
0.087
|
|
THAP8
|
THAP domain containing 8
|
|
chr12_+_102982365
|
0.086
|
NM_013320
|
HCFC2
|
host cell factor C2
|
|
chr3_+_30622905
|
0.073
|
NM_001024847
NM_003242
|
TGFBR2
|
transforming growth factor, beta receptor II (70/80kDa)
|
|
chr8_+_12914143
|
0.071
|
NM_001099677
|
KIAA1456
|
KIAA1456
|
|
chr22_-_16127520
|
0.066
|
|
CECR3
|
cat eye syndrome chromosome region, candidate 3
|
|
chr19_-_9074981
|
0.064
|
NM_001005193
|
OR7G2
|
olfactory receptor, family 7, subfamily G, member 2
|
|
chr6_+_30632641
|
0.057
|
|
PRR3
|
proline rich 3
|
|
chr19_-_10287673
|
0.052
|
NM_001031734
|
FDX1L
|
ferredoxin 1-like
|
|
chr7_-_6713066
|
0.046
|
NM_006956
NM_016265
|
ZNF12
|
zinc finger protein 12
|
|
chr5_+_170747543
|
0.039
|
|
NPM1
|
nucleophosmin (nucleolar phosphoprotein B23, numatrin)
|
|
chr7_+_6713228
|
0.038
|
|
|
|
|
chr20_+_41519947
|
0.016
|
|
SRSF6
|
serine/arginine-rich splicing factor 6
|
|
chr3_+_113763561
|
0.014
|
NM_017945
|
SLC35A5
|
solute carrier family 35, member A5
|


