|
chr8_-_122722674
|
8.781
|
NM_005328
|
HAS2
|
hyaluronan synthase 2
|
|
chr11_+_101488380
|
8.105
|
NM_001195045
|
YAP1
|
Yes-associated protein 1
|
|
chr3_-_55489973
|
6.243
|
|
WNT5A
|
wingless-type MMTV integration site family, member 5A
|
|
chr10_-_21847126
|
6.242
|
|
|
|
|
chr1_+_168898898
|
5.950
|
|
PRRX1
|
paired related homeobox 1
|
|
chr7_-_27149750
|
5.371
|
NM_019102
|
HOXA5
|
homeobox A5
|
|
chr7_-_41709191
|
5.320
|
NM_002192
|
INHBA
|
inhibin, beta A
|
|
chr10_+_24795446
|
5.198
|
|
KIAA1217
|
KIAA1217
|
|
chr7_-_83662152
|
5.124
|
NM_006080
|
SEMA3A
|
sema domain, immunoglobulin domain (Ig), short basic domain, secreted, (semaphorin) 3A
|
|
chr10_+_24795465
|
5.043
|
|
KIAA1217
|
KIAA1217
|
|
chr21_-_34820916
|
4.746
|
NM_203418
|
RCAN1
|
regulator of calcineurin 1
|
|
chr14_+_51025604
|
4.746
|
NM_001042481
|
FRMD6
|
FERM domain containing 6
|
|
chr9_-_116920232
|
4.461
|
NM_002160
|
TNC
|
tenascin C
|
|
chr7_+_134226727
|
4.399
|
|
CALD1
|
caldesmon 1
|
|
chr10_+_69539255
|
4.267
|
NM_032578
|
MYPN
|
myopalladin
|
|
chr7_-_27108826
|
4.262
|
NM_006735
|
HOXA2
|
homeobox A2
|
|
chr2_-_164300758
|
4.260
|
NM_018086
|
FIGN
|
fidgetin
|
|
chr18_-_44723116
|
4.175
|
NM_001190823
|
SMAD7
|
SMAD family member 7
|
|
chr2_+_66516196
|
4.014
|
|
MEIS1
|
Meis homeobox 1
|
|
chr18_+_30544193
|
3.950
|
NM_001198941
NM_032978
|
DTNA
|
dystrobrevin, alpha
|
|
chr3_-_64186151
|
3.941
|
NM_198859
|
PRICKLE2
|
prickle homolog 2 (Drosophila)
|
|
chr3_-_11585264
|
3.873
|
NM_001128221
|
VGLL4
|
vestigial like 4 (Drosophila)
|
|
chr16_+_85169615
|
3.811
|
NM_005250
|
FOXL1
|
forkhead box L1
|
|
chr20_+_19903778
|
3.792
|
|
RIN2
|
Ras and Rab interactor 2
|
|
chr3_-_115825742
|
3.696
|
NM_001164347
|
ZBTB20
|
zinc finger and BTB domain containing 20
|
|
chr1_-_27604656
|
3.692
|
|
WASF2
|
WAS protein family, member 2
|
|
chr7_-_5429702
|
3.600
|
NM_001080495
|
TNRC18
|
trinucleotide repeat containing 18
|
|
chr10_-_33663305
|
3.580
|
|
NRP1
|
neuropilin 1
|
|
chr9_+_108665168
|
3.550
|
NM_021224
|
ZNF462
|
zinc finger protein 462
|
|
chr3_-_115960807
|
3.523
|
NM_001164344
NM_001164345
|
ZBTB20
|
zinc finger and BTB domain containing 20
|
|
chr7_-_27171600
|
3.510
|
|
HOXA9
|
homeobox A9
|
|
chr3_-_188946168
|
3.489
|
NM_001706
|
BCL6
|
B-cell CLL/lymphoma 6
|
|
chr1_-_20682541
|
3.482
|
|
|
|
|
chr12_-_88270128
|
3.405
|
|
DUSP6
|
dual specificity phosphatase 6
|
|
chr12_-_88270375
|
3.404
|
NM_001946
NM_022652
|
DUSP6
|
dual specificity phosphatase 6
|
|
chr18_+_30812205
|
3.402
|
NM_001143827
|
MAPRE2
|
microtubule-associated protein, RP/EB family, member 2
|
|
chr6_+_21701942
|
3.375
|
NM_003107
|
SOX4
|
SRY (sex determining region Y)-box 4
|
|
chr10_-_29963906
|
3.344
|
NM_021738
|
SVIL
|
supervillin
|
|
chr9_+_674193
|
3.341
|
|
|
|
|
chr5_+_59819761
|
3.341
|
|
PART1
|
prostate androgen-regulated transcript 1 (non-protein coding)
|
|
chr7_-_27171648
|
3.281
|
|
HOXA9
|
homeobox A9
|
|
chr8_-_49996353
|
3.248
|
NM_003068
|
SNAI2
|
snail homolog 2 (Drosophila)
|
|
chr12_-_88270369
|
3.200
|
|
DUSP6
|
dual specificity phosphatase 6
|
|
chr2_+_33213111
|
3.195
|
NM_000627
NM_001166264
NM_001166265
NM_001166266
|
LTBP1
|
latent transforming growth factor beta binding protein 1
|
|
chr12_+_88268845
|
3.177
|
|
LOC100131490
|
hypothetical LOC100131490
|
|
chr2_-_200033445
|
3.139
|
|
SATB2
|
SATB homeobox 2
|
|
chr16_+_7322751
|
3.122
|
NM_145891
NM_145892
NM_145893
|
RBFOX1
|
RNA binding protein, fox-1 homolog (C. elegans) 1
|
|
chr7_+_134226690
|
3.114
|
NM_033139
NM_033140
|
CALD1
|
caldesmon 1
|
|
chr15_-_31147376
|
3.091
|
NM_001103184
|
FMN1
|
formin 1
|
|
chr5_+_36642424
|
3.026
|
|
SLC1A3
|
solute carrier family 1 (glial high affinity glutamate transporter), member 3
|
|
chr3_-_150578148
|
2.927
|
|
TM4SF1
|
transmembrane 4 L six family member 1
|
|
chr5_-_59819642
|
2.922
|
NM_001165899
|
PDE4D
|
phosphodiesterase 4D, cAMP-specific
|
|
chr7_-_112513379
|
2.849
|
NM_001146266
NM_001146267
|
GPR85
|
G protein-coupled receptor 85
|
|
chr7_-_27171673
|
2.843
|
NM_152739
|
HOXA9
|
homeobox A9
|
|
chr6_+_136214495
|
2.837
|
NM_018945
|
PDE7B
|
phosphodiesterase 7B
|
|
chr20_-_10602139
|
2.835
|
|
JAG1
|
jagged 1
|
|
chr3_-_150578207
|
2.816
|
NM_014220
|
TM4SF1
|
transmembrane 4 L six family member 1
|
|
chr11_-_85107569
|
2.807
|
NM_206929
|
SYTL2
|
synaptotagmin-like 2
|
|
chr3_-_150578103
|
2.762
|
|
TM4SF1
|
transmembrane 4 L six family member 1
|
|
chr17_-_44026321
|
2.675
|
|
HOXB5
|
homeobox B5
|
|
chr10_-_92671005
|
2.663
|
NM_014391
|
ANKRD1
|
ankyrin repeat domain 1 (cardiac muscle)
|
|
chr12_+_79625538
|
2.653
|
NM_002469
|
MYF6
|
myogenic factor 6 (herculin)
|
|
chr2_+_170074457
|
2.645
|
NM_006063
|
KBTBD10
|
kelch repeat and BTB (POZ) domain containing 10
|
|
chr4_+_81325447
|
2.645
|
NM_020226
|
PRDM8
|
PR domain containing 8
|
|
chr13_+_100902942
|
2.607
|
NM_004791
|
ITGBL1
|
integrin, beta-like 1 (with EGF-like repeat domains)
|
|
chr17_-_44026042
|
2.596
|
NM_002147
|
HOXB5
|
homeobox B5
|
|
chr9_+_117955890
|
2.536
|
NM_002581
|
PAPPA
|
pregnancy-associated plasma protein A, pappalysin 1
|
|
chr4_-_87989291
|
2.530
|
NM_197965
|
SLC10A6
|
solute carrier family 10 (sodium/bile acid cotransporter family), member 6
|
|
chr13_-_101852028
|
2.527
|
NM_175929
|
FGF14
|
fibroblast growth factor 14
|
|
chr1_+_46151845
|
2.523
|
|
MAST2
|
microtubule associated serine/threonine kinase 2
|
|
chr3_-_21767819
|
2.519
|
NM_024697
|
ZNF385D
|
zinc finger protein 385D
|
|
chr21_+_29439768
|
2.512
|
|
C21orf7
|
chromosome 21 open reading frame 7
|
|
chr6_-_116488458
|
2.510
|
NM_002031
|
FRK
|
fyn-related kinase
|
|
chr5_+_36642213
|
2.490
|
NM_001166696
NM_004172
|
SLC1A3
|
solute carrier family 1 (glial high affinity glutamate transporter), member 3
|
|
chr10_+_86174665
|
2.490
|
|
FAM190B
|
family with sequence similarity 190, member B
|
|
chr15_+_55298908
|
2.488
|
NM_207040
|
TCF12
|
transcription factor 12
|
|
chr20_-_10602429
|
2.447
|
NM_000214
|
JAG1
|
jagged 1
|
|
chr1_-_85816520
|
2.444
|
NM_001134445
|
DDAH1
|
dimethylarginine dimethylaminohydrolase 1
|
|
chr6_-_152744022
|
2.434
|
|
SYNE1
|
spectrin repeat containing, nuclear envelope 1
|
|
chr10_+_111755715
|
2.432
|
NM_019903
|
ADD3
|
adducin 3 (gamma)
|
|
chr2_+_66516020
|
2.429
|
NM_002398
|
MEIS1
|
Meis homeobox 1
|
|
chr7_+_134114912
|
2.419
|
|
CALD1
|
caldesmon 1
|
|
chr2_-_151052391
|
2.399
|
NM_005168
|
RND3
|
Rho family GTPase 3
|
|
chr5_+_174084137
|
2.387
|
NM_002449
|
MSX2
|
msh homeobox 2
|
|
chr21_+_39117064
|
2.382
|
|
ETS2
|
v-ets erythroblastosis virus E26 oncogene homolog 2 (avian)
|
|
chr22_-_34566210
|
2.348
|
|
RBFOX2
|
RNA binding protein, fox-1 homolog (C. elegans) 2
|
|
chr10_-_29963847
|
2.335
|
|
|
|
|
chr3_-_55490401
|
2.334
|
|
WNT5A
|
wingless-type MMTV integration site family, member 5A
|
|
chr3_+_158637273
|
2.297
|
NM_002852
|
PTX3
|
pentraxin 3, long
|
|
chr2_-_160764819
|
2.285
|
NM_000888
|
ITGB6
|
integrin, beta 6
|
|
chr14_+_85069217
|
2.272
|
|
|
|
|
chr4_+_183302105
|
2.252
|
|
ODZ3
|
odz, odd Oz/ten-m homolog 3 (Drosophila)
|
|
chr11_-_85108030
|
2.225
|
NM_001162952
NM_206930
|
SYTL2
|
synaptotagmin-like 2
|
|
chr21_-_35181956
|
2.204
|
|
RUNX1
|
runt-related transcription factor 1
|
|
chr7_+_134114701
|
2.200
|
NM_004342
NM_033138
NM_033157
|
CALD1
|
caldesmon 1
|
|
chr3_+_161040439
|
2.185
|
|
SCHIP1
|
schwannomin interacting protein 1
|
|
chr22_-_34566276
|
2.167
|
|
RBFOX2
|
RNA binding protein, fox-1 homolog (C. elegans) 2
|
|
chr8_+_77756077
|
2.163
|
|
ZFHX4
|
zinc finger homeobox 4
|
|
chr3_-_55490442
|
2.156
|
|
WNT5A
|
wingless-type MMTV integration site family, member 5A
|
|
chr6_+_144649142
|
2.154
|
|
UTRN
|
utrophin
|
|
chr3_-_64647325
|
2.144
|
|
ADAMTS9
|
ADAM metallopeptidase with thrombospondin type 1 motif, 9
|
|
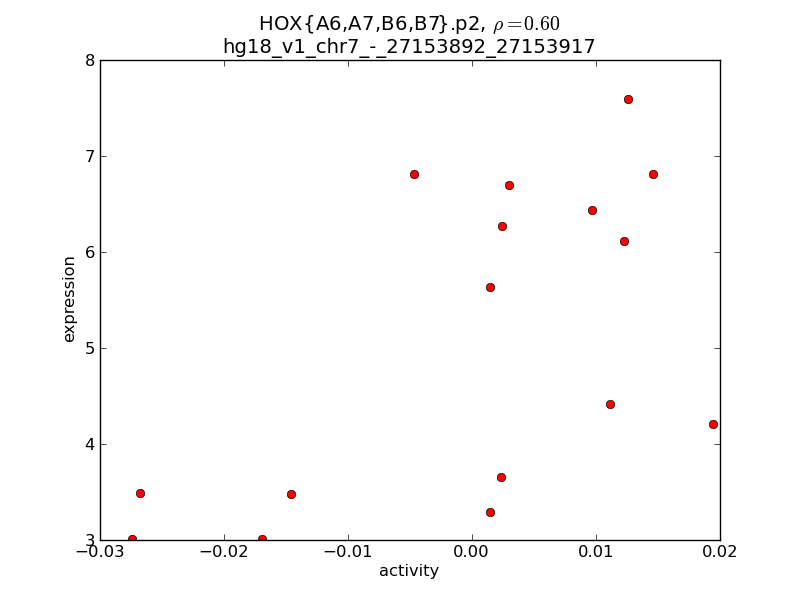
chr7_-_27153892
|
2.134
|
NM_024014
|
HOXA6
|
homeobox A6
|
|
chr6_-_138862273
|
2.110
|
|
|
|
|
chr12_-_28016182
|
2.105
|
NM_002820
NM_198965
|
PTHLH
|
parathyroid hormone-like hormone
|
|
chr19_+_12995782
|
2.090
|
|
NFIX
|
nuclear factor I/X (CCAAT-binding transcription factor)
|
|
chr3_+_69998064
|
2.088
|
NM_198177
|
MITF
|
microphthalmia-associated transcription factor
|
|
chr4_+_160408447
|
2.082
|
NM_014247
|
RAPGEF2
|
Rap guanine nucleotide exchange factor (GEF) 2
|
|
chr6_-_138935359
|
2.080
|
NM_020464
|
NHSL1
|
NHS-like 1
|
|
chrX_-_19598912
|
2.078
|
NM_001184960
|
SH3KBP1
|
SH3-domain kinase binding protein 1
|
|
chr11_-_128567302
|
2.067
|
NM_001142685
|
ARHGAP32
|
Rho GTPase activating protein 32
|
|
chr12_+_52696908
|
2.060
|
NM_014620
NM_153693
|
HOXC4
HOXC6
|
homeobox C4
homeobox C6
|
|
chr17_+_36515166
|
2.033
|
NM_001146041
|
KRTAP4-9
|
keratin associated protein 4-9
|
|
chr4_-_152366970
|
2.025
|
NM_001009555
NM_001128923
|
SH3D19
|
SH3 domain containing 19
|
|
chrX_+_85404626
|
2.012
|
NM_001139515
|
DACH2
|
dachshund homolog 2 (Drosophila)
|
|
chr5_+_66160359
|
2.011
|
NM_015183
|
MAST4
|
microtubule associated serine/threonine kinase family member 4
|
|
chr3_-_150578023
|
2.010
|
|
TM4SF1
|
transmembrane 4 L six family member 1
|
|
chr14_-_60185659
|
2.007
|
NM_005982
|
SIX1
|
SIX homeobox 1
|
|
chr20_-_14266200
|
1.988
|
NM_013281
NM_198391
|
FLRT3
|
fibronectin leucine rich transmembrane protein 3
|
|
chr3_+_69895310
|
1.983
|
NM_001184967
|
MITF
|
microphthalmia-associated transcription factor
|
|
chr9_-_14076901
|
1.980
|
|
NFIB
|
nuclear factor I/B
|
|
chr8_+_77756061
|
1.976
|
NM_024721
|
ZFHX4
|
zinc finger homeobox 4
|
|
chr5_+_155686333
|
1.975
|
NM_000337
NM_001128209
NM_172244
|
SGCD
|
sarcoglycan, delta (35kDa dystrophin-associated glycoprotein)
|
|
chr1_-_191422346
|
1.950
|
NM_003783
|
B3GALT2
|
UDP-Gal:betaGlcNAc beta 1,3-galactosyltransferase, polypeptide 2
|
|
chr2_-_207738858
|
1.934
|
NM_003709
|
KLF7
|
Kruppel-like factor 7 (ubiquitous)
|
|
chr12_+_52697160
|
1.916
|
|
HOXC5
HOXC6
|
homeobox C5
homeobox C6
|
|
chr2_+_66519949
|
1.905
|
|
MEIS1
|
Meis homeobox 1
|
|
chr16_-_71650034
|
1.904
|
NM_001164766
|
ZFHX3
|
zinc finger homeobox 3
|
|
chr22_-_34566367
|
1.900
|
NM_001031695
NM_001082576
NM_001082577
NM_014309
|
RBFOX2
|
RNA binding protein, fox-1 homolog (C. elegans) 2
|
|
chr6_-_56615544
|
1.880
|
NM_001723
NM_015548
|
DST
|
dystonin
|
|
chr3_-_110155237
|
1.879
|
NM_005459
|
GUCA1C
|
guanylate cyclase activator 1C
|
|
chr11_-_56951628
|
1.871
|
NM_017611
|
SLC43A3
|
solute carrier family 43, member 3
|
|
chr12_-_88269884
|
1.844
|
|
DUSP6
|
dual specificity phosphatase 6
|
|
chr12_-_89922875
|
1.836
|
|
EPYC
|
epiphycan
|
|
chr15_+_60838053
|
1.835
|
|
TLN2
|
talin 2
|
|
chr7_-_27120015
|
1.823
|
|
HOXA3
|
homeobox A3
|
|
chr2_-_98646367
|
1.817
|
NM_001160154
|
MGAT4A
|
mannosyl (alpha-1,3-)-glycoprotein beta-1,4-N-acetylglucosaminyltransferase, isozyme A
|
|
chr9_+_102380156
|
1.797
|
NM_001018116
|
MURC
|
muscle-related coiled-coil protein
|
|
chr7_-_107667728
|
1.790
|
NM_001037132
|
NRCAM
|
neuronal cell adhesion molecule
|
|
chr18_+_3437607
|
1.787
|
NM_173207
|
TGIF1
|
TGFB-induced factor homeobox 1
|
|
chr7_-_27136876
|
1.784
|
NM_002141
|
HOXA4
|
homeobox A4
|
|
chr11_+_34599227
|
1.783
|
|
EHF
|
ets homologous factor
|
|
chr18_+_27281729
|
1.779
|
NM_001944
|
DSG3
|
desmoglein 3
|
|
chr7_+_134114957
|
1.774
|
|
CALD1
|
caldesmon 1
|
|
chr11_+_34599163
|
1.767
|
NM_012153
|
EHF
|
ets homologous factor
|
|
chr4_-_141293572
|
1.764
|
|
MAML3
|
mastermind-like 3 (Drosophila)
|
|
chr3_-_11598829
|
1.756
|
NM_001128220
|
VGLL4
|
vestigial like 4 (Drosophila)
|
|
chr21_-_35343065
|
1.749
|
|
RUNX1
|
runt-related transcription factor 1
|
|
chr6_-_101018271
|
1.744
|
NM_005068
|
SIM1
|
single-minded homolog 1 (Drosophila)
|
|
chr3_-_139315011
|
1.706
|
NM_001170538
|
DZIP1L
|
DAZ interacting protein 1-like
|
|
chr3_-_188945921
|
1.702
|
|
BCL6
|
B-cell CLL/lymphoma 6
|
|
chr9_+_12764988
|
1.698
|
NM_203403
|
C9orf150
|
chromosome 9 open reading frame 150
|
|
chr15_-_53996597
|
1.698
|
NM_198400
|
NEDD4
|
neural precursor cell expressed, developmentally down-regulated 4
|
|
chr8_+_70541631
|
1.684
|
|
SULF1
|
sulfatase 1
|
|
chr12_+_118100977
|
1.677
|
NM_014365
|
HSPB8
|
heat shock 22kDa protein 8
|
|
chr13_-_43908937
|
1.675
|
|
TSC22D1
|
TSC22 domain family, member 1
|
|
chr11_+_131285747
|
1.659
|
NM_001144058
NM_001144059
NM_016522
|
NTM
|
neurotrimin
|
|
chrX_+_135106578
|
1.654
|
NM_001159701
NM_001159699
|
FHL1
|
four and a half LIM domains 1
|
|
chr6_-_10520264
|
1.647
|
|
TFAP2A
|
transcription factor AP-2 alpha (activating enhancer binding protein 2 alpha)
|
|
chrX_-_15593074
|
1.646
|
NM_020665
|
TMEM27
|
transmembrane protein 27
|
|
chr4_+_3341521
|
1.644
|
NM_198227
|
RGS12
|
regulator of G-protein signaling 12
|
|
chr12_-_16321885
|
1.635
|
NM_001170798
|
SLC15A5
|
solute carrier family 15, member 5
|
|
chr5_-_1935764
|
1.633
|
NM_016358
|
IRX4
|
iroquois homeobox 4
|
|
chr7_-_112514990
|
1.613
|
|
GPR85
|
G protein-coupled receptor 85
|
|
chr1_+_67923331
|
1.608
|
NM_001924
|
GADD45A
|
growth arrest and DNA-damage-inducible, alpha
|
|
chr14_+_99555471
|
1.601
|
|
EVL
|
Enah/Vasp-like
|
|
chr4_+_54790020
|
1.597
|
NM_006206
|
PDGFRA
|
platelet-derived growth factor receptor, alpha polypeptide
|
|
chr8_-_10550026
|
1.590
|
NM_178857
|
RP1L1
|
retinitis pigmentosa 1-like 1
|
|
chr3_+_25445071
|
1.582
|
|
RARB
|
retinoic acid receptor, beta
|
|
chr2_-_189752575
|
1.560
|
NM_000393
|
COL5A2
|
collagen, type V, alpha 2
|
|
chr16_-_30983909
|
1.557
|
NM_001172669
NM_001172670
|
ZNF668
|
zinc finger protein 668
|
|
chr8_-_93176819
|
1.547
|
|
RUNX1T1
|
runt-related transcription factor 1; translocated to, 1 (cyclin D-related)
|
|
chr3_+_157877146
|
1.538
|
NM_001184718
|
TIPARP
|
TCDD-inducible poly(ADP-ribose) polymerase
|
|
chr10_+_52420936
|
1.533
|
NM_001098512
|
PRKG1
|
protein kinase, cGMP-dependent, type I
|
|
chr10_-_76831142
|
1.529
|
|
ZNF503
|
zinc finger protein 503
|
|
chr2_-_190635566
|
1.528
|
NM_005259
|
MSTN
|
myostatin
|
|
chr16_+_24696069
|
1.523
|
|
TNRC6A
|
trinucleotide repeat containing 6A
|
|
chr2_-_162808123
|
1.522
|
NM_004460
|
FAP
|
fibroblast activation protein, alpha
|
|
chr8_-_93176618
|
1.505
|
NM_001198629
NM_001198630
NM_001198632
NM_175635
|
RUNX1T1
|
runt-related transcription factor 1; translocated to, 1 (cyclin D-related)
|
|
chr16_+_81218142
|
1.497
|
|
CDH13
|
cadherin 13, H-cadherin (heart)
|
|
chr12_-_89922888
|
1.488
|
NM_004950
|
EPYC
|
epiphycan
|
|
chr4_+_74488947
|
1.483
|
|
ALB
|
albumin
|
|
chr22_-_28972683
|
1.477
|
NM_002309
|
LIF
|
leukemia inhibitory factor (cholinergic differentiation factor)
|
|
chr1_+_213245507
|
1.470
|
NM_001017424
|
KCNK2
|
potassium channel, subfamily K, member 2
|
|
chr5_-_59100091
|
1.461
|
|
PDE4D
|
phosphodiesterase 4D, cAMP-specific
|
|
chr10_-_116434364
|
1.460
|
NM_001003407
NM_001003408
|
ABLIM1
|
actin binding LIM protein 1
|
|
chr3_-_71262426
|
1.457
|
|
FOXP1
|
forkhead box P1
|
|
chr8_-_13416554
|
1.457
|
NM_024767
NM_182643
|
DLC1
|
deleted in liver cancer 1
|
|
chr10_-_92670764
|
1.436
|
|
ANKRD1
|
ankyrin repeat domain 1 (cardiac muscle)
|
|
chr4_+_54790190
|
1.436
|
|
PDGFRA
|
platelet-derived growth factor receptor, alpha polypeptide
|
|
chr6_+_130381408
|
1.434
|
NM_001007102
NM_032438
|
L3MBTL3
|
l(3)mbt-like 3 (Drosophila)
|
|
chr5_+_92944680
|
1.431
|
NM_005654
|
NR2F1
|
nuclear receptor subfamily 2, group F, member 1
|
|
chr12_+_40117751
|
1.429
|
NM_013377
|
PDZRN4
|
PDZ domain containing ring finger 4
|
|
chr12_-_13139848
|
1.425
|
NM_031289
NM_153823
|
GSG1
|
germ cell associated 1
|
|
chr7_-_112515035
|
1.421
|
|
GPR85
|
G protein-coupled receptor 85
|
|
chr11_-_85115105
|
1.417
|
NM_206927
NM_206928
|
SYTL2
|
synaptotagmin-like 2
|
|
chr6_-_10523424
|
1.398
|
NM_003220
|
TFAP2A
|
transcription factor AP-2 alpha (activating enhancer binding protein 2 alpha)
|
|
chr6_-_10520592
|
1.396
|
NM_001032280
|
TFAP2A
|
transcription factor AP-2 alpha (activating enhancer binding protein 2 alpha)
|
|
chr5_-_56814310
|
1.393
|
NM_001017992
|
ACTBL2
|
actin, beta-like 2
|
|
chr9_-_14304036
|
1.393
|
NM_001190737
NM_005596
|
NFIB
|
nuclear factor I/B
|
|
chrX_+_135079461
|
1.390
|
NM_001167819
|
FHL1
|
four and a half LIM domains 1
|