|
chr16_-_66535923
|
3.490
|
|
SLC12A4
|
solute carrier family 12 (potassium/chloride transporters), member 4
|
|
chr9_+_136673464
|
2.806
|
NM_000093
|
COL5A1
|
collagen, type V, alpha 1
|
|
chr3_-_130761967
|
2.658
|
|
PLXND1
|
plexin D1
|
|
chr16_-_66535457
|
2.465
|
NM_000229
|
LCAT
|
lecithin-cholesterol acyltransferase
|
|
chr17_+_1580504
|
2.446
|
|
WDR81
|
WD repeat domain 81
|
|
chr16_+_31132842
|
2.411
|
NM_001008274
|
TRIM72
|
tripartite motif containing 72
|
|
chr2_+_85834111
|
2.194
|
NM_032827
|
ATOH8
|
atonal homolog 8 (Drosophila)
|
|
chr7_+_149699185
|
1.939
|
NM_014374
|
REPIN1
|
replication initiator 1
|
|
chrX_+_152699616
|
1.910
|
NM_001170760
NM_001170761
NM_014370
|
SRPK3
|
SRSF protein kinase 3
|
|
chr9_+_136673534
|
1.888
|
|
COL5A1
|
collagen, type V, alpha 1
|
|
chr15_+_38550451
|
1.830
|
NM_130468
|
CHST14
|
carbohydrate (N-acetylgalactosamine 4-0) sulfotransferase 14
|
|
chr5_+_34692239
|
1.807
|
|
RAI14
|
retinoic acid induced 14
|
|
chr16_+_82490230
|
1.735
|
NM_012213
|
MLYCD
|
malonyl-CoA decarboxylase
|
|
chr7_-_27180398
|
1.706
|
NM_018951
|
HOXA10
|
homeobox A10
|
|
chr16_+_27320983
|
1.696
|
NM_181078
NM_181079
|
IL21R
|
interleukin 21 receptor
|
|
chr13_-_110365336
|
1.661
|
|
ANKRD10
|
ankyrin repeat domain 10
|
|
chr5_+_34692352
|
1.651
|
NM_001145520
|
RAI14
|
retinoic acid induced 14
|
|
chr4_+_2783764
|
1.610
|
|
SH3BP2
|
SH3-domain binding protein 2
|
|
chr2_-_219791902
|
1.590
|
NM_005689
|
ABCB6
|
ATP-binding cassette, sub-family B (MDR/TAP), member 6
|
|
chr7_-_75206152
|
1.576
|
|
HIP1
|
huntingtin interacting protein 1
|
|
chr11_-_118716244
|
1.549
|
|
MFRP
|
membrane frizzled-related protein
|
|
chr2_-_219791638
|
1.516
|
|
ABCB6
|
ATP-binding cassette, sub-family B (MDR/TAP), member 6
|
|
chr11_+_116575249
|
1.502
|
NM_001001522
NM_003186
|
TAGLN
|
transgelin
|
|
chr2_-_220144254
|
1.501
|
|
OBSL1
|
obscurin-like 1
|
|
chr20_-_3713509
|
1.496
|
|
CENPB
|
centromere protein B, 80kDa
|
|
chr17_+_1612092
|
1.488
|
|
SERPINF1
|
serpin peptidase inhibitor, clade F (alpha-2 antiplasmin, pigment epithelium derived factor), member 1
|
|
chr7_-_75206212
|
1.478
|
NM_005338
|
HIP1
|
huntingtin interacting protein 1
|
|
chr5_+_155686333
|
1.444
|
NM_000337
NM_001128209
NM_172244
|
SGCD
|
sarcoglycan, delta (35kDa dystrophin-associated glycoprotein)
|
|
chr17_+_35853177
|
1.404
|
NM_001552
|
IGFBP4
|
insulin-like growth factor binding protein 4
|
|
chr5_+_34692124
|
1.391
|
NM_001145522
NM_015577
|
RAI14
|
retinoic acid induced 14
|
|
chr20_+_30409649
|
1.389
|
NM_001164603
NM_015338
|
ASXL1
|
additional sex combs like 1 (Drosophila)
|
|
chr12_-_79855580
|
1.385
|
|
LIN7A
|
lin-7 homolog A (C. elegans)
|
|
chr1_-_201411533
|
1.355
|
NM_004997
|
MYBPH
|
myosin binding protein H
|
|
chr10_+_76256305
|
1.353
|
NM_012330
|
MYST4
|
MYST histone acetyltransferase (monocytic leukemia) 4
|
|
chr1_+_168899936
|
1.351
|
NM_006902
NM_022716
|
PRRX1
|
paired related homeobox 1
|
|
chr2_+_170074457
|
1.344
|
NM_006063
|
KBTBD10
|
kelch repeat and BTB (POZ) domain containing 10
|
|
chr9_+_139292094
|
1.340
|
NM_017723
|
C9orf167
|
chromosome 9 open reading frame 167
|
|
chr17_+_1612056
|
1.301
|
|
SERPINF1
|
serpin peptidase inhibitor, clade F (alpha-2 antiplasmin, pigment epithelium derived factor), member 1
|
|
chr19_-_50688310
|
1.298
|
NM_206901
|
RTN2
|
reticulon 2
|
|
chr17_-_44026042
|
1.290
|
NM_002147
|
HOXB5
|
homeobox B5
|
|
chr17_-_45620911
|
1.278
|
|
COL1A1
|
collagen, type I, alpha 1
|
|
chr12_+_56135353
|
1.236
|
NM_031479
|
INHBE
|
inhibin, beta E
|
|
chr17_-_44026321
|
1.232
|
|
HOXB5
|
homeobox B5
|
|
chr12_-_79855618
|
1.221
|
NM_004664
|
LIN7A
|
lin-7 homolog A (C. elegans)
|
|
chr5_-_81082614
|
1.218
|
|
SSBP2
|
single-stranded DNA binding protein 2
|
|
chr17_+_1612031
|
1.212
|
|
SERPINF1
|
serpin peptidase inhibitor, clade F (alpha-2 antiplasmin, pigment epithelium derived factor), member 1
|
|
chr19_+_40322231
|
1.208
|
NM_005031
|
FXYD1
|
FXYD domain containing ion transport regulator 1
|
|
chr6_+_116939500
|
1.189
|
NM_153711
|
FAM26E
|
family with sequence similarity 26, member E
|
|
chr15_-_80123935
|
1.184
|
|
MEX3B
|
mex-3 homolog B (C. elegans)
|
|
chr16_-_71639670
|
1.171
|
NM_006885
|
ZFHX3
|
zinc finger homeobox 3
|
|
chr1_+_26671488
|
1.170
|
NM_005517
|
HMGN2
|
high-mobility group nucleosomal binding domain 2
|
|
chr10_+_94439658
|
1.166
|
NM_002729
|
HHEX
|
hematopoietically expressed homeobox
|
|
chr3_+_49033621
|
1.164
|
NM_199073
|
NDUFAF3
|
NADH dehydrogenase (ubiquinone) 1 alpha subcomplex, assembly factor 3
|
|
chr10_-_105410840
|
1.164
|
|
|
|
|
chr17_-_35331435
|
1.139
|
|
ORMDL3
|
ORM1-like 3 (S. cerevisiae)
|
|
chr12_+_79625538
|
1.130
|
NM_002469
|
MYF6
|
myogenic factor 6 (herculin)
|
|
chr19_-_46504831
|
1.124
|
|
|
|
|
chr5_-_81082699
|
1.117
|
NM_012446
|
SSBP2
|
single-stranded DNA binding protein 2
|
|
chr2_-_220144427
|
1.107
|
|
OBSL1
|
obscurin-like 1
|
|
chr1_+_26895108
|
1.107
|
NM_006015
NM_139135
|
ARID1A
|
AT rich interactive domain 1A (SWI-like)
|
|
chr4_-_111777651
|
1.104
|
|
PITX2
|
paired-like homeodomain 2
|
|
chr19_-_11169457
|
1.096
|
|
KANK2
|
KN motif and ankyrin repeat domains 2
|
|
chr15_-_72952648
|
1.094
|
NM_005697
|
SCAMP2
|
secretory carrier membrane protein 2
|
|
chr4_-_111777584
|
1.076
|
|
PITX2
|
paired-like homeodomain 2
|
|
chr17_-_34607257
|
1.071
|
NM_000723
NM_199247
NM_199248
|
CACNB1
|
calcium channel, voltage-dependent, beta 1 subunit
|
|
chr20_+_34603311
|
1.069
|
|
MYL9
|
myosin, light chain 9, regulatory
|
|
chr10_+_104394185
|
1.063
|
NM_030912
|
TRIM8
|
tripartite motif containing 8
|
|
chr16_+_2503676
|
1.063
|
NM_001198569
NM_001694
|
ATP6V0C
|
ATPase, H+ transporting, lysosomal 16kDa, V0 subunit c
|
|
chr13_-_110365416
|
1.057
|
NM_017664
|
ANKRD10
|
ankyrin repeat domain 10
|
|
chr11_+_67534371
|
1.049
|
|
ALDH3B1
|
aldehyde dehydrogenase 3 family, member B1
|
|
chr7_+_37926943
|
1.048
|
|
EPDR1
|
ependymin related protein 1 (zebrafish)
|
|
chr2_-_220144511
|
1.039
|
NM_001173408
NM_001173431
NM_015311
|
OBSL1
|
obscurin-like 1
|
|
chr19_+_43572679
|
1.033
|
NM_001039616
NM_001042522
|
SPRED3
|
sprouty-related, EVH1 domain containing 3
|
|
chr1_+_244954153
|
1.024
|
|
SCCPDH
|
saccharopine dehydrogenase (putative)
|
|
chr3_-_169295752
|
1.021
|
|
GOLIM4
|
golgi integral membrane protein 4
|
|
chr16_+_2503915
|
1.017
|
|
ATP6V0C
|
ATPase, H+ transporting, lysosomal 16kDa, V0 subunit c
|
|
chr3_+_49034050
|
0.995
|
NM_199069
NM_199070
|
NDUFAF3
|
NADH dehydrogenase (ubiquinone) 1 alpha subcomplex, assembly factor 3
|
|
chr5_+_175725050
|
0.987
|
NM_173664
|
ARL10
|
ADP-ribosylation factor-like 10
|
|
chr19_-_50975603
|
0.972
|
NM_001081563
|
DMPK
|
dystrophia myotonica-protein kinase
|
|
chr5_-_176857158
|
0.970
|
|
PDLIM7
|
PDZ and LIM domain 7 (enigma)
|
|
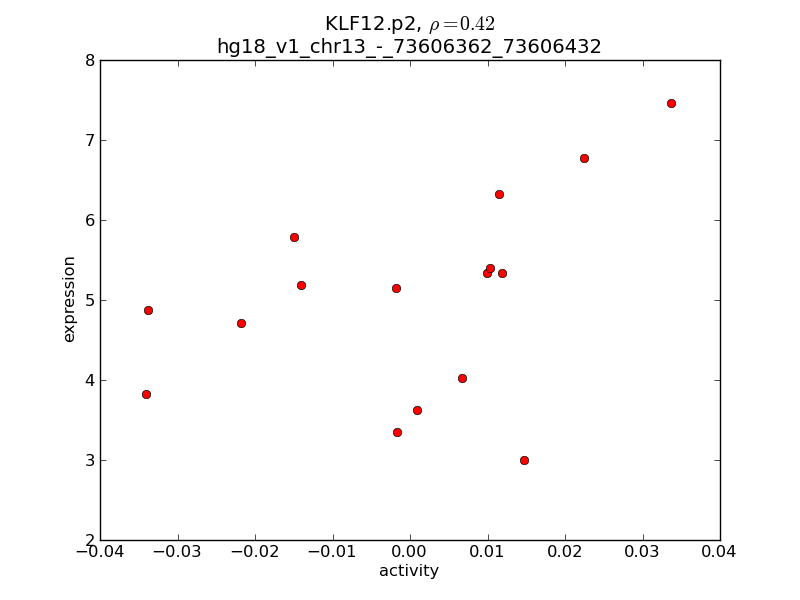
chr13_-_73606362
|
0.968
|
|
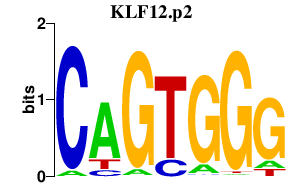
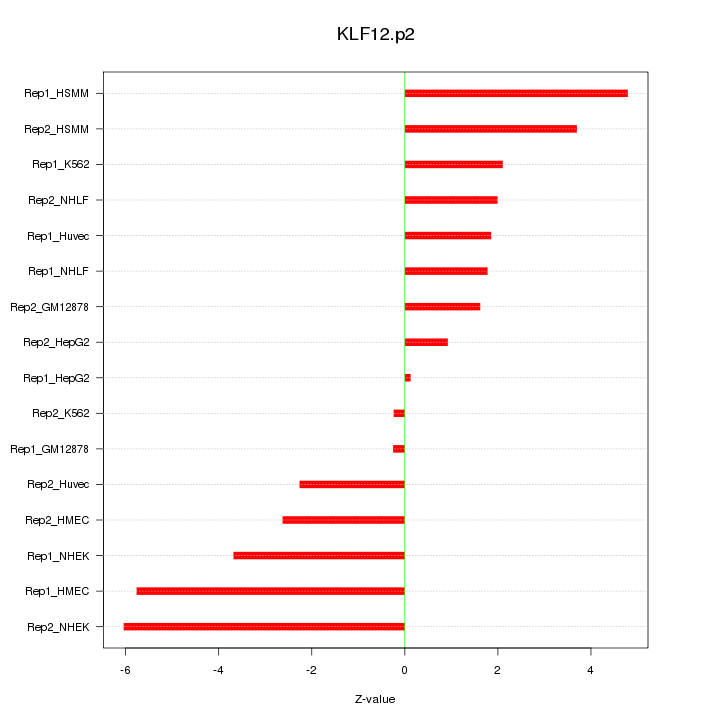
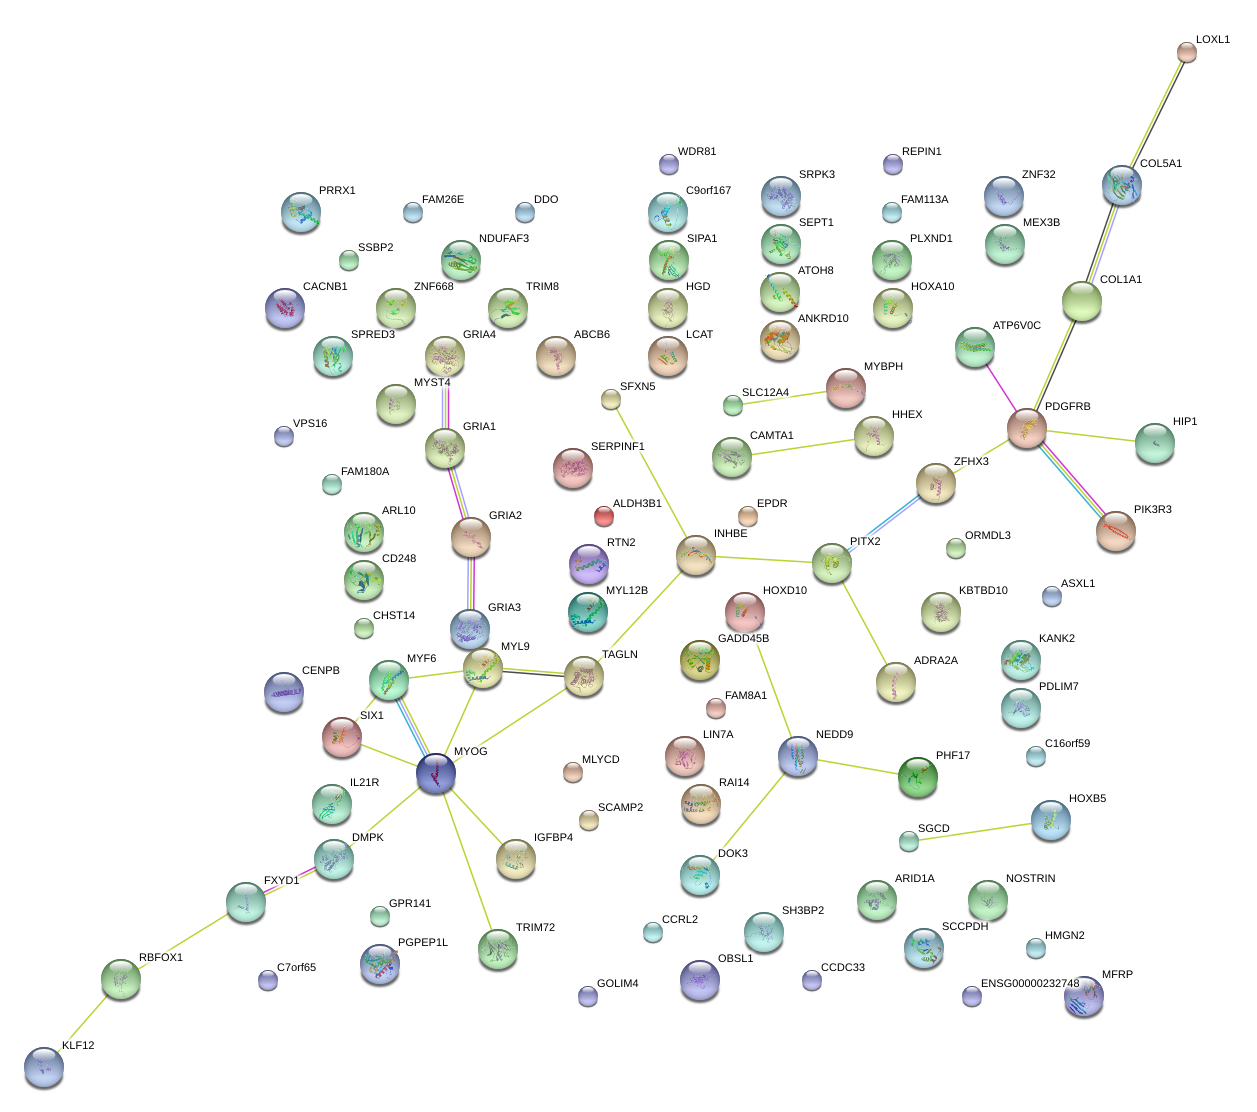
KLF12
|
Kruppel-like factor 12
|
|
chr16_-_30301357
|
0.968
|
|
SEPT1
|
septin 1
|
|
chr4_-_111763356
|
0.963
|
|
PITX2
|
paired-like homeodomain 2
|
|
chr19_+_2427122
|
0.962
|
NM_015675
|
GADD45B
|
growth arrest and DNA-damage-inducible, beta
|
|
chr13_-_110365282
|
0.950
|
|
|
|
|
chr7_-_135083906
|
0.948
|
NM_205855
|
FAM180A
|
family with sequence similarity 180, member A
|
|
chr7_+_47661366
|
0.939
|
NM_001123065
|
C7orf65
|
chromosome 7 open reading frame 65
|
|
chr15_+_72397934
|
0.933
|
NM_182791
|
CCDC33
|
coiled-coil domain containing 33
|
|
chr2_+_169367345
|
0.930
|
NM_001039724
NM_001171632
NM_052946
|
NOSTRIN
|
nitric oxide synthase trafficker
|
|
chr1_-_201321711
|
0.923
|
|
MYOG
|
myogenin (myogenic factor 4)
|
|
chr16_-_30992574
|
0.922
|
|
ZNF668
|
zinc finger protein 668
|
|
chr17_-_45622064
|
0.918
|
|
|
|
|
chr6_+_17708483
|
0.914
|
NM_016255
|
FAM8A1
|
family with sequence similarity 8, member A1
|
|
chr17_+_71141108
|
0.909
|
NM_001162995
|
LOC643008
|
hypothetical protein LOC643008
|
|
chr5_-_176868483
|
0.903
|
|
DOK3
|
docking protein 3
|
|
chr16_+_7322751
|
0.901
|
NM_145891
NM_145892
NM_145893
|
RBFOX1
|
RNA binding protein, fox-1 homolog (C. elegans) 1
|
|
chr11_+_65164767
|
0.898
|
|
SIPA1
|
signal-induced proliferation-associated 1
|
|
chr15_-_97366313
|
0.891
|
NM_001102612
|
PGPEP1L
|
pyroglutamyl-peptidase I-like
|
|
chr5_-_149515331
|
0.884
|
|
PDGFRB
|
platelet-derived growth factor receptor, beta polypeptide
|
|
chr1_+_6767968
|
0.882
|
NM_001195563
NM_015215
|
CAMTA1
|
calmodulin binding transcription activator 1
|
|
chr10_-_43464157
|
0.881
|
NM_001005368
|
ZNF32
|
zinc finger protein 32
|
|
chr4_+_129951877
|
0.879
|
|
PHF17
|
PHD finger protein 17
|
|
chr17_-_45620313
|
0.875
|
|
|
|
|
chr11_-_1974829
|
0.865
|
|
H19
|
H19, imprinted maternally expressed transcript (non-protein coding)
|
|
chr5_-_176857207
|
0.862
|
NM_005451
NM_203352
NM_213636
|
PDLIM7
|
PDZ and LIM domain 7 (enigma)
|
|
chr6_-_11490487
|
0.862
|
NM_001142393
|
NEDD9
|
neural precursor cell expressed, developmentally down-regulated 9
|
|
chr11_-_65841077
|
0.859
|
NM_020404
|
CD248
|
CD248 molecule, endosialin
|
|
chr20_+_2769338
|
0.854
|
NM_022575
NM_080413
|
VPS16
|
vacuolar protein sorting 16 homolog (S. cerevisiae)
|
|
chr5_+_155686750
|
0.851
|
|
SGCD
|
sarcoglycan, delta (35kDa dystrophin-associated glycoprotein)
|
|
chr20_-_2769245
|
0.850
|
NM_022760
|
FAM113A
|
family with sequence similarity 113, member A
|
|
chr2_-_73152323
|
0.840
|
NM_144579
|
SFXN5
|
sideroflexin 5
|
|
chr3_-_121883647
|
0.833
|
|
HGD
|
homogentisate 1,2-dioxygenase
|
|
chr15_+_72005864
|
0.831
|
|
LOXL1
|
lysyl oxidase-like 1
|
|
chr3_+_46423682
|
0.828
|
NM_003965
NM_001130910
|
CCRL2
|
chemokine (C-C motif) receptor-like 2
|
|
chr7_+_151792052
|
0.824
|
|
LOC100128822
|
hypothetical LOC100128822
|
|
chr20_-_2769120
|
0.822
|
|
FAM113A
|
family with sequence similarity 113, member A
|
|
chr6_-_110843432
|
0.815
|
NM_003649
NM_004032
|
DDO
|
D-aspartate oxidase
|
|
chr11_+_67534364
|
0.815
|
NM_000694
NM_001030010
|
ALDH3B1
|
aldehyde dehydrogenase 3 family, member B1
|
|
chr1_-_46370837
|
0.808
|
NM_003629
NM_001114172
|
PIK3R3
|
phosphoinositide-3-kinase, regulatory subunit 3 (gamma)
|
|
chr16_+_2450081
|
0.806
|
NM_025108
|
C16orf59
|
chromosome 16 open reading frame 59
|
|
chr14_-_60185659
|
0.806
|
NM_005982
|
SIX1
|
SIX homeobox 1
|
|
chr16_-_30301634
|
0.804
|
NM_052838
|
SEPT1
|
septin 1
|
|
chr5_+_152850276
|
0.804
|
NM_000827
NM_001114183
|
GRIA1
|
glutamate receptor, ionotropic, AMPA 1
|
|
chr1_-_154205675
|
0.803
|
|
ARHGEF2
|
Rho/Rac guanine nucleotide exchange factor (GEF) 2
|
|
chr17_+_1611983
|
0.799
|
NM_002615
|
SERPINF1
|
serpin peptidase inhibitor, clade F (alpha-2 antiplasmin, pigment epithelium derived factor), member 1
|
|
chr8_+_1936549
|
0.798
|
|
KBTBD11
|
kelch repeat and BTB (POZ) domain containing 11
|
|
chr11_+_65164963
|
0.797
|
|
|
|
|
chr20_-_2769789
|
0.796
|
|
FAM113A
|
family with sequence similarity 113, member A
|
|
chr15_+_72005875
|
0.796
|
|
LOXL1
|
lysyl oxidase-like 1
|
|
chr13_-_94751573
|
0.792
|
NM_001105515
NM_005845
|
ABCC4
|
ATP-binding cassette, sub-family C (CFTR/MRP), member 4
|
|
chr7_-_27191287
|
0.792
|
NM_005523
|
HOXA11
|
homeobox A11
|
|
chr5_-_176869463
|
0.791
|
NM_024872
|
DOK3
|
docking protein 3
|
|
chr22_+_19239221
|
0.791
|
|
MED15
|
mediator complex subunit 15
|
|
chr19_-_19487237
|
0.791
|
NM_032037
|
TSSK6
|
testis-specific serine kinase 6
|
|
chr19_+_55045754
|
0.791
|
|
PTOV1
|
prostate tumor overexpressed 1
|
|
chr4_-_1980473
|
0.790
|
|
WHSC2
|
Wolf-Hirschhorn syndrome candidate 2
|
|
chr3_-_129690056
|
0.784
|
NM_001145661
|
GATA2
|
GATA binding protein 2
|
|
chr14_+_102870431
|
0.783
|
|
EIF5
|
eukaryotic translation initiation factor 5
|
|
chr11_+_120966280
|
0.780
|
|
SORL1
|
sortilin-related receptor, L(DLR class) A repeats containing
|
|
chr9_+_135232937
|
0.780
|
|
C9orf96
|
chromosome 9 open reading frame 96
|
|
chr7_+_149657810
|
0.779
|
NM_138434
|
C7orf29
|
chromosome 7 open reading frame 29
|
|
chr16_+_2959362
|
0.778
|
|
PAQR4
|
progestin and adipoQ receptor family member IV
|
|
chr15_+_87540238
|
0.777
|
|
ABHD2
|
abhydrolase domain containing 2
|
|
chr10_-_118491971
|
0.773
|
NM_025015
|
HSPA12A
|
heat shock 70kDa protein 12A
|
|
chr11_-_118716736
|
0.773
|
|
C1QTNF5
MFRP
|
C1q and tumor necrosis factor related protein 5
membrane frizzled-related protein
|
|
chr17_-_59131210
|
0.772
|
NM_030576
|
LIMD2
|
LIM domain containing 2
|
|
chr11_+_17697685
|
0.769
|
NM_002478
|
MYOD1
|
myogenic differentiation 1
|
|
chr8_-_80842452
|
0.765
|
NM_001040708
NM_012258
|
HEY1
|
hairy/enhancer-of-split related with YRPW motif 1
|
|
chr17_-_45629401
|
0.764
|
|
|
|
|
chr11_+_66381451
|
0.761
|
NM_024036
|
LRFN4
|
leucine rich repeat and fibronectin type III domain containing 4
|
|
chr5_-_176869943
|
0.760
|
NM_001144875
NM_001144876
|
DOK3
|
docking protein 3
|
|
chr9_-_16717887
|
0.759
|
|
BNC2
|
basonuclin 2
|
|
chr6_+_31838751
|
0.758
|
NM_001039651
|
C6orf26
|
chromosome 6 open reading frame 26
|
|
chr5_-_32480486
|
0.755
|
|
ZFR
|
zinc finger RNA binding protein
|
|
chr17_-_59131194
|
0.753
|
|
LIMD2
|
LIM domain containing 2
|
|
chr9_-_138378061
|
0.752
|
NM_001080849
|
DNLZ
|
DNL-type zinc finger
|
|
chr1_+_23990228
|
0.750
|
NM_007260
|
LYPLA2
|
lysophospholipase II
|
|
chr4_-_176970407
|
0.750
|
|
GPM6A
|
glycoprotein M6A
|
|
chr3_+_45611180
|
0.749
|
NM_014240
|
LIMD1
|
LIM domains containing 1
|
|
chr19_+_16296734
|
0.746
|
|
KLF2
|
Kruppel-like factor 2 (lung)
|
|
chr15_-_72513311
|
0.744
|
NM_001146029
NM_003612
|
SEMA7A
|
semaphorin 7A, GPI membrane anchor (John Milton Hagen blood group)
|
|
chr17_+_43127628
|
0.740
|
NM_014726
|
TBKBP1
|
TBK1 binding protein 1
|
|
chr11_-_1974992
|
0.740
|
|
H19
|
H19, imprinted maternally expressed transcript (non-protein coding)
|
|
chr1_-_201321999
|
0.739
|
NM_002479
|
MYOG
|
myogenin (myogenic factor 4)
|
|
chr9_-_138387903
|
0.735
|
|
CARD9
|
caspase recruitment domain family, member 9
|
|
chr20_+_34603290
|
0.731
|
NM_006097
NM_181526
|
MYL9
|
myosin, light chain 9, regulatory
|
|
chr4_-_176970895
|
0.731
|
|
GPM6A
|
glycoprotein M6A
|
|
chr5_-_78317444
|
0.728
|
NM_198709
|
ARSB
|
arylsulfatase B
|
|
chr4_-_165523856
|
0.725
|
NM_001166373
|
MARCH1
|
membrane-associated ring finger (C3HC4) 1
|
|
chr6_-_166716353
|
0.725
|
|
BRP44L
|
brain protein 44-like
|
|
chr9_+_35528628
|
0.724
|
NM_001135999
|
RUSC2
|
RUN and SH3 domain containing 2
|
|
chr11_-_117589283
|
0.724
|
NM_153206
|
AMICA1
|
adhesion molecule, interacts with CXADR antigen 1
|
|
chr10_-_94323808
|
0.722
|
|
IDE
|
insulin-degrading enzyme
|
|
chr16_+_30951915
|
0.719
|
|
STX4
|
syntaxin 4
|
|
chr10_-_43464272
|
0.717
|
NM_006973
|
ZNF32
|
zinc finger protein 32
|
|
chr6_+_11646472
|
0.716
|
NM_001100829
|
TMEM170B
|
transmembrane protein 170B
|
|
chr19_-_2378530
|
0.716
|
|
TIMM13
|
translocase of inner mitochondrial membrane 13 homolog (yeast)
|
|
chr14_+_57835028
|
0.713
|
|
ARID4A
|
AT rich interactive domain 4A (RBP1-like)
|
|
chr2_+_232281491
|
0.713
|
|
PTMA
|
prothymosin, alpha
|
|
chr1_-_32479785
|
0.712
|
|
MTMR9LP
|
myotubularin related protein 9-like, pseudogene
|
|
chr9_-_138880530
|
0.712
|
NM_003792
NM_153200
|
EDF1
|
endothelial differentiation-related factor 1
|
|
chr2_+_177965734
|
0.710
|
|
AGPS
|
alkylglycerone phosphate synthase
|
|
chr2_+_219991342
|
0.708
|
NM_001927
|
DES
|
desmin
|
|
chr1_+_52840630
|
0.707
|
NM_015696
|
GPX6
GPX7
|
glutathione peroxidase 6 (olfactory)
glutathione peroxidase 7
|
|
chr16_+_2959342
|
0.707
|
NM_152341
|
PAQR4
|
progestin and adipoQ receptor family member IV
|
|
chr19_-_62680703
|
0.704
|
NM_001024596
NM_001144068
|
ZNF772
|
zinc finger protein 772
|
|
chr3_-_49033430
|
0.704
|
NM_018114
|
DALRD3
|
DALR anticodon binding domain containing 3
|
|
chr16_-_31427130
|
0.701
|
NM_022744
|
C16orf58
|
chromosome 16 open reading frame 58
|
|
chr2_+_56265260
|
0.699
|
|
|
|
|
chr1_+_26671548
|
0.698
|
|
HMGN2
|
high-mobility group nucleosomal binding domain 2
|
|
chr2_-_25328452
|
0.697
|
NM_153759
|
DNMT3A
|
DNA (cytosine-5-)-methyltransferase 3 alpha
|
|
chr6_+_20510019
|
0.696
|
NM_001949
|
E2F3
|
E2F transcription factor 3
|
|
chr1_+_116744992
|
0.694
|
|
ATP1A1
|
ATPase, Na+/K+ transporting, alpha 1 polypeptide
|
|
chr5_+_137716169
|
0.692
|
NM_016604
|
KDM3B
|
lysine (K)-specific demethylase 3B
|
|
chr16_+_87765661
|
0.691
|
NM_004933
|
CDH15
|
cadherin 15, type 1, M-cadherin (myotubule)
|
|
chr8_-_27171852
|
0.689
|
|
STMN4
|
stathmin-like 4
|
|
chr17_-_1336073
|
0.688
|
|
MYO1C
|
myosin IC
|
|
chr10_-_94323827
|
0.686
|
NM_004969
|
IDE
|
insulin-degrading enzyme
|
|
chr1_+_226394589
|
0.685
|
|
GUK1
|
guanylate kinase 1
|
|
chr6_-_111911106
|
0.684
|
NM_002912
|
REV3L
|
REV3-like, catalytic subunit of DNA polymerase zeta (yeast)
|
