|
chr1_-_3556420
|
2.953
|
NM_017818
|
WDR8
|
WD repeat domain 8
|
|
chr1_-_23729871
|
2.924
|
|
E2F2
|
E2F transcription factor 2
|
|
chr10_+_94598204
|
2.867
|
NM_019053
|
EXOC6
|
exocyst complex component 6
|
|
chr7_+_44754978
|
2.689
|
NM_031449
|
ZMIZ2
|
zinc finger, MIZ-type containing 2
|
|
chr22_+_23153529
|
2.620
|
NM_000675
|
ADORA2A
|
adenosine A2a receptor
|
|
chr16_-_87570716
|
2.613
|
NM_005187
|
CBFA2T3
|
core-binding factor, runt domain, alpha subunit 2; translocated to, 3
|
|
chr7_+_149696901
|
2.527
|
|
REPIN1
|
replication initiator 1
|
|
chr5_+_168996852
|
2.517
|
|
DOCK2
|
dedicator of cytokinesis 2
|
|
chr5_+_168996816
|
2.512
|
NM_004946
|
DOCK2
|
dedicator of cytokinesis 2
|
|
chr2_-_6923215
|
2.435
|
NM_207315
|
CMPK2
|
cytidine monophosphate (UMP-CMP) kinase 2, mitochondrial
|
|
chr1_+_89763030
|
2.402
|
|
LRRC8B
|
leucine rich repeat containing 8 family, member B
|
|
chr10_+_92970302
|
2.389
|
NM_032373
|
PCGF5
|
polycomb group ring finger 5
|
|
chr1_+_89762984
|
2.318
|
NM_001134476
|
LRRC8B
|
leucine rich repeat containing 8 family, member B
|
|
chr19_+_5082230
|
2.261
|
|
KDM4B
|
lysine (K)-specific demethylase 4B
|
|
chr17_+_73676219
|
2.219
|
NM_004710
|
SYNGR2
|
synaptogyrin 2
|
|
chr2_+_222997529
|
2.218
|
NM_152386
|
SGPP2
|
sphingosine-1-phosphate phosphatase 2
|
|
chr1_+_90060131
|
2.209
|
|
LRRC8D
|
leucine rich repeat containing 8 family, member D
|
|
chr11_+_817584
|
2.203
|
NM_173584
|
EFCAB4A
|
EF-hand calcium binding domain 4A
|
|
chr1_+_90059992
|
2.199
|
NM_018103
|
LRRC8D
|
leucine rich repeat containing 8 family, member D
|
|
chr4_+_129951877
|
2.194
|
|
PHF17
|
PHD finger protein 17
|
|
chr2_+_222997456
|
2.103
|
|
SGPP2
|
sphingosine-1-phosphate phosphatase 2
|
|
chr5_-_176868483
|
2.081
|
|
DOK3
|
docking protein 3
|
|
chr22_+_35586950
|
2.009
|
NM_000631
NM_013416
|
NCF4
|
neutrophil cytosolic factor 4, 40kDa
|
|
chr1_+_12149637
|
1.987
|
NM_001066
|
TNFRSF1B
|
tumor necrosis factor receptor superfamily, member 1B
|
|
chr22_-_49317408
|
1.953
|
|
ODF3B
|
outer dense fiber of sperm tails 3B
|
|
chr3_-_13436802
|
1.943
|
NM_024923
|
NUP210
|
nucleoporin 210kDa
|
|
chr5_+_156625629
|
1.918
|
NM_001037333
NM_001037332
|
CYFIP2
|
cytoplasmic FMR1 interacting protein 2
|
|
chr5_+_95093267
|
1.867
|
|
|
|
|
chr1_+_12149662
|
1.862
|
|
TNFRSF1B
|
tumor necrosis factor receptor superfamily, member 1B
|
|
chr16_-_30301357
|
1.853
|
|
SEPT1
|
septin 1
|
|
chr22_-_20314274
|
1.816
|
NM_001017964
|
YDJC
|
YdjC homolog (bacterial)
|
|
chr10_+_92970487
|
1.797
|
|
PCGF5
|
polycomb group ring finger 5
|
|
chr17_-_18890963
|
1.785
|
NM_006613
|
GRAP
|
GRB2-related adaptor protein
|
|
chr17_-_8809656
|
1.769
|
NM_001142633
|
PIK3R5
|
phosphoinositide-3-kinase, regulatory subunit 5
|
|
chr11_+_63864263
|
1.730
|
NM_032251
|
CCDC88B
|
coiled-coil domain containing 88B
|
|
chr13_+_77170470
|
1.692
|
NM_001040153
|
SLAIN1
|
SLAIN motif family, member 1
|
|
chr9_-_139084833
|
1.691
|
NM_178448
|
C9orf140
|
chromosome 9 open reading frame 140
|
|
chr17_-_36559579
|
1.674
|
NM_033188
|
KRTAP4-5
|
keratin associated protein 4-5
|
|
chr6_+_11646472
|
1.624
|
NM_001100829
|
TMEM170B
|
transmembrane protein 170B
|
|
chr1_+_90059183
|
1.622
|
|
LRRC8D
|
leucine rich repeat containing 8 family, member D
|
|
chr14_+_71468902
|
1.621
|
|
RGS6
|
regulator of G-protein signaling 6
|
|
chr4_+_39874921
|
1.614
|
NM_004310
|
RHOH
|
ras homolog gene family, member H
|
|
chr17_-_4831388
|
1.610
|
NM_001171167
NM_001171168
|
CAMTA2
|
calmodulin binding transcription activator 2
|
|
chr1_-_23730298
|
1.580
|
NM_004091
|
E2F2
|
E2F transcription factor 2
|
|
chr19_-_60587414
|
1.579
|
NM_001190764
|
LOC388564
|
hypothetical protein LOC388564
|
|
chr16_+_631902
|
1.573
|
|
FAM195A
|
family with sequence similarity 195, member A
|
|
chr19_+_60851207
|
1.558
|
|
CCDC106
|
coiled-coil domain containing 106
|
|
chr20_+_36867708
|
1.555
|
NM_001172735
NM_015568
|
PPP1R16B
|
protein phosphatase 1, regulatory (inhibitor) subunit 16B
|
|
chr4_-_42353640
|
1.551
|
NM_001105529
NM_006095
|
ATP8A1
|
ATPase, aminophospholipid transporter (APLT), class I, type 8A, member 1
|
|
chr17_+_40655060
|
1.549
|
NM_005892
|
FMNL1
|
formin-like 1
|
|
chr17_-_44058612
|
1.547
|
NM_024017
|
HOXB9
|
homeobox B9
|
|
chr19_+_14405216
|
1.543
|
|
PKN1
|
protein kinase N1
|
|
chr22_-_20314366
|
1.533
|
|
YDJC
|
YdjC homolog (bacterial)
|
|
chr2_+_113648020
|
1.491
|
NM_012455
|
PSD4
|
pleckstrin and Sec7 domain containing 4
|
|
chr1_-_111548440
|
1.483
|
|
DENND2D
|
DENN/MADD domain containing 2D
|
|
chr16_-_1369613
|
1.474
|
NM_001193389
NM_023076
|
UNKL
|
unkempt homolog (Drosophila)-like
|
|
chr10_-_23043042
|
1.464
|
|
PIP4K2A
|
phosphatidylinositol-5-phosphate 4-kinase, type II, alpha
|
|
chr10_-_98470164
|
1.458
|
NM_152309
|
PIK3AP1
|
phosphoinositide-3-kinase adaptor protein 1
|
|
chr19_+_6723801
|
1.449
|
|
|
|
|
chr6_+_31647854
|
1.438
|
NM_001159740
|
LTA
|
lymphotoxin alpha (TNF superfamily, member 1)
|
|
chr6_+_36206239
|
1.437
|
NM_002754
|
MAPK13
|
mitogen-activated protein kinase 13
|
|
chr2_+_219453487
|
1.416
|
NM_025216
|
WNT10A
|
wingless-type MMTV integration site family, member 10A
|
|
chr2_+_113648036
|
1.408
|
|
PSD4
|
pleckstrin and Sec7 domain containing 4
|
|
chr1_-_1701313
|
1.406
|
NM_001198994
|
NADK
|
NAD kinase
|
|
chr9_+_139292094
|
1.388
|
NM_017723
|
C9orf167
|
chromosome 9 open reading frame 167
|
|
chr12_+_131797455
|
1.383
|
NM_001170543
NM_001170544
NM_138575
|
PGAM5
|
phosphoglycerate mutase family member 5
|
|
chr7_+_149696792
|
1.382
|
NM_001099695
NM_001099696
NM_013400
|
REPIN1
|
replication initiator 1
|
|
chr17_-_60345364
|
1.373
|
NM_199340
|
LRRC37A3
|
leucine rich repeat containing 37, member A3
|
|
chr7_+_74877568
|
1.355
|
|
NSUN5P1
|
NOP2/Sun domain family, member 5 pseudogene 1
|
|
chr1_-_24112345
|
1.336
|
NM_001841
|
CNR2
|
cannabinoid receptor 2 (macrophage)
|
|
chr17_-_71747867
|
1.317
|
NM_052916
|
RNF157
|
ring finger protein 157
|
|
chr14_+_30413393
|
1.305
|
NM_001135058
NM_004086
|
COCH
|
coagulation factor C homolog, cochlin (Limulus polyphemus)
|
|
chr22_-_22511173
|
1.299
|
NM_001002862
NM_001135751
NM_198440
|
DERL3
|
Der1-like domain family, member 3
|
|
chr3_-_13436725
|
1.289
|
|
NUP210
|
nucleoporin 210kDa
|
|
chr19_+_18145631
|
1.284
|
|
IFI30
|
interferon, gamma-inducible protein 30
|
|
chr19_+_10392128
|
1.265
|
NM_001111307
|
PDE4A
|
phosphodiesterase 4A, cAMP-specific
|
|
chr15_-_46257611
|
1.260
|
|
MYEF2
|
myelin expression factor 2
|
|
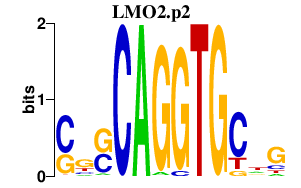
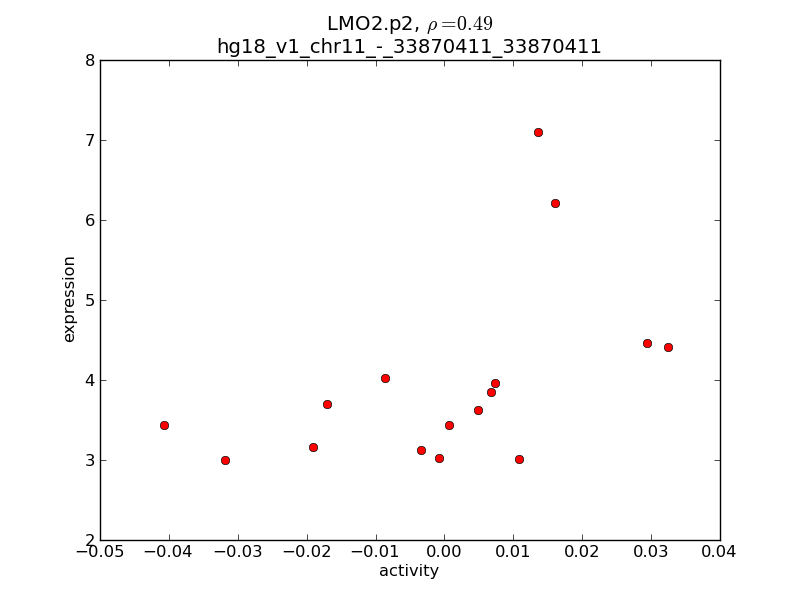
chr11_-_33847507
|
1.248
|
|
LMO2
|
LIM domain only 2 (rhombotin-like 1)
|
|
chr15_-_46257745
|
1.240
|
NM_016132
|
MYEF2
|
myelin expression factor 2
|
|
chr9_-_126945536
|
1.234
|
NM_001144877
NM_173690
|
SCAI
|
suppressor of cancer cell invasion
|
|
chrX_-_118711088
|
1.233
|
|
SEPT6
|
septin 6
|
|
chr16_+_631828
|
1.222
|
NM_138418
|
FAM195A
|
family with sequence similarity 195, member A
|
|
chr6_+_44295219
|
1.214
|
NM_001078174
NM_004955
|
SLC29A1
|
solute carrier family 29 (nucleoside transporters), member 1
|
|
chr10_-_103337872
|
1.213
|
|
POLL
|
polymerase (DNA directed), lambda
|
|
chr2_-_25328452
|
1.202
|
NM_153759
|
DNMT3A
|
DNA (cytosine-5-)-methyltransferase 3 alpha
|
|
chrX_-_118711144
|
1.194
|
|
SEPT6
|
septin 6
|
|
chr19_+_18145619
|
1.188
|
|
IFI30
|
interferon, gamma-inducible protein 30
|
|
chr22_-_36212160
|
1.173
|
NM_001166343
NM_002405
|
MFNG
|
MFNG O-fucosylpeptide 3-beta-N-acetylglucosaminyltransferase
|
|
chr10_+_31648103
|
1.163
|
NM_001174093
NM_001174095
NM_001174096
NM_030751
|
ZEB1
|
zinc finger E-box binding homeobox 1
|
|
chr5_-_138753443
|
1.162
|
NM_016459
|
MZB1
|
marginal zone B and B1 cell-specific protein
|
|
chr1_-_92724181
|
1.157
|
NM_001127216
|
GFI1
|
growth factor independent 1 transcription repressor
|
|
chrX_-_118711183
|
1.153
|
|
SEPT6
|
septin 6
|
|
chr6_+_31648071
|
1.150
|
NM_000595
|
LTA
|
lymphotoxin alpha (TNF superfamily, member 1)
|
|
chr11_-_684842
|
1.147
|
|
DEAF1
|
deformed epidermal autoregulatory factor 1 (Drosophila)
|
|
chr1_+_109827975
|
1.136
|
NM_153340
|
ATXN7L2
|
ataxin 7-like 2
|
|
chr3_+_16901455
|
1.132
|
NM_001144382
|
PLCL2
|
phospholipase C-like 2
|
|
chr20_+_60744268
|
1.130
|
|
SLCO4A1
|
solute carrier organic anion transporter family, member 4A1
|
|
chr10_-_31647925
|
1.129
|
|
LOC220930
|
hypothetical LOC220930
|
|
chr5_+_126140949
|
1.121
|
|
LMNB1
|
lamin B1
|
|
chr14_-_22358752
|
1.118
|
NM_001126106
|
SLC7A7
|
solute carrier family 7 (cationic amino acid transporter, y+ system), member 7
|
|
chr7_-_8268292
|
1.118
|
NM_001136020
|
ICA1
|
islet cell autoantigen 1, 69kDa
|
|
chr19_-_6621078
|
1.116
|
|
TNFSF14
|
tumor necrosis factor (ligand) superfamily, member 14
|
|
chr10_+_31647425
|
1.115
|
|
ZEB1
|
zinc finger E-box binding homeobox 1
|
|
chr17_+_18971506
|
1.109
|
NM_001129778
|
GRAPL
|
GRB2-related adaptor protein-like
|
|
chr19_+_47073029
|
1.104
|
NM_001783
NM_021601
|
CD79A
|
CD79a molecule, immunoglobulin-associated alpha
|
|
chr8_-_59734975
|
1.095
|
|
NSMAF
|
neutral sphingomyelinase (N-SMase) activation associated factor
|
|
chr10_+_102811542
|
1.094
|
|
KAZALD1
|
Kazal-type serine peptidase inhibitor domain 1
|
|
chr20_+_60744231
|
1.094
|
NM_016354
|
SLCO4A1
|
solute carrier organic anion transporter family, member 4A1
|
|
chr6_-_44333002
|
1.090
|
NM_178148
|
SLC35B2
|
solute carrier family 35, member B2
|
|
chr17_-_36594652
|
1.086
|
NM_033060
|
KRTAP4-1
|
keratin associated protein 4-1
|
|
chr20_-_57015698
|
1.085
|
NM_001336
|
CTSZ
|
cathepsin Z
|
|
chr8_-_59734801
|
1.081
|
|
NSMAF
|
neutral sphingomyelinase (N-SMase) activation associated factor
|
|
chr16_+_51690564
|
1.072
|
|
CHD9
|
chromodomain helicase DNA binding protein 9
|
|
chr9_-_125070613
|
1.068
|
NM_018387
|
STRBP
|
spermatid perinuclear RNA binding protein
|
|
chr1_+_165865953
|
1.059
|
NM_052862
|
RCSD1
|
RCSD domain containing 1
|
|
chr15_+_89228668
|
1.055
|
NM_001143785
NM_002005
|
FES
|
feline sarcoma oncogene
|
|
chr8_-_59734939
|
1.048
|
|
NSMAF
|
neutral sphingomyelinase (N-SMase) activation associated factor
|
|
chr5_+_126140746
|
1.045
|
|
LMNB1
|
lamin B1
|
|
chr6_-_25019173
|
1.044
|
NM_014722
|
FAM65B
|
family with sequence similarity 65, member B
|
|
chr20_-_23014828
|
1.040
|
NM_012072
|
CD93
|
CD93 molecule
|
|
chr7_+_120378052
|
1.038
|
NM_019071
NM_198267
|
ING3
|
inhibitor of growth family, member 3
|
|
chr22_-_49311722
|
1.030
|
NM_001169109
|
SCO2
|
SCO cytochrome oxidase deficient homolog 2 (yeast)
|
|
chr17_-_70778667
|
1.024
|
|
MIF4GD
|
MIF4G domain containing
|
|
chr2_-_24436795
|
1.018
|
NM_006277
NM_019595
NM_147152
|
ITSN2
|
intersectin 2
|
|
chr11_-_124137260
|
1.007
|
NM_138961
|
ESAM
|
endothelial cell adhesion molecule
|
|
chrX_-_118711350
|
1.007
|
NM_015129
NM_145799
NM_145800
NM_145802
|
SEPT6
|
septin 6
|
|
chr12_-_25041639
|
1.004
|
NM_001101339
|
C12orf77
|
chromosome 12 open reading frame 77
|
|
chr19_-_14177980
|
0.999
|
NM_001008701
NM_014921
|
LPHN1
|
latrophilin 1
|
|
chr8_+_143805595
|
0.995
|
NM_016647
|
C8orf55
|
chromosome 8 open reading frame 55
|
|
chr16_-_87405817
|
0.991
|
NM_000485
NM_001030018
|
APRT
|
adenine phosphoribosyltransferase
|
|
chr2_+_112529270
|
0.991
|
NM_032824
|
TMEM87B
|
transmembrane protein 87B
|
|
chr2_-_105312536
|
0.990
|
NM_001142621
NM_004257
|
TGFBRAP1
|
transforming growth factor, beta receptor associated protein 1
|
|
chr2_+_170298487
|
0.987
|
|
|
|
|
chr8_-_59734957
|
0.986
|
NM_003580
|
NSMAF
|
neutral sphingomyelinase (N-SMase) activation associated factor
|
|
chr1_-_27113018
|
0.980
|
NM_021969
|
NR0B2
|
nuclear receptor subfamily 0, group B, member 2
|
|
chr19_-_44060729
|
0.978
|
NM_001195833
NM_198445
|
RINL
|
Ras and Rab interactor-like
|
|
chrX_+_152562013
|
0.975
|
|
DUSP9
|
dual specificity phosphatase 9
|
|
chr22_-_49317873
|
0.974
|
NM_001014440
|
ODF3B
|
outer dense fiber of sperm tails 3B
|
|
chr11_+_70926718
|
0.968
|
NM_021046
|
KRTAP5-8
|
keratin associated protein 5-8
|
|
chr1_+_12046020
|
0.968
|
NM_001243
|
TNFRSF8
|
tumor necrosis factor receptor superfamily, member 8
|
|
chr1_+_1062137
|
0.966
|
|
LOC254099
|
hypothetical protein LOC254099
|
|
chr16_+_23754997
|
0.965
|
|
PRKCB
|
protein kinase C, beta
|
|
chr7_+_50314801
|
0.961
|
NM_006060
|
IKZF1
|
IKAROS family zinc finger 1 (Ikaros)
|
|
chr14_-_105392671
|
0.954
|
|
|
|
|
chr17_-_3814334
|
0.951
|
NM_005173
NM_174953
NM_174954
NM_174955
NM_174956
NM_174957
NM_174958
|
ATP2A3
|
ATPase, Ca++ transporting, ubiquitous
|
|
chr2_-_208198217
|
0.948
|
NM_001127395
|
METTL21A
|
methyltransferase like 21A
|
|
chr12_-_61615124
|
0.946
|
|
PPM1H
|
protein phosphatase, Mg2+/Mn2+ dependent, 1H
|
|
chr2_+_112529371
|
0.944
|
|
TMEM87B
|
transmembrane protein 87B
|
|
chr11_+_67567022
|
0.941
|
NM_006053
|
TCIRG1
|
T-cell, immune regulator 1, ATPase, H+ transporting, lysosomal V0 subunit A3
|
|
chr8_-_59734742
|
0.938
|
|
NSMAF
|
neutral sphingomyelinase (N-SMase) activation associated factor
|
|
chr21_+_44377913
|
0.934
|
NM_004649
NM_198155
|
C21orf33
|
chromosome 21 open reading frame 33
|
|
chr20_+_42463279
|
0.932
|
NM_000457
NM_178849
NM_178850
|
HNF4A
|
hepatocyte nuclear factor 4, alpha
|
|
chr21_+_44377974
|
0.928
|
|
C21orf33
|
chromosome 21 open reading frame 33
|
|
chr1_-_109651140
|
0.928
|
NM_001010985
|
MYBPHL
|
myosin binding protein H-like
|
|
chr6_-_41781655
|
0.924
|
|
TFEB
|
transcription factor EB
|
|
chr1_+_229181462
|
0.920
|
|
ARV1
|
ARV1 homolog (S. cerevisiae)
|
|
chr9_-_125070675
|
0.920
|
NM_001171137
|
STRBP
|
spermatid perinuclear RNA binding protein
|
|
chr15_+_81567327
|
0.912
|
NM_001144903
NM_023003
|
TM6SF1
|
transmembrane 6 superfamily member 1
|
|
chr9_-_35640852
|
0.910
|
NM_014450
|
SIT1
|
signaling threshold regulating transmembrane adaptor 1
|
|
chr2_+_190753833
|
0.909
|
NM_001042519
NM_032321
|
C2orf88
|
chromosome 2 open reading frame 88
|
|
chr8_-_59734474
|
0.905
|
NM_001144772
|
NSMAF
|
neutral sphingomyelinase (N-SMase) activation associated factor
|
|
chr17_-_16197433
|
0.903
|
NM_181716
|
CENPV
|
centromere protein V
|
|
chr3_+_45611180
|
0.902
|
NM_014240
|
LIMD1
|
LIM domains containing 1
|
|
chr1_+_229181417
|
0.900
|
NM_022786
|
ARV1
|
ARV1 homolog (S. cerevisiae)
|
|
chr17_-_4831644
|
0.898
|
NM_001171166
NM_015099
|
CAMTA2
|
calmodulin binding transcription activator 2
|
|
chr15_+_48261649
|
0.898
|
NM_001159629
NM_003645
|
SLC27A2
|
solute carrier family 27 (fatty acid transporter), member 2
|
|
chr5_+_139008667
|
0.897
|
|
CXXC5
|
CXXC finger protein 5
|
|
chr19_+_6723705
|
0.896
|
NM_005428
|
VAV1
|
vav 1 guanine nucleotide exchange factor
|
|
chr1_+_39229474
|
0.892
|
NM_001136275
NM_024595
|
AKIRIN1
|
akirin 1
|
|
chr17_-_70778856
|
0.892
|
NM_020679
|
MIF4GD
|
MIF4G domain containing
|
|
chr20_-_62081434
|
0.888
|
NM_080621
|
SAMD10
|
sterile alpha motif domain containing 10
|
|
chr2_-_242205556
|
0.885
|
NM_001164356
|
THAP4
|
THAP domain containing 4
|
|
chr7_+_73262264
|
0.880
|
|
LAT2
|
linker for activation of T cells family, member 2
|
|
chr12_-_8271460
|
0.876
|
NM_018088
|
FAM90A1
|
family with sequence similarity 90, member A1
|
|
chr3_-_129690056
|
0.866
|
NM_001145661
|
GATA2
|
GATA binding protein 2
|
|
chr19_+_18312365
|
0.864
|
NM_017712
|
FKBP8
PGPEP1
|
FK506 binding protein 8, 38kDa
pyroglutamyl-peptidase I
|
|
chr11_+_65164167
|
0.864
|
NM_153253
|
SIPA1
|
signal-induced proliferation-associated 1
|
|
chr9_-_96441409
|
0.863
|
|
FBP1
|
fructose-1,6-bisphosphatase 1
|
|
chr19_-_7607852
|
0.863
|
|
|
|
|
chr9_-_91302707
|
0.862
|
|
SEMA4D
|
sema domain, immunoglobulin domain (Ig), transmembrane domain (TM) and short cytoplasmic domain, (semaphorin) 4D
|
|
chr7_+_73262283
|
0.852
|
|
LAT2
|
linker for activation of T cells family, member 2
|
|
chr16_+_711139
|
0.849
|
NM_023933
|
FAM173A
|
family with sequence similarity 173, member A
|
|
chr21_+_41719847
|
0.848
|
NM_002462
NM_001178046
|
MX1
|
myxovirus (influenza virus) resistance 1, interferon-inducible protein p78 (mouse)
|
|
chr9_+_70509925
|
0.847
|
NM_003558
|
PIP5K1B
|
phosphatidylinositol-4-phosphate 5-kinase, type I, beta
|
|
chr6_+_16237300
|
0.847
|
|
MYLIP
|
myosin regulatory light chain interacting protein
|
|
chr4_+_154606900
|
0.846
|
NM_001131007
NM_015196
|
KIAA0922
|
KIAA0922
|
|
chr5_+_75734759
|
0.845
|
NM_006633
|
IQGAP2
|
IQ motif containing GTPase activating protein 2
|
|
chr10_-_115603848
|
0.845
|
NM_014881
|
DCLRE1A
|
DNA cross-link repair 1A
|
|
chr9_-_96441567
|
0.838
|
|
FBP1
|
fructose-1,6-bisphosphatase 1
|
|
chr8_-_145609737
|
0.831
|
|
SLC39A4
|
solute carrier family 39 (zinc transporter), member 4
|
|
chr9_+_263025
|
0.826
|
NM_001190458
NM_001193536
|
DOCK8
|
dedicator of cytokinesis 8
|
|
chr7_+_73262188
|
0.823
|
|
LAT2
|
linker for activation of T cells family, member 2
|
|
chr3_+_197851034
|
0.822
|
|
LRRC33
|
leucine rich repeat containing 33
|
|
chr20_+_42463419
|
0.821
|
|
HNF4A
|
hepatocyte nuclear factor 4, alpha
|
|
chr2_-_25390266
|
0.821
|
|
DNMT3A
|
DNA (cytosine-5-)-methyltransferase 3 alpha
|
|
chr2_-_208197940
|
0.819
|
NM_145280
|
METTL21A
|
methyltransferase like 21A
|
|
chr17_-_60346042
|
0.819
|
|
LRRC37A3
|
leucine rich repeat containing 37, member A3
|
|
chrX_-_152938441
|
0.819
|
|
IRAK1
|
interleukin-1 receptor-associated kinase 1
|
|
chr6_-_3172775
|
0.814
|
NM_178012
|
TUBB2B
|
tubulin, beta 2B
|
|
chr12_-_7793335
|
0.814
|
NM_130441
NM_203503
|
CLEC4C
|
C-type lectin domain family 4, member C
|