|
chr16_+_70654625
|
1.665
|
NM_020995
|
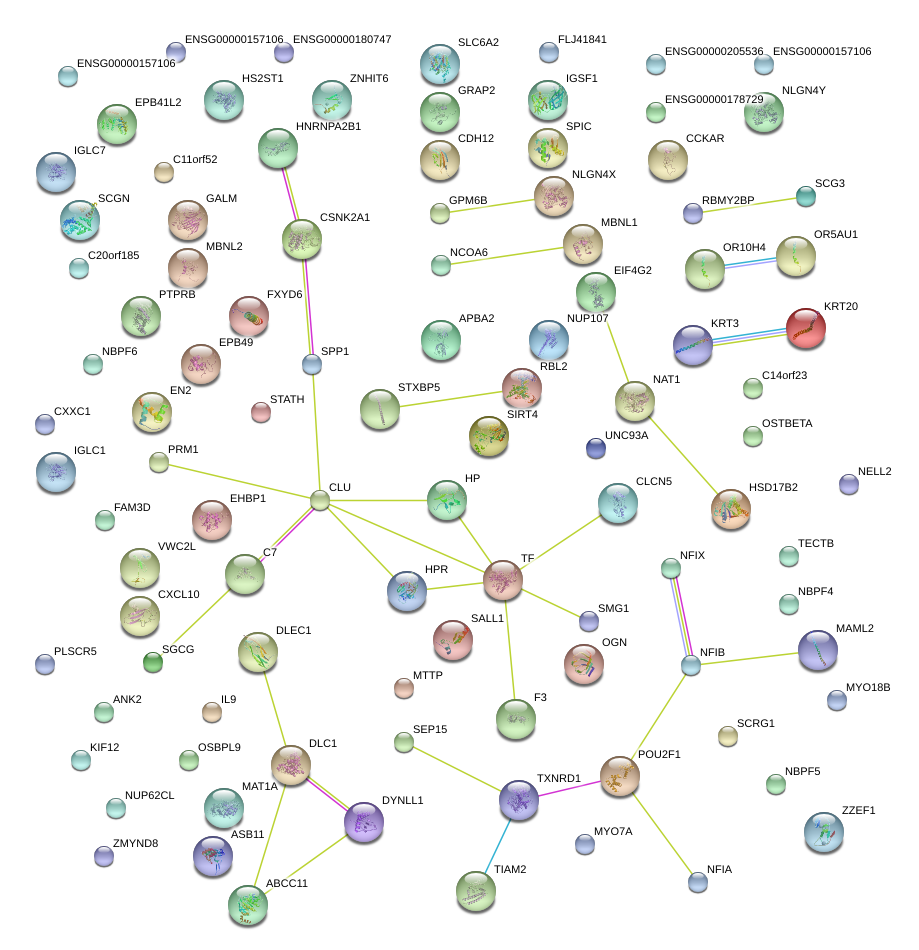
HPR
|
haptoglobin-related protein
|
|
chr16_+_70646008
|
1.262
|
NM_001126102
NM_005143
|
HP
|
haptoglobin
|
|
chr1_+_93830106
|
0.740
|
|
LOC100129046
|
hypothetical LOC100129046
|
|
chr10_-_82039158
|
0.703
|
NM_000429
|
MAT1A
|
methionine adenosyltransferase I, alpha
|
|
chr1_+_93830169
|
0.557
|
|
LOC100129046
|
hypothetical LOC100129046
|
|
chr16_-_11282595
|
0.310
|
NM_002761
|
PRM1
|
protamine 1
|
|
chr15_+_49760841
|
0.259
|
NM_001165257
NM_013243
|
SCG3
|
secretogranin III
|
|
chr11_+_111294868
|
0.229
|
|
C11orf52
|
chromosome 11 open reading frame 52
|
|
chr12_+_108035424
|
0.223
|
|
|
|
|
chr12_-_69317441
|
0.210
|
NM_001109754
|
PTPRB
|
protein tyrosine phosphatase, receptor type, B
|
|
chr6_-_131333173
|
0.204
|
|
EPB41L2
|
erythrocyte membrane protein band 4.1-like 2
|
|
chr4_+_100714995
|
0.199
|
|
MTTP
|
microsomal triglyceride transfer protein
|
|
chr6_+_167624792
|
0.197
|
NM_001143947
NM_018974
|
UNC93A
|
unc-93 homolog A (C. elegans)
|
|
chrX_-_13745134
|
0.179
|
|
GPM6B
|
glycoprotein M6B
|
|
chr8_+_21972804
|
0.178
|
|
EPB49
|
erythrocyte membrane protein band 4.9 (dematin)
|
|
chrX_+_49718954
|
0.177
|
NM_000084
|
CLCN5
|
chloride channel 5
|
|
chr6_-_48186868
|
0.173
|
|
C6orf138
|
chromosome 6 open reading frame 138
|
|
chr7_+_154943466
|
0.171
|
NM_001427
|
EN2
|
engrailed homeobox 2
|
|
chr6_+_25760352
|
0.152
|
NM_006998
|
SCGN
|
secretagogin, EF-hand calcium binding protein
|
|
chr5_-_135259403
|
0.142
|
NM_000590
|
IL9
|
interleukin 9
|
|
chr16_-_49742008
|
0.138
|
NM_001127892
|
SALL1
|
sal-like 1 (Drosophila)
|
|
chr1_+_87153025
|
0.136
|
|
HS2ST1
|
heparan sulfate 2-O-sulfotransferase 1
|
|
chr11_+_111294810
|
0.134
|
NM_080659
|
C11orf52
|
chromosome 11 open reading frame 52
|
|
chr16_-_46823682
|
0.129
|
NM_033151
|
ABCC11
|
ATP-binding cassette, sub-family C (CFTR/MRP), member 11
|
|
chrX_-_130250880
|
0.125
|
|
IGSF1
|
immunoglobulin superfamily, member 1
|
|
chr4_-_174557191
|
0.117
|
NM_007281
|
SCRG1
|
stimulator of chondrogenesis 1
|
|
chrX_-_130251068
|
0.116
|
NM_001170961
NM_001170962
NM_001555
NM_205833
|
IGSF1
|
immunoglobulin superfamily, member 1
|
|
chr2_+_62787534
|
0.115
|
NM_001142614
|
EHBP1
|
EH domain binding protein 1
|
|
chr5_+_40945315
|
0.113
|
NM_000587
|
C7
|
complement component 7
|
|
chr19_+_15920817
|
0.113
|
NM_001004465
|
OR10H4
|
olfactory receptor, family 10, subfamily H, member 4
|
|
chr15_+_63124760
|
0.110
|
NM_178859
|
OSTBETA
|
organic solute transporter beta
|
|
chr2_+_214984705
|
0.109
|
NM_001080500
|
VWC2L
|
von Willebrand factor C domain containing protein 2-like
|
|
chr16_-_18845223
|
0.105
|
NM_015092
|
SMG1
|
SMG1 homolog, phosphatidylinositol 3-kinase-related kinase (C. elegans)
|
|
chr20_-_32877029
|
0.098
|
NM_014071
|
NCOA6
|
nuclear receptor coactivator 6
|
|
chr2_+_38746742
|
0.098
|
|
GALM
|
galactose mutarotase (aldose 1-epimerase)
|
|
chr3_-_147805715
|
0.096
|
|
PLSCR5
|
phospholipid scramblase family, member 5
|
|
chr1_+_165565006
|
0.095
|
|
POU2F1
|
POU class 2 homeobox 1
|
|
chr13_+_96726415
|
0.092
|
|
MBNL2
|
muscleblind-like 2 (Drosophila)
|
|
chrX_-_106336199
|
0.090
|
NM_017681
|
NUP62CL
|
nucleoporin 62kDa C-terminal like
|
|
chr11_-_11331411
|
0.088
|
|
CSNK2A1P
|
casein kinase 2, alpha 1 polypeptide pseudogene
|
|
chr5_+_40945244
|
0.087
|
|
C7
|
complement component 7
|
|
chr1_+_165564904
|
0.087
|
NM_001198783
|
POU2F1
|
POU class 2 homeobox 1
|
|
chr1_+_51855343
|
0.085
|
|
OSBPL9
|
oxysterol binding protein-like 9
|
|
chr11_-_95715976
|
0.080
|
NM_032427
|
MAML2
|
mastermind-like 2 (Drosophila)
|
|
chr8_-_27525084
|
0.078
|
NM_001171138
|
CLU
|
clusterin
|
|
chr12_+_67366989
|
0.077
|
NM_020401
|
NUP107
|
nucleoporin 107kDa
|
|
chr4_-_26100986
|
0.077
|
NM_000730
|
CCKAR
|
cholecystokinin A receptor
|
|
chr8_+_18123456
|
0.073
|
NM_001160174
|
NAT1
|
N-acetyltransferase 1 (arylamine N-acetyltransferase)
|
|
chrX_-_15242589
|
0.072
|
NM_001012428
|
ASB11
|
ankyrin repeat and SOCS box containing 11
|
|
chr1_-_87152396
|
0.066
|
|
SEP15
|
15 kDa selenoprotein
|
|
chr8_-_27524744
|
0.065
|
NM_203339
|
CLU
|
clusterin
|
|
chr11_+_28086373
|
0.063
|
NM_001113528
NM_152636
|
METTL15
|
methyltransferase like 15
|
|
chr22_+_24468168
|
0.061
|
|
MYO18B
|
myosin XVIIIB
|
|
chr6_+_147568795
|
0.060
|
|
STXBP5
|
syntaxin binding protein 5 (tomosyn)
|
|
chr3_-_58627509
|
0.060
|
NM_138805
|
FAM3D
|
family with sequence similarity 3, member D
|
|
chr3_+_134978615
|
0.059
|
|
TF
|
transferrin
|
|
chrX_-_13745234
|
0.058
|
NM_001001995
NM_001001996
NM_005278
|
GPM6B
|
glycoprotein M6B
|
|
chr4_+_114190233
|
0.057
|
NM_001148
NM_020977
|
ANK2
|
ankyrin 2, neuronal
|
|
chr9_-_115901157
|
0.055
|
NM_138424
|
KIF12
|
kinesin family member 12
|
|
chr12_+_103206625
|
0.055
|
|
TXNRD1
|
thioredoxin reductase 1
|
|
chr1_+_61697209
|
0.054
|
|
NFIA
|
nuclear factor I/A
|
|
chr11_+_76561471
|
0.053
|
|
MYO7A
|
myosin VIIA
|
|
chr12_-_43555607
|
0.051
|
NM_001145109
|
NELL2
|
NEL-like 2 (chicken)
|
|
chr4_+_70896236
|
0.051
|
NM_001009181
NM_003154
|
STATH
|
statherin
|
|
chr1_-_87152372
|
0.050
|
|
SEP15
|
15 kDa selenoprotein
|
|
chr5_-_22248630
|
0.049
|
|
CDH12
|
cadherin 12, type 2 (N-cadherin 2)
|
|
chr1_+_51855133
|
0.048
|
NM_024586
NM_148906
NM_148908
NM_148909
|
OSBPL9
|
oxysterol binding protein-like 9
|
|
chr16_+_80626459
|
0.047
|
|
HSD17B2
|
hydroxysteroid (17-beta) dehydrogenase 2
|
|
chr17_-_36294962
|
0.047
|
NM_019010
|
KRT20
|
keratin 20
|
|
chr10_+_114033403
|
0.047
|
NM_058222
|
TECTB
|
tectorin beta
|
|
chr5_-_79982584
|
0.045
|
NM_001190470
|
MTRNR2L2
|
MT-RNR2-like 2
|
|
chrX_-_13745108
|
0.044
|
|
GPM6B
|
glycoprotein M6B
|
|
chr1_+_108794426
|
0.044
|
NM_001143987
NM_001143988
|
NBPF4
NBPF6
|
neuroblastoma breakpoint family, member 4
neuroblastoma breakpoint family, member 6
|
|
chr22_+_38652555
|
0.044
|
|
GRAP2
|
GRB2-related adaptor protein 2
|
|
chr9_-_94206648
|
0.043
|
NM_014057
NM_033014
|
OGN
|
osteoglycin
|
|
chr1_-_85946676
|
0.041
|
NM_001170670
NM_017953
|
ZNHIT6
|
zinc finger, HIT-type containing 6
|
|
chr6_+_155579788
|
0.039
|
NM_001010927
|
TIAM2
|
T-cell lymphoma invasion and metastasis 2
|
|
chr1_-_87152596
|
0.039
|
NM_004261
NM_203341
|
SEP15
|
15 kDa selenoprotein
|
|
chr15_+_27001131
|
0.038
|
NM_001130414
NM_005503
|
APBA2
|
amyloid beta (A4) precursor protein-binding, family A, member 2
|
|
chr20_-_45360903
|
0.038
|
|
ZMYND8
|
zinc finger, MYND-type containing 8
|
|
chrX_-_6156655
|
0.037
|
NM_181332
|
NLGN4X
|
neuroligin 4, X-linked
|
|
chrX_-_135783496
|
0.037
|
|
|
|
|
chr20_+_31106797
|
0.037
|
NM_182658
|
C20orf185
|
chromosome 20 open reading frame 185
|
|
chr14_+_28311740
|
0.037
|
|
C14orf23
|
chromosome 14 open reading frame 23
|
|
chr12_+_119224506
|
0.036
|
NM_012240
|
SIRT4
|
sirtuin 4
|
|
chr4_+_89115825
|
0.036
|
NM_000582
NM_001040058
NM_001040060
|
SPP1
|
secreted phosphoprotein 1
|
|
chr3_+_153499883
|
0.035
|
NM_207293
NM_207294
NM_207295
NM_207296
NM_207297
|
MBNL1
|
muscleblind-like (Drosophila)
|
|
chr11_-_117253354
|
0.035
|
NM_001164831
|
FXYD6
|
FXYD domain containing ion transport regulator 6
|
|
chr16_+_52037186
|
0.035
|
|
RBL2
|
retinoblastoma-like 2 (p130)
|
|
chr14_-_20694023
|
0.034
|
NM_001004731
|
OR5AU1
|
olfactory receptor, family 5, subfamily AU, member 1
|
|
chr7_-_26198673
|
0.034
|
|
HNRNPA2B1
|
heterogeneous nuclear ribonucleoprotein A2/B1
|
|
chr2_-_133256097
|
0.034
|
|
NCKAP5
|
NCK-associated protein 5
|
|
chr8_+_7340777
|
0.033
|
NM_001037668
NM_001040705
|
DEFB107A
DEFB107B
|
defensin, beta 107A
defensin, beta 107B
|
|
chr8_-_59575249
|
0.033
|
NM_000780
|
CYP7A1
|
cytochrome P450, family 7, subfamily A, polypeptide 1
|
|
chr6_-_155818728
|
0.032
|
NM_015718
|
NOX3
|
NADPH oxidase 3
|
|
chr9_+_102380156
|
0.031
|
NM_001018116
|
MURC
|
muscle-related coiled-coil protein
|
|
chr11_+_123600553
|
0.031
|
NM_001007249
|
OR8G2
|
olfactory receptor, family 8, subfamily G, member 2
|
|
chr3_-_120861959
|
0.031
|
NM_022135
|
POPDC2
|
popeye domain containing 2
|
|
chr2_-_138762909
|
0.030
|
|
|
|
|
chr11_-_28086277
|
0.030
|
NM_031217
|
KIF18A
|
kinesin family member 18A
|
|
chr19_+_59941785
|
0.030
|
NM_015868
|
KIR2DS2
KIR2DL3
|
killer cell immunoglobulin-like receptor, two domains, short cytoplasmic tail, 2
killer cell immunoglobulin-like receptor, two domains, long cytoplasmic tail, 3
|
|
chr7_+_80113570
|
0.028
|
NM_001127443
NM_001127444
|
CD36
|
CD36 molecule (thrombospondin receptor)
|
|
chr12_+_8557402
|
0.028
|
NM_080387
|
CLEC4D
|
C-type lectin domain family 4, member D
|
|
chr1_+_97033103
|
0.028
|
|
|
|
|
chr20_+_18070867
|
0.027
|
NM_020536
|
CSRP2BP
|
CSRP2 binding protein
|
|
chr1_+_202033273
|
0.027
|
NM_001174108
|
ZBED6
|
zinc finger, BED-type containing 6
|
|
chr2_+_178893216
|
0.026
|
NM_145739
|
OSBPL6
|
oxysterol binding protein-like 6
|
|
chr17_+_8154864
|
0.026
|
NM_025014
|
ARHGEF15
|
Rho guanine nucleotide exchange factor (GEF) 15
|
|
chr3_-_196792059
|
0.026
|
|
APOD
|
apolipoprotein D
|
|
chr5_+_180399830
|
0.026
|
NM_152547
|
BTNL9
|
butyrophilin-like 9
|
|
chr5_+_180399871
|
0.024
|
|
BTNL9
|
butyrophilin-like 9
|
|
chr2_-_215951161
|
0.024
|
|
FN1
|
fibronectin 1
|
|
chr3_+_122769467
|
0.024
|
NM_001012659
|
ARGFX
|
arginine-fifty homeobox
|
|
chrX_-_13744933
|
0.023
|
|
GPM6B
|
glycoprotein M6B
|
|
chr1_-_89230844
|
0.021
|
|
RBMXL1
CCBL2
|
RNA binding motif protein, X-linked-like 1
cysteine conjugate-beta lyase 2
|
|
chr17_-_33602374
|
0.020
|
NM_032258
|
TBC1D3C
TBC1D3G
TBC1D3
TBC1D3F
|
TBC1 domain family, member 3C
TBC1 domain family, member 3G
TBC1 domain family, member 3
TBC1 domain family, member 3F
|
|
chr3_-_109730858
|
0.020
|
NM_014981
|
MYH15
|
myosin, heavy chain 15
|
|
chr6_-_50097606
|
0.020
|
NM_001037497
NM_001037728
|
DEFB110
|
defensin, beta 110 locus
|
|
chrX_-_148604506
|
0.020
|
NM_001011544
|
MAGEA11
|
melanoma antigen family A, 11
|
|
chr4_+_77575276
|
0.019
|
NM_020859
|
SHROOM3
|
shroom family member 3
|
|
chr6_-_31954795
|
0.018
|
NM_001178044
NM_025257
|
SLC44A4
|
solute carrier family 44, member 4
|
|
chr11_+_55617328
|
0.018
|
NM_001003750
|
OR8I2
|
olfactory receptor, family 8, subfamily I, member 2
|
|
chr11_-_4827013
|
0.018
|
NM_001004758
|
OR51S1
|
olfactory receptor, family 51, subfamily S, member 1
|
|
chr9_+_122923864
|
0.018
|
|
CEP110
|
centrosomal protein 110kDa
|
|
chr21_-_38792173
|
0.018
|
NM_001136155
NM_182918
|
ERG
|
v-ets erythroblastosis virus E26 oncogene homolog (avian)
|
|
chr20_+_4650499
|
0.018
|
NM_012409
|
PRND
|
prion protein 2 (dublet)
|
|
chr10_-_45350804
|
0.017
|
NM_001002266
|
MARCH8
|
membrane-associated ring finger (C3HC4) 8
|
|
chr7_-_72761367
|
0.017
|
|
STX1A
|
syntaxin 1A (brain)
|
|
chr6_+_101953581
|
0.016
|
NM_001166247
NM_021956
NM_175768
|
GRIK2
|
glutamate receptor, ionotropic, kainate 2
|
|
chr3_-_15538164
|
0.016
|
NM_005677
NM_080539
|
COLQ
|
collagen-like tail subunit (single strand of homotrimer) of asymmetric acetylcholinesterase
|
|
chr18_+_59571256
|
0.016
|
NM_001040147
|
SERPINB7
|
serpin peptidase inhibitor, clade B (ovalbumin), member 7
|
|
chr22_+_38075703
|
0.015
|
NM_004711
NM_145731
|
SYNGR1
|
synaptogyrin 1
|
|
chr2_-_18634257
|
0.015
|
NM_001002006
NM_033253
|
NT5C1B-RDH14
NT5C1B
|
NT5C1B-RDH14 readthrough
5'-nucleotidase, cytosolic IB
|
|
chr17_+_8154280
|
0.014
|
NM_173728
|
ARHGEF15
|
Rho guanine nucleotide exchange factor (GEF) 15
|
|
chr9_-_139262009
|
0.014
|
NM_001001710
|
FAM166A
|
family with sequence similarity 166, member A
|
|
chr17_-_34209671
|
0.014
|
NM_003559
|
PIP4K2B
|
phosphatidylinositol-5-phosphate 4-kinase, type II, beta
|
|
chrX_-_76823813
|
0.014
|
|
|
|
|
chr7_+_80105907
|
0.014
|
|
CD36
|
CD36 molecule (thrombospondin receptor)
|
|
chrX_+_50670474
|
0.014
|
NM_005448
|
BMP15
|
bone morphogenetic protein 15
|
|
chr5_-_169657312
|
0.013
|
|
LCP2
|
lymphocyte cytosolic protein 2 (SH2 domain containing leukocyte protein of 76kDa)
|
|
chr20_-_1257809
|
0.013
|
NM_080489
|
SDCBP2
|
syndecan binding protein (syntenin) 2
|
|
chr12_+_97513644
|
0.012
|
|
SLC25A3
|
solute carrier family 25 (mitochondrial carrier; phosphate carrier), member 3
|
|
chr16_-_29514140
|
0.012
|
|
|
|
|
chr2_+_108571177
|
0.012
|
NM_004987
|
LIMS1
|
LIM and senescent cell antigen-like domains 1
|
|
chr11_+_55776251
|
0.012
|
NM_001004747
|
OR5T3
|
olfactory receptor, family 5, subfamily T, member 3
|
|
chr8_+_124264054
|
0.012
|
|
FAM83A
|
family with sequence similarity 83, member A
|
|
chrX_+_52797004
|
0.011
|
NM_003147
NM_175698
NM_001164417
|
SSX2
SSX2B
|
synovial sarcoma, X breakpoint 2
synovial sarcoma, X breakpoint 2B
|
|
chr2_-_157890400
|
0.011
|
NM_020711
|
ERMN
|
ermin, ERM-like protein
|
|
chr17_-_1195096
|
0.011
|
|
PAFAH1B1
|
platelet-activating factor acetylhydrolase 1b, regulatory subunit 1 (45kDa)
|
|
chr12_+_10351683
|
0.011
|
NM_002262
NM_007334
|
KLRD1
|
killer cell lectin-like receptor subfamily D, member 1
|
|
chr11_-_49960646
|
0.011
|
NM_001005270
|
OR4C12
|
olfactory receptor, family 4, subfamily C, member 12
|
|
chr10_+_83627422
|
0.011
|
NM_001165973
|
NRG3
|
neuregulin 3
|
|
chr12_-_43556220
|
0.010
|
|
NELL2
|
NEL-like 2 (chicken)
|
|
chr3_-_155630197
|
0.010
|
NM_001038705
|
GPR149
|
G protein-coupled receptor 149
|
|
chr2_-_200033445
|
0.010
|
|
SATB2
|
SATB homeobox 2
|
|
chr16_-_27806978
|
0.010
|
NM_144675
|
GSG1L
|
GSG1-like
|
|
chr1_-_31117948
|
0.009
|
|
SDC3
|
syndecan 3
|
|
chr10_+_102212787
|
0.009
|
NM_003393
|
WNT8B
|
wingless-type MMTV integration site family, member 8B
|
|
chr17_-_36276987
|
0.009
|
NM_000223
|
KRT12
|
keratin 12
|
|
chr19_+_54299686
|
0.008
|
|
SNRNP70
|
small nuclear ribonucleoprotein 70kDa (U1)
|
|
chr4_-_185963859
|
0.008
|
|
ACSL1
|
acyl-CoA synthetase long-chain family member 1
|
|
chr6_+_101953389
|
0.007
|
|
GRIK2
|
glutamate receptor, ionotropic, kainate 2
|
|
chr6_+_152168500
|
0.007
|
NM_001122741
|
ESR1
|
estrogen receptor 1
|
|
chr4_+_187385618
|
0.007
|
NM_000892
|
KLKB1
|
kallikrein B, plasma (Fletcher factor) 1
|
|
chr2_+_108571209
|
0.007
|
|
LIMS1
|
LIM and senescent cell antigen-like domains 1
|
|
chr7_+_80105718
|
0.007
|
NM_000072
NM_001001548
|
CD36
|
CD36 molecule (thrombospondin receptor)
|
|
chr11_-_57054756
|
0.006
|
NM_012456
|
TIMM10
|
translocase of inner mitochondrial membrane 10 homolog (yeast)
|
|
chr5_-_125956996
|
0.006
|
|
ALDH7A1
|
aldehyde dehydrogenase 7 family, member A1
|
|
chr2_+_119416214
|
0.006
|
NM_006770
|
MARCO
|
macrophage receptor with collagenous structure
|
|
chr19_+_15713200
|
0.006
|
NM_013938
|
OR10H3
|
olfactory receptor, family 10, subfamily H, member 3
|
|
chr3_-_150533948
|
0.005
|
NM_001184723
NM_138786
|
TM4SF18
|
transmembrane 4 L six family member 18
|
|
chr19_+_56990222
|
0.005
|
NM_002030
|
FPR3
|
formyl peptide receptor 3
|
|
chr5_-_58918031
|
0.005
|
NM_006203
|
PDE4D
|
phosphodiesterase 4D, cAMP-specific
|
|
chr22_+_29696662
|
0.005
|
|
|
|
|
chr12_-_10433852
|
0.005
|
NM_007360
|
KLRK1
|
killer cell lectin-like receptor subfamily K, member 1
|
|
chr12_+_9925354
|
0.005
|
NM_001190765
|
KLRF2
|
killer cell lectin-like receptor subfamily F, member 2
|
|
chr17_-_31831093
|
0.004
|
NM_001123392
NM_032258
|
TBC1D3C
TBC1D3G
TBC1D3
TBC1D3H
TBC1D3F
|
TBC1 domain family, member 3C
TBC1 domain family, member 3G
TBC1 domain family, member 3
TBC1 domain family, member 3H
TBC1 domain family, member 3F
|
|
chr17_-_33552166
|
0.002
|
NM_001123391
NM_032258
|
TBC1D3C
TBC1D3G
TBC1D3
TBC1D3F
|
TBC1 domain family, member 3C
TBC1 domain family, member 3G
TBC1 domain family, member 3
TBC1 domain family, member 3F
|
|
chr10_+_35934343
|
0.002
|
NM_153368
|
GJD4
|
gap junction protein, delta 4, 40.1kDa
|
|
chrX_-_48156287
|
0.002
|
NM_001034832
NM_001040612
NM_005636
NM_175729
|
SSX4B
SSX4
|
synovial sarcoma, X breakpoint 4B
synovial sarcoma, X breakpoint 4
|
|
chr10_-_79298876
|
0.001
|
|
DLG5
|
discs, large homolog 5 (Drosophila)
|
|
chr17_-_31528027
|
0.001
|
NM_001001417
|
TBC1D3B
TBC1D3C
TBC1D3G
TBC1D3F
|
TBC1 domain family, member 3B
TBC1 domain family, member 3C
TBC1 domain family, member 3G
TBC1 domain family, member 3F
|
|
chrX_+_36163971
|
0.001
|
NM_001098843
|
CXorf30
|
chromosome X open reading frame 30
|
|
chr20_-_43577677
|
0.001
|
NM_006652
|
SPINT3
|
serine peptidase inhibitor, Kunitz type, 3
|
|
chr22_-_48865907
|
0.000
|
NM_139202
|
MLC1
|
megalencephalic leukoencephalopathy with subcortical cysts 1
|