|
chr6_+_105511615
|
1.610
|
NM_001004317
|
LIN28B
|
lin-28 homolog B (C. elegans)
|
|
chr5_-_78317444
|
1.549
|
NM_198709
|
ARSB
|
arylsulfatase B
|
|
chr3_+_152970904
|
1.518
|
|
LOC201651
|
arylacetamide deacetylase (esterase) pseudogene
|
|
chr13_+_45174446
|
1.472
|
NM_152719
|
SPERT
|
spermatid associated
|
|
chr2_-_88208650
|
1.461
|
NM_001443
|
FABP1
|
fatty acid binding protein 1, liver
|
|
chr5_-_78318112
|
1.439
|
NM_000046
|
ARSB
|
arylsulfatase B
|
|
chr8_-_17797127
|
1.363
|
NM_147203
NM_201553
NM_004467
NM_201552
|
FGL1
|
fibrinogen-like 1
|
|
chr6_+_167456230
|
1.345
|
NM_031409
|
CCR6
|
chemokine (C-C motif) receptor 6
|
|
chr21_+_41663853
|
1.237
|
|
MX2
|
myxovirus (influenza virus) resistance 2 (mouse)
|
|
chr12_-_101835183
|
1.215
|
|
PAH
|
phenylalanine hydroxylase
|
|
chr2_+_143351536
|
1.211
|
NM_001032998
NM_003937
|
KYNU
|
kynureninase
|
|
chr1_+_149877955
|
1.193
|
|
SNX27
|
sorting nexin family member 27
|
|
chr12_-_49076658
|
1.157
|
NM_001145475
|
FAM186A
|
family with sequence similarity 186, member A
|
|
chr11_+_59564323
|
1.115
|
NM_173801
|
PLAC1L
|
placenta-specific 1-like
|
|
chr13_-_45654292
|
1.080
|
|
LCP1
|
lymphocyte cytosolic protein 1 (L-plastin)
|
|
chr3_+_123779122
|
1.079
|
NM_001113523
|
PARP15
|
poly (ADP-ribose) polymerase family, member 15
|
|
chr5_-_41249270
|
1.073
|
NM_000065
|
C6
|
complement component 6
|
|
chr6_-_149847809
|
1.007
|
NM_207360
|
ZC3H12D
|
zinc finger CCCH-type containing 12D
|
|
chr19_-_53081326
|
1.001
|
|
SULT2A1
|
sulfotransferase family, cytosolic, 2A, dehydroepiandrosterone (DHEA)-preferring, member 1
|
|
chr2_+_37282516
|
0.996
|
|
LOC100505876
|
hypothetical LOC100505876
|
|
chr6_-_33149244
|
0.995
|
NM_033554
|
HLA-DPA1
|
major histocompatibility complex, class II, DP alpha 1
|
|
chr4_-_110942783
|
0.986
|
NM_000204
|
CFI
|
complement factor I
|
|
chrX_-_30505804
|
0.959
|
NM_025159
|
CXorf21
|
chromosome X open reading frame 21
|
|
chr6_+_132000134
|
0.955
|
NM_005021
|
ENPP3
|
ectonucleotide pyrophosphatase/phosphodiesterase 3
|
|
chr13_-_45654296
|
0.954
|
|
LCP1
|
lymphocyte cytosolic protein 1 (L-plastin)
|
|
chr17_-_36418869
|
0.952
|
NM_031958
|
KRTAP3-1
|
keratin associated protein 3-1
|
|
chr6_-_32742265
|
0.941
|
NM_002123
|
HLA-DQB1
|
major histocompatibility complex, class II, DQ beta 1
|
|
chr21_-_14840506
|
0.938
|
NM_022136
|
SAMSN1
|
SAM domain, SH3 domain and nuclear localization signals 1
|
|
chr1_-_1701313
|
0.934
|
NM_001198994
|
NADK
|
NAD kinase
|
|
chr19_-_53444733
|
0.903
|
NM_001184901
NM_001184903
NM_014959
|
CARD8
|
caspase recruitment domain family, member 8
|
|
chr6_-_149847718
|
0.859
|
|
ZC3H12D
|
zinc finger CCCH-type containing 12D
|
|
chr4_+_74500748
|
0.858
|
|
ALB
|
albumin
|
|
chr6_-_26038817
|
0.822
|
NM_005835
|
SLC17A2
|
solute carrier family 17 (sodium phosphate), member 2
|
|
chr19_+_47073029
|
0.803
|
NM_001783
NM_021601
|
CD79A
|
CD79a molecule, immunoglobulin-associated alpha
|
|
chr13_-_45654327
|
0.803
|
NM_002298
|
LCP1
|
lymphocyte cytosolic protein 1 (L-plastin)
|
|
chr3_-_122862447
|
0.788
|
NM_005335
|
HCLS1
|
hematopoietic cell-specific Lyn substrate 1
|
|
chr1_-_167822248
|
0.787
|
|
F5
|
coagulation factor V (proaccelerin, labile factor)
|
|
chrX_-_2892288
|
0.783
|
NM_000047
|
ARSE
|
arylsulfatase E (chondrodysplasia punctata 1)
|
|
chr16_-_28528149
|
0.767
|
NM_177530
NM_177534
|
SULT1A1
|
sulfotransferase family, cytosolic, 1A, phenol-preferring, member 1
|
|
chrX_+_105823723
|
0.742
|
NM_024539
|
RNF128
|
ring finger protein 128
|
|
chr1_-_246869181
|
0.718
|
NM_001001827
|
OR2T35
|
olfactory receptor, family 2, subfamily T, member 35
|
|
chr6_+_64344307
|
0.708
|
|
PTP4A1
|
protein tyrosine phosphatase type IVA, member 1
|
|
chr16_-_28528780
|
0.706
|
NM_001055
NM_177529
|
SULT1A1
|
sulfotransferase family, cytosolic, 1A, phenol-preferring, member 1
|
|
chr12_+_111829191
|
0.703
|
|
OAS1
|
2',5'-oligoadenylate synthetase 1, 40/46kDa
|
|
chr7_-_44985175
|
0.703
|
|
MYO1G
|
myosin IG
|
|
chr17_-_38385511
|
0.701
|
NM_025267
|
AARSD1
|
alanyl-tRNA synthetase domain containing 1
|
|
chr7_-_44985084
|
0.693
|
|
MYO1G
|
myosin IG
|
|
chr4_+_74520796
|
0.681
|
NM_001134
|
AFP
|
alpha-fetoprotein
|
|
chr1_+_84646621
|
0.670
|
NM_058248
|
DNASE2B
|
deoxyribonuclease II beta
|
|
chr7_-_44985202
|
0.664
|
NM_033054
|
MYO1G
|
myosin IG
|
|
chr4_+_74488910
|
0.660
|
|
ALB
|
albumin
|
|
chr4_+_74488947
|
0.652
|
|
ALB
|
albumin
|
|
chr12_-_101835026
|
0.651
|
|
PAH
|
phenylalanine hydroxylase
|
|
chr3_-_122862391
|
0.635
|
|
HCLS1
|
hematopoietic cell-specific Lyn substrate 1
|
|
chr12_-_85756766
|
0.627
|
NM_013244
|
MGAT4C
|
mannosyl (alpha-1,3-)-glycoprotein beta-1,4-N-acetylglucosaminyltransferase, isozyme C (putative)
|
|
chr6_+_32515596
|
0.622
|
NM_019111
|
HLA-DRA
|
major histocompatibility complex, class II, DR alpha
|
|
chr3_-_172227152
|
0.606
|
|
SLC2A2
|
solute carrier family 2 (facilitated glucose transporter), member 2
|
|
chr1_+_13903936
|
0.604
|
NM_012231
NM_015866
|
PRDM2
|
PR domain containing 2, with ZNF domain
|
|
chr13_-_45577144
|
0.601
|
NM_001872
NM_016413
|
CPB2
|
carboxypeptidase B2 (plasma)
|
|
chr14_+_20595820
|
0.598
|
NM_138331
|
RNASE8
|
ribonuclease, RNase A family, 8
|
|
chr3_-_198784590
|
0.594
|
NM_203315
|
BDH1
|
3-hydroxybutyrate dehydrogenase, type 1
|
|
chr1_-_41399632
|
0.592
|
NM_001031694
|
SCMH1
|
sex comb on midleg homolog 1 (Drosophila)
|
|
chr6_+_31647854
|
0.578
|
NM_001159740
|
LTA
|
lymphotoxin alpha (TNF superfamily, member 1)
|
|
chr4_+_100714995
|
0.571
|
|
MTTP
|
microsomal triglyceride transfer protein
|
|
chr4_-_186934059
|
0.568
|
NM_001145673
|
SORBS2
|
sorbin and SH3 domain containing 2
|
|
chr10_-_73953699
|
0.568
|
NM_001195519
|
CBARA1
|
calcium binding atopy-related autoantigen 1
|
|
chr1_+_178232379
|
0.555
|
|
CEP350
|
centrosomal protein 350kDa
|
|
chr9_-_122852356
|
0.552
|
NM_001735
|
C5
|
complement component 5
|
|
chr12_+_111829121
|
0.547
|
NM_001032409
NM_002534
NM_016816
|
OAS1
|
2',5'-oligoadenylate synthetase 1, 40/46kDa
|
|
chr3_-_172227223
|
0.547
|
|
SLC2A2
|
solute carrier family 2 (facilitated glucose transporter), member 2
|
|
chr1_+_12046020
|
0.546
|
NM_001243
|
TNFRSF8
|
tumor necrosis factor receptor superfamily, member 8
|
|
chr4_+_74488835
|
0.540
|
NM_000477
|
ALB
|
albumin
|
|
chr13_+_110653407
|
0.539
|
|
ARHGEF7
|
Rho guanine nucleotide exchange factor (GEF) 7
|
|
chr9_-_70780574
|
0.537
|
|
|
|
|
chr11_+_30209138
|
0.533
|
NM_000510
NM_001018080
|
FSHB
|
follicle stimulating hormone, beta polypeptide
|
|
chr4_-_83566045
|
0.529
|
|
|
|
|
chr19_-_45141473
|
0.520
|
|
LOC440525
PRR13
|
proline rich 13 pseudogene
proline rich 13
|
|
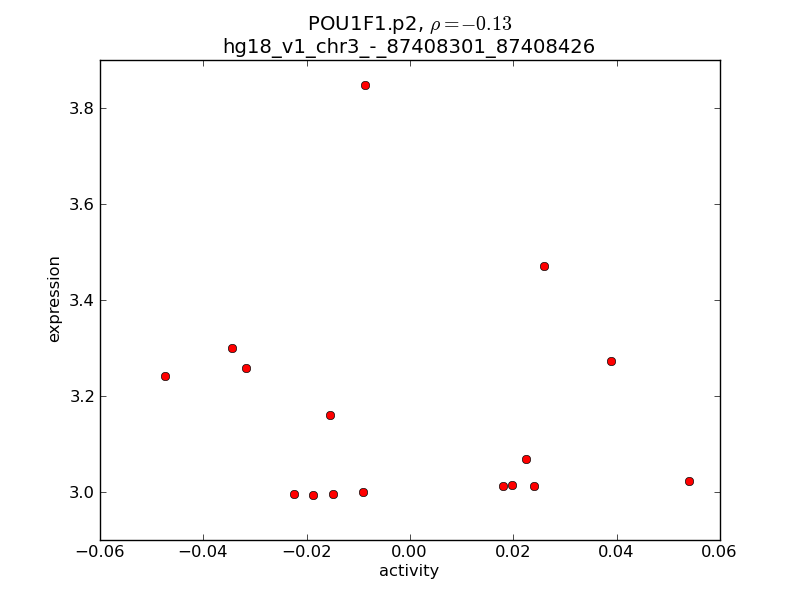
chr1_+_165565006
|
0.519
|
|
POU2F1
|
POU class 2 homeobox 1
|
|
chr1_-_159546348
|
0.506
|
NM_000530
|
MPZ
|
myelin protein zero
|
|
chr22_-_25205376
|
0.504
|
NM_152841
|
HPS4
|
Hermansky-Pudlak syndrome 4
|
|
chr5_+_137701122
|
0.500
|
NM_001135647
|
FAM53C
|
family with sequence similarity 53, member C
|
|
chr15_-_75259714
|
0.496
|
|
PEAK1
|
NKF3 kinase family member
|
|
chr1_+_246682699
|
0.495
|
NM_001004136
|
OR2T2
|
olfactory receptor, family 2, subfamily T, member 2
|
|
chr17_+_3324096
|
0.493
|
NM_001128085
|
ASPA
|
aspartoacylase
|
|
chr8_-_42742729
|
0.486
|
NM_004198
|
CHRNA6
|
cholinergic receptor, nicotinic, alpha 6
|
|
chr6_-_76022565
|
0.481
|
|
TMEM30A
|
transmembrane protein 30A
|
|
chr3_-_147805715
|
0.480
|
|
PLSCR5
|
phospholipid scramblase family, member 5
|
|
chr2_-_230798687
|
0.478
|
NM_001185015
|
SP110
|
SP110 nuclear body protein
|
|
chr11_-_102250876
|
0.477
|
NM_002426
|
MMP12
|
matrix metallopeptidase 12 (macrophage elastase)
|
|
chr11_+_89507465
|
0.473
|
NM_005467
|
NAALAD2
|
N-acetylated alpha-linked acidic dipeptidase 2
|
|
chr18_-_38949481
|
0.468
|
NM_002930
|
RIT2
|
Ras-like without CAAX 2
|
|
chr8_-_17811750
|
0.468
|
|
FGL1
|
fibrinogen-like 1
|
|
chr2_+_68445936
|
0.466
|
|
PLEK
|
pleckstrin
|
|
chr15_-_32398220
|
0.458
|
NM_005135
|
SLC12A6
|
solute carrier family 12 (potassium/chloride transporters), member 6
|
|
chr2_+_102136833
|
0.451
|
NM_000877
|
IL1R1
|
interleukin 1 receptor, type I
|
|
chr16_+_68156497
|
0.438
|
NM_001113178
NM_006599
NM_138713
NM_138714
NM_173214
|
NFAT5
|
nuclear factor of activated T-cells 5, tonicity-responsive
|
|
chr5_+_68703036
|
0.437
|
NM_133339
|
RAD17
|
RAD17 homolog (S. pombe)
|
|
chr3_+_123256902
|
0.435
|
NM_175862
|
CD86
|
CD86 molecule
|
|
chr3_+_188197029
|
0.433
|
|
|
|
|
chr6_-_109795925
|
0.432
|
|
CD164
|
CD164 molecule, sialomucin
|
|
chr3_+_82117978
|
0.426
|
|
|
|
|
chr17_+_7900926
|
0.417
|
|
|
|
|
chr1_-_158815895
|
0.414
|
NM_001184879
NM_001184881
NM_001184882
NM_003874
|
CD84
|
CD84 molecule
|
|
chr6_-_48186868
|
0.411
|
|
C6orf138
|
chromosome 6 open reading frame 138
|
|
chr18_+_59726183
|
0.401
|
|
SERPINB10
|
serpin peptidase inhibitor, clade B (ovalbumin), member 10
|
|
chr6_-_33028790
|
0.400
|
NM_006120
|
HLA-DMA
|
major histocompatibility complex, class II, DM alpha
|
|
chr17_-_15463742
|
0.394
|
NM_006382
|
CDRT1
|
CMT1A duplicated region transcript 1
|
|
chr4_+_88076418
|
0.392
|
|
|
|
|
chr6_-_32665409
|
0.388
|
NM_002124
|
HLA-DRB1
HLA-DRB4
HLA-DRB5
|
major histocompatibility complex, class II, DR beta 1
major histocompatibility complex, class II, DR beta 4
major histocompatibility complex, class II, DR beta 5
|
|
chrX_-_39921525
|
0.384
|
NM_001123383
NM_001123384
|
BCOR
|
BCL6 corepressor
|
|
chr19_-_42355172
|
0.381
|
NM_199126
|
ZNF585A
|
zinc finger protein 585A
|
|
chr3_-_113334657
|
0.379
|
NM_001190259
NM_001190260
NM_152785
|
GCET2
|
germinal center expressed transcript 2
|
|
chr7_+_137411717
|
0.377
|
NM_001190906
NM_001190907
NM_005989
|
AKR1D1
|
aldo-keto reductase family 1, member D1 (delta 4-3-ketosteroid-5-beta-reductase)
|
|
chr21_-_42659671
|
0.377
|
NM_003225
|
TFF1
|
trefoil factor 1
|
|
chr12_+_9925354
|
0.376
|
NM_001190765
|
KLRF2
|
killer cell lectin-like receptor subfamily F, member 2
|
|
chr6_-_41276901
|
0.375
|
NM_024807
|
TREML2
|
triggering receptor expressed on myeloid cells-like 2
|
|
chr15_+_64481270
|
0.372
|
|
MAP2K1
|
mitogen-activated protein kinase kinase 1
|
|
chr4_+_141484046
|
0.371
|
NM_001153446
NM_001153635
NM_001153585
NM_001153690
|
SCOC
|
short coiled-coil protein
|
|
chr3_-_186752952
|
0.371
|
NM_139248
|
LIPH
|
lipase, member H
|
|
chr12_-_9777126
|
0.369
|
NM_172004
|
CLECL1
|
C-type lectin-like 1
|
|
chr16_+_11966464
|
0.367
|
NM_001192
|
TNFRSF17
|
tumor necrosis factor receptor superfamily, member 17
|
|
chr2_-_242205556
|
0.361
|
NM_001164356
|
THAP4
|
THAP domain containing 4
|
|
chr2_+_11600238
|
0.357
|
|
GREB1
|
growth regulation by estrogen in breast cancer 1
|
|
chr17_-_36232366
|
0.355
|
NM_000421
|
KRT10
|
keratin 10
|
|
chr4_+_69716298
|
0.354
|
NM_001075
NM_001144767
|
UGT2B10
|
UDP glucuronosyltransferase 2 family, polypeptide B10
|
|
chrX_+_14813333
|
0.351
|
NM_001177475
|
MOSPD2
|
motile sperm domain containing 2
|
|
chr14_-_72523404
|
0.348
|
NM_178441
|
ZFYVE1
|
zinc finger, FYVE domain containing 1
|
|
chrX_-_19727828
|
0.344
|
NM_001024666
|
SH3KBP1
|
SH3-domain kinase binding protein 1
|
|
chr2_-_6924092
|
0.340
|
|
CMPK2
|
cytidine monophosphate (UMP-CMP) kinase 2, mitochondrial
|
|
chr12_+_91341865
|
0.340
|
NM_001025233
|
CLLU1
|
chronic lymphocytic leukemia up-regulated 1
|
|
chrX_-_131375217
|
0.338
|
NM_001170701
NM_001170702
NM_001170703
|
MBNL3
|
muscleblind-like 3 (Drosophila)
|
|
chr10_+_97505398
|
0.336
|
NM_001164178
NM_001164181
NM_001164179
NM_001164182
NM_001164183
NM_001776
|
ENTPD1
|
ectonucleoside triphosphate diphosphohydrolase 1
|
|
chr7_-_36991189
|
0.336
|
NM_001039459
|
ELMO1
|
engulfment and cell motility 1
|
|
chr4_-_70115037
|
0.334
|
NM_001073
|
UGT2B11
|
UDP glucuronosyltransferase 2 family, polypeptide B11
|
|
chr1_+_205344200
|
0.334
|
NM_000715
|
C4BPA
|
complement component 4 binding protein, alpha
|
|
chr6_-_22405708
|
0.331
|
NM_000948
|
PRL
|
prolactin
|
|
chr6_+_32713160
|
0.331
|
NM_002122
|
HLA-DQA1
|
major histocompatibility complex, class II, DQ alpha 1
|
|
chr3_-_27473248
|
0.329
|
NM_003615
|
SLC4A7
|
solute carrier family 4, sodium bicarbonate cotransporter, member 7
|
|
chr13_+_23742846
|
0.329
|
|
SPATA13
|
spermatogenesis associated 13
|
|
chr4_-_77547481
|
0.326
|
NM_001042784
|
CCDC158
|
coiled-coil domain containing 158
|
|
chr10_+_91488704
|
0.325
|
|
KIF20B
|
kinesin family member 20B
|
|
chr4_-_83566246
|
0.325
|
|
HNRPDL
|
heterogeneous nuclear ribonucleoprotein D-like
|
|
chr2_+_24660849
|
0.325
|
NM_003743
NM_147223
NM_147233
|
NCOA1
|
nuclear receptor coactivator 1
|
|
chr12_+_94200306
|
0.324
|
|
VEZT
|
vezatin, adherens junctions transmembrane protein
|
|
chr22_+_42908102
|
0.323
|
NM_022141
|
PARVG
|
parvin, gamma
|
|
chr11_-_4346191
|
0.322
|
NM_001005161
|
OR52B4
|
olfactory receptor, family 52, subfamily B, member 4
|
|
chr14_+_38772870
|
0.322
|
NM_054024
|
MIA2
|
melanoma inhibitory activity 2
|
|
chr12_-_11041740
|
0.321
|
NM_176889
|
TAS2R20
|
taste receptor, type 2, member 20
|
|
chr6_-_66473790
|
0.319
|
NM_001142800
NM_001142801
|
EYS
|
eyes shut homolog (Drosophila)
|
|
chr5_+_156628929
|
0.318
|
NM_014376
|
CYFIP2
|
cytoplasmic FMR1 interacting protein 2
|
|
chr9_+_101717278
|
0.318
|
|
STX17
|
syntaxin 17
|
|
chr3_+_28258027
|
0.318
|
NM_182523
|
CMC1
|
COX assembly mitochondrial protein homolog (S. cerevisiae)
|
|
chr7_+_37689903
|
0.317
|
|
|
|
|
chr15_-_43457916
|
0.316
|
|
GATM
|
glycine amidinotransferase (L-arginine:glycine amidinotransferase)
|
|
chr10_+_101532544
|
0.315
|
|
ABCC2
|
ATP-binding cassette, sub-family C (CFTR/MRP), member 2
|
|
chr3_+_109504021
|
0.312
|
NM_007072
|
HHLA2
|
HERV-H LTR-associating 2
|
|
chr2_+_216682251
|
0.306
|
NM_021141
|
XRCC5
|
X-ray repair complementing defective repair in Chinese hamster cells 5 (double-strand-break rejoining)
|
|
chr3_-_139960874
|
0.301
|
NM_006219
|
PIK3CB
|
phosphoinositide-3-kinase, catalytic, beta polypeptide
|
|
chr18_-_3001944
|
0.299
|
NM_014646
|
LPIN2
|
lipin 2
|
|
chr5_-_149772469
|
0.298
|
NM_001025159
NM_004355
NM_001025158
|
CD74
|
CD74 molecule, major histocompatibility complex, class II invariant chain
|
|
chr11_-_58032153
|
0.297
|
NM_001005218
|
OR5B21
|
olfactory receptor, family 5, subfamily B, member 21
|
|
chrX_-_130250880
|
0.297
|
|
IGSF1
|
immunoglobulin superfamily, member 1
|
|
chr13_-_40454360
|
0.297
|
NM_001145353
|
ELF1
|
E74-like factor 1 (ets domain transcription factor)
|
|
chr3_+_120799411
|
0.297
|
NM_015900
|
PLA1A
|
phospholipase A1 member A
|
|
chr17_+_24394043
|
0.296
|
NM_016518
|
PIPOX
|
pipecolic acid oxidase
|
|
chr17_-_59817456
|
0.295
|
|
PECAM1
|
platelet/endothelial cell adhesion molecule
|
|
chr15_-_53349775
|
0.292
|
NM_183234
NM_004580
|
RAB27A
|
RAB27A, member RAS oncogene family
|
|
chr5_-_37220702
|
0.291
|
|
C5orf42
|
chromosome 5 open reading frame 42
|
|
chr11_+_55319607
|
0.290
|
NM_001004735
|
OR5D14
|
olfactory receptor, family 5, subfamily D, member 14
|
|
chr2_+_165804157
|
0.289
|
NM_001040142
|
SCN2A
|
sodium channel, voltage-gated, type II, alpha subunit
|
|
chr5_+_40945244
|
0.288
|
|
C7
|
complement component 7
|
|
chr2_+_68445821
|
0.287
|
NM_002664
|
PLEK
|
pleckstrin
|
|
chr5_+_40945315
|
0.287
|
NM_000587
|
C7
|
complement component 7
|
|
chr10_-_82039158
|
0.286
|
NM_000429
|
MAT1A
|
methionine adenosyltransferase I, alpha
|
|
chr4_-_104217618
|
0.286
|
NM_178833
|
NHEDC2
|
Na+/H+ exchanger domain containing 2
|
|
chr13_-_98708549
|
0.282
|
NM_001098200
NM_005292
|
GPR18
|
G protein-coupled receptor 18
|
|
chr1_+_190811479
|
0.280
|
NM_002922
|
RGS1
|
regulator of G-protein signaling 1
|
|
chr3_-_195553297
|
0.279
|
NM_001080513
|
CPN2
|
carboxypeptidase N, polypeptide 2
|
|
chr1_-_158815850
|
0.279
|
|
CD84
|
CD84 molecule
|
|
chr1_-_20318578
|
0.278
|
NM_012400
|
PLA2G2D
|
phospholipase A2, group IID
|
|
chr6_+_131936057
|
0.275
|
NM_000045
|
ARG1
|
arginase, liver
|
|
chr20_+_5935897
|
0.275
|
NM_001127458
|
CRLS1
|
cardiolipin synthase 1
|
|
chr12_-_54150188
|
0.273
|
NM_001005499
|
OR6C70
|
olfactory receptor, family 6, subfamily C, member 70
|
|
chr4_+_74505710
|
0.273
|
|
|
|
|
chr5_-_149772528
|
0.272
|
|
|
|
|
chr16_-_46823682
|
0.271
|
NM_033151
|
ABCC11
|
ATP-binding cassette, sub-family C (CFTR/MRP), member 11
|
|
chr5_-_59819642
|
0.271
|
NM_001165899
|
PDE4D
|
phosphodiesterase 4D, cAMP-specific
|
|
chr14_+_31868229
|
0.269
|
NM_004274
|
AKAP6
|
A kinase (PRKA) anchor protein 6
|
|
chr5_+_40945374
|
0.268
|
|
C7
|
complement component 7
|
|
chr7_+_29486010
|
0.268
|
NM_001039936
|
CHN2
|
chimerin (chimaerin) 2
|
|
chr20_+_56903595
|
0.267
|
|
GNAS
|
GNAS complex locus
|
|
chr11_+_71387572
|
0.266
|
NM_001039659
NM_001039660
NM_173042
|
IL18BP
|
interleukin 18 binding protein
|
|
chr3_-_49826221
|
0.266
|
|
UBA7
|
ubiquitin-like modifier activating enzyme 7
|
|
chr6_+_53043729
|
0.266
|
NM_012347
|
FBXO9
|
F-box protein 9
|
|
chr5_-_146441184
|
0.264
|
NM_181677
NM_181678
|
PPP2R2B
|
protein phosphatase 2, regulatory subunit B, beta
|
|
chr11_+_59027624
|
0.264
|
NM_001004706
|
OR4D11
|
olfactory receptor, family 4, subfamily D, member 11
|
|
chr3_+_12367993
|
0.262
|
NM_015869
|
PPARG
|
peroxisome proliferator-activated receptor gamma
|
|
chr13_+_96726415
|
0.261
|
|
MBNL2
|
muscleblind-like 2 (Drosophila)
|
|
chr16_-_3567354
|
0.261
|
NM_178844
|
NLRC3
|
NLR family, CARD domain containing 3
|
|
chr11_-_35235325
|
0.259
|
|
SLC1A2
|
solute carrier family 1 (glial high affinity glutamate transporter), member 2
|