|
chr2_-_96924582
|
9.248
|
NM_001172667
|
FAM178B
|
family with sequence similarity 178, member B
|
|
chr1_-_30977931
|
5.770
|
|
LAPTM5
|
lysosomal protein transmembrane 5
|
|
chrX_+_151617900
|
4.243
|
NM_005363
NM_175868
|
MAGEA6
|
melanoma antigen family A, 6
|
|
chrX_-_151688850
|
3.953
|
NM_005362
|
MAGEA3
|
melanoma antigen family A, 3
|
|
chr11_-_74740298
|
3.647
|
NM_004041
NM_020251
|
ARRB1
|
arrestin, beta 1
|
|
chr17_-_44058612
|
3.100
|
NM_024017
|
HOXB9
|
homeobox B9
|
|
chr17_-_73636386
|
3.033
|
NM_001127198
|
TMC6
|
transmembrane channel-like 6
|
|
chr17_-_73636362
|
2.796
|
|
TMC6
|
transmembrane channel-like 6
|
|
chr14_+_28305922
|
2.734
|
NM_005249
|
FOXG1
|
forkhead box G1
|
|
chr20_+_48032918
|
2.673
|
NM_005985
|
SNAI1
|
snail homolog 1 (Drosophila)
|
|
chr22_-_21231421
|
2.506
|
NM_206955
NM_206956
NM_006115
NM_206953
NM_206954
|
PRAME
|
preferentially expressed antigen in melanoma
|
|
chr9_-_122679283
|
2.386
|
|
PHF19
|
PHD finger protein 19
|
|
chr9_-_122679387
|
2.333
|
NM_001009936
NM_015651
|
PHF19
|
PHD finger protein 19
|
|
chr16_-_69030421
|
2.308
|
NM_006927
|
ST3GAL2
|
ST3 beta-galactoside alpha-2,3-sialyltransferase 2
|
|
chr21_-_43368963
|
2.291
|
NM_000071
|
CBS
|
cystathionine-beta-synthase
|
|
chr8_+_144706699
|
2.269
|
NM_001166237
|
GSDMD
|
gasdermin D
|
|
chrX_-_152139267
|
2.243
|
NM_004988
|
MAGEA1
|
melanoma antigen family A, 1 (directs expression of antigen MZ2-E)
|
|
chr20_-_55533544
|
2.152
|
NM_080618
|
CTCFL
|
CCCTC-binding factor (zinc finger protein)-like
|
|
chrX_+_151633730
|
2.146
|
NM_005361
NM_175742
NM_175743
|
MAGEA2
|
melanoma antigen family A, 2
|
|
chrX_-_151672985
|
2.112
|
NM_005361
NM_175742
NM_175743
|
MAGEA2
|
melanoma antigen family A, 2
|
|
chrX_-_151653756
|
1.981
|
NM_001166386
NM_001166387
NM_005367
|
MAGEA12
|
melanoma antigen family A, 12
|
|
chrX_-_39841599
|
1.962
|
NM_001123385
NM_017745
|
BCOR
|
BCL6 corepressor
|
|
chr7_-_100077072
|
1.957
|
NM_003227
|
TFR2
|
transferrin receptor 2
|
|
chr1_-_154318412
|
1.956
|
NM_001093725
|
MEX3A
|
mex-3 homolog A (C. elegans)
|
|
chr2_+_200031333
|
1.944
|
|
|
|
|
chr3_-_71715431
|
1.925
|
NM_001012505
NM_032682
|
FOXP1
|
forkhead box P1
|
|
chr15_+_74416156
|
1.925
|
NM_145805
|
ISL2
|
ISL LIM homeobox 2
|
|
chrX_+_151653874
|
1.887
|
NM_001102576
NM_153478
|
CSAG1
|
chondrosarcoma associated gene 1
|
|
chr20_-_62151216
|
1.884
|
NM_018419
|
SOX18
|
SRY (sex determining region Y)-box 18
|
|
chr15_+_74416129
|
1.855
|
|
ISL2
|
ISL LIM homeobox 2
|
|
chr7_-_100331417
|
1.849
|
NM_000665
NM_015831
|
ACHE
|
acetylcholinesterase
|
|
chr21_-_43369492
|
1.839
|
NM_001178008
NM_001178009
|
CBS
|
cystathionine-beta-synthase
|
|
chr12_-_52980984
|
1.800
|
NM_001136023
|
NFE2
|
nuclear factor (erythroid-derived 2), 45kDa
|
|
chr12_-_52980914
|
1.772
|
|
NFE2
|
nuclear factor (erythroid-derived 2), 45kDa
|
|
chr19_+_3317589
|
1.753
|
|
NFIC
|
nuclear factor I/C (CCAAT-binding transcription factor)
|
|
chr19_+_3317575
|
1.737
|
|
NFIC
|
nuclear factor I/C (CCAAT-binding transcription factor)
|
|
chr12_+_54700955
|
1.731
|
NM_022465
|
IKZF4
|
IKAROS family zinc finger 4 (Eos)
|
|
chr22_+_19699441
|
1.721
|
NM_001159554
NM_005446
|
P2RX6
|
purinergic receptor P2X, ligand-gated ion channel, 6
|
|
chr17_+_77582774
|
1.711
|
NM_005052
|
RAC3
|
ras-related C3 botulinum toxin substrate 3 (rho family, small GTP binding protein Rac3)
|
|
chr17_-_44010543
|
1.702
|
NM_024015
|
HOXB4
|
homeobox B4
|
|
chr15_-_41589958
|
1.700
|
NM_005657
|
TP53BP1
|
tumor protein p53 binding protein 1
|
|
chr1_-_182273114
|
1.684
|
|
GLT25D2
|
glycosyltransferase 25 domain containing 2
|
|
chr12_+_56135353
|
1.672
|
NM_031479
|
INHBE
|
inhibin, beta E
|
|
chr1_+_20385164
|
1.655
|
NM_152376
|
UBXN10
|
UBX domain protein 10
|
|
chr6_+_14032655
|
1.647
|
NM_001165034
|
RNF182
|
ring finger protein 182
|
|
chr16_+_387176
|
1.577
|
NM_005009
|
NME4
|
non-metastatic cells 4, protein expressed in
|
|
chr17_+_75366524
|
1.565
|
NM_005189
NM_032647
|
CBX2
|
chromobox homolog 2
|
|
chr6_-_29703725
|
1.558
|
|
GABBR1
|
gamma-aminobutyric acid (GABA) B receptor, 1
|
|
chr9_+_129962292
|
1.539
|
NM_024112
|
C9orf16
|
chromosome 9 open reading frame 16
|
|
chr7_+_150390566
|
1.494
|
|
SLC4A2
|
solute carrier family 4, anion exchanger, member 2 (erythrocyte membrane protein band 3-like 1)
|
|
chr12_-_6586811
|
1.486
|
NM_001273
|
CHD4
|
chromodomain helicase DNA binding protein 4
|
|
chr4_-_109308893
|
1.481
|
NM_001130713
NM_001130714
NM_016269
|
LEF1
|
lymphoid enhancer-binding factor 1
|
|
chr1_-_38243716
|
1.446
|
|
FHL3
|
four and a half LIM domains 3
|
|
chr8_+_41804946
|
1.435
|
|
|
|
|
chr10_-_76538859
|
1.421
|
NM_001007271
NM_001007272
NM_001007273
|
DUSP13
|
dual specificity phosphatase 13
|
|
chr5_+_176446425
|
1.417
|
NM_002011
NM_213647
|
FGFR4
|
fibroblast growth factor receptor 4
|
|
chrX_-_153632355
|
1.407
|
NM_001081573
NM_080612
|
GAB3
|
GRB2-associated binding protein 3
|
|
chr17_-_77474597
|
1.384
|
NM_032711
|
MAFG
|
v-maf musculoaponeurotic fibrosarcoma oncogene homolog G (avian)
|
|
chr14_-_21064182
|
1.358
|
|
SALL2
|
sal-like 2 (Drosophila)
|
|
chr1_-_38243747
|
1.353
|
NM_004468
|
FHL3
|
four and a half LIM domains 3
|
|
chr7_-_150411345
|
1.328
|
NM_031434
|
TMUB1
|
transmembrane and ubiquitin-like domain containing 1
|
|
chr15_-_20637731
|
1.324
|
NM_144599
|
NIPA1
|
non imprinted in Prader-Willi/Angelman syndrome 1
|
|
chr2_-_144991556
|
1.322
|
|
ZEB2
|
zinc finger E-box binding homeobox 2
|
|
chr2_-_220144511
|
1.320
|
NM_001173408
NM_001173431
NM_015311
|
OBSL1
|
obscurin-like 1
|
|
chr19_+_3317536
|
1.317
|
NM_005597
|
NFIC
|
nuclear factor I/C (CCAAT-binding transcription factor)
|
|
chr14_-_20563698
|
1.317
|
|
NDRG2
|
NDRG family member 2
|
|
chr1_-_1283770
|
1.309
|
NM_032348
|
MXRA8
|
matrix-remodelling associated 8
|
|
chr11_+_46359821
|
1.308
|
|
MDK
|
midkine (neurite growth-promoting factor 2)
|
|
chr5_+_76181581
|
1.305
|
NM_130772
|
S100Z
|
S100 calcium binding protein Z
|
|
chr6_+_32229599
|
1.276
|
NM_005155
|
PPT2-EGFL8
PPT2
|
PPT2-EGFL8 read-through transcript
palmitoyl-protein thioesterase 2
|
|
chr12_+_6807831
|
1.270
|
NM_014262
|
LEPREL2
|
leprecan-like 2
|
|
chr11_+_46359855
|
1.269
|
|
MDK
|
midkine (neurite growth-promoting factor 2)
|
|
chr14_-_20563722
|
1.257
|
NM_016250
NM_201535
NM_201536
NM_201537
|
NDRG2
|
NDRG family member 2
|
|
chr19_+_17723285
|
1.248
|
NM_001161359
NM_015122
|
FCHO1
|
FCH domain only 1
|
|
chr7_-_92303865
|
1.242
|
NM_001145306
|
CDK6
|
cyclin-dependent kinase 6
|
|
chr10_+_21863099
|
1.241
|
NM_001195627
NM_001195628
NM_001195630
NM_004641
|
MLLT10
|
myeloid/lymphoid or mixed-lineage leukemia (trithorax homolog, Drosophila); translocated to, 10
|
|
chr19_-_51168396
|
1.240
|
NM_002516
|
NOVA2
|
neuro-oncological ventral antigen 2
|
|
chr14_+_104267270
|
1.238
|
NM_199165
|
ADSSL1
|
adenylosuccinate synthase like 1
|
|
chr12_+_56202874
|
1.226
|
NM_052897
|
MBD6
|
methyl-CpG binding domain protein 6
|
|
chr5_+_139008667
|
1.225
|
|
CXXC5
|
CXXC finger protein 5
|
|
chr11_+_46359836
|
1.225
|
|
MDK
|
midkine (neurite growth-promoting factor 2)
|
|
chr7_+_74017015
|
1.223
|
NM_001145063
|
GATSL1
GATSL2
|
GATS protein-like 1
GATS protein-like 2
|
|
chr7_-_92303812
|
1.216
|
|
CDK6
|
cyclin-dependent kinase 6
|
|
chr20_-_22513050
|
1.215
|
NM_021784
|
FOXA2
|
forkhead box A2
|
|
chr21_-_10120690
|
1.214
|
NM_001187
NM_182484
NM_181704
NM_182481
NM_182482
|
BAGE
BAGE5
BAGE4
BAGE3
BAGE2
|
B melanoma antigen
B melanoma antigen family, member 5
B melanoma antigen family, member 4
B melanoma antigen family, member 3
B melanoma antigen family, member 2
|
|
chr15_-_80125403
|
1.206
|
NM_032246
|
MEX3B
|
mex-3 homolog B (C. elegans)
|
|
chr2_-_200030944
|
1.205
|
NM_001172509
|
SATB2
|
SATB homeobox 2
|
|
chr15_+_89299060
|
1.199
|
NM_001017919
NM_033544
|
RCCD1
|
RCC1 domain containing 1
|
|
chr1_+_26896519
|
1.191
|
|
ARID1A
|
AT rich interactive domain 1A (SWI-like)
|
|
chr9_-_126945536
|
1.172
|
NM_001144877
NM_173690
|
SCAI
|
suppressor of cancer cell invasion
|
|
chr6_+_32229771
|
1.154
|
|
PPT2-EGFL8
PPT2
|
PPT2-EGFL8 read-through transcript
palmitoyl-protein thioesterase 2
|
|
chr6_-_29703913
|
1.148
|
NM_021903
|
GABBR1
|
gamma-aminobutyric acid (GABA) B receptor, 1
|
|
chr3_+_20056527
|
1.136
|
NM_003884
|
KAT2B
|
K(lysine) acetyltransferase 2B
|
|
chr19_-_60350122
|
1.129
|
|
TNNT1
|
troponin T type 1 (skeletal, slow)
|
|
chr10_+_22650145
|
1.126
|
|
BMI1
|
BMI1 polycomb ring finger oncogene
|
|
chr1_-_149214063
|
1.120
|
NM_022075
NM_181746
|
LASS2
|
LAG1 homolog, ceramide synthase 2
|
|
chr1_-_47468029
|
1.104
|
NM_003189
|
TAL1
|
T-cell acute lymphocytic leukemia 1
|
|
chr19_+_4442610
|
1.096
|
|
HDGFRP2
|
hepatoma-derived growth factor-related protein 2
|
|
chr1_-_200397300
|
1.095
|
|
PTPN7
|
protein tyrosine phosphatase, non-receptor type 7
|
|
chr17_+_1580504
|
1.094
|
|
WDR81
|
WD repeat domain 81
|
|
chr19_+_10261646
|
1.085
|
NM_003259
|
ICAM5
|
intercellular adhesion molecule 5, telencephalin
|
|
chr20_-_22512893
|
1.081
|
|
FOXA2
|
forkhead box A2
|
|
chr20_-_49592444
|
1.081
|
|
NFATC2
|
nuclear factor of activated T-cells, cytoplasmic, calcineurin-dependent 2
|
|
chr19_+_522260
|
1.074
|
NM_198591
|
BSG
|
basigin (Ok blood group)
|
|
chr19_-_18409788
|
1.073
|
NM_001170939
|
ISYNA1
|
inositol-3-phosphate synthase 1
|
|
chrX_+_117513899
|
1.072
|
NM_144658
|
DOCK11
|
dedicator of cytokinesis 11
|
|
chr10_+_21863272
|
1.065
|
|
MLLT10
|
myeloid/lymphoid or mixed-lineage leukemia (trithorax homolog, Drosophila); translocated to, 10
|
|
chr1_+_945331
|
1.053
|
NM_198576
|
AGRN
|
agrin
|
|
chr1_+_153241858
|
1.052
|
|
ZBTB7B
|
zinc finger and BTB domain containing 7B
|
|
chr19_+_14405216
|
1.048
|
|
PKN1
|
protein kinase N1
|
|
chr11_+_279113
|
1.042
|
NM_025092
|
ATHL1
|
ATH1, acid trehalase-like 1 (yeast)
|
|
chr12_-_6586736
|
1.040
|
|
CHD4
|
chromodomain helicase DNA binding protein 4
|
|
chr21_+_46473494
|
1.034
|
|
MCM3AP-AS1
|
MCM3AP antisense RNA 1 (non-protein coding)
|
|
chr7_+_733182
|
1.032
|
|
HEATR2
|
HEAT repeat containing 2
|
|
chr1_-_27802688
|
1.031
|
NM_001029882
|
AHDC1
|
AT hook, DNA binding motif, containing 1
|
|
chr10_+_21863388
|
1.022
|
|
MLLT10
|
myeloid/lymphoid or mixed-lineage leukemia (trithorax homolog, Drosophila); translocated to, 10
|
|
chr11_+_46359781
|
1.015
|
NM_002391
|
MDK
|
midkine (neurite growth-promoting factor 2)
|
|
chr8_-_125252884
|
1.014
|
|
C8orf78
|
chromosome 8 open reading frame 78
|
|
chr21_-_46428728
|
1.012
|
|
C21orf56
|
chromosome 21 open reading frame 56
|
|
chr17_-_39700960
|
1.006
|
NM_000342
|
SLC4A1
|
solute carrier family 4, anion exchanger, member 1 (erythrocyte membrane protein band 3, Diego blood group)
|
|
chr9_+_70509925
|
0.995
|
NM_003558
|
PIP5K1B
|
phosphatidylinositol-4-phosphate 5-kinase, type I, beta
|
|
chrX_+_119176494
|
0.992
|
NM_001099685
NM_032498
|
RHOXF2B
RHOXF2
|
Rhox homeobox family, member 2B
Rhox homeobox family, member 2
|
|
chr3_-_178397706
|
0.992
|
NM_024665
|
TBL1XR1
|
transducin (beta)-like 1 X-linked receptor 1
|
|
chr6_+_32230172
|
0.991
|
|
PPT2
|
palmitoyl-protein thioesterase 2
|
|
chr15_+_41597097
|
0.989
|
NM_002373
|
MAP1A
|
microtubule-associated protein 1A
|
|
chr11_+_46359878
|
0.988
|
NM_001012333
|
MDK
|
midkine (neurite growth-promoting factor 2)
|
|
chr21_-_46428768
|
0.988
|
|
C21orf56
|
chromosome 21 open reading frame 56
|
|
chr8_+_21833162
|
0.982
|
|
XPO7
|
exportin 7
|
|
chr3_+_171558188
|
0.982
|
|
SKIL
|
SKI-like oncogene
|
|
chr2_-_130603264
|
0.976
|
NM_001099771
|
POTEF
|
POTE ankyrin domain family, member F
|
|
chr16_+_2742606
|
0.961
|
|
SRRM2
|
serine/arginine repetitive matrix 2
|
|
chr19_-_16868674
|
0.960
|
|
CPAMD8
|
C3 and PZP-like, alpha-2-macroglobulin domain containing 8
|
|
chr7_+_149733309
|
0.957
|
|
|
|
|
chr5_-_88215034
|
0.956
|
NM_001193350
NM_002397
|
MEF2C
|
myocyte enhancer factor 2C
|
|
chr16_+_29725311
|
0.953
|
NM_001042539
NM_002383
|
MAZ
|
MYC-associated zinc finger protein (purine-binding transcription factor)
|
|
chr5_-_176833197
|
0.950
|
|
DBN1
|
drebrin 1
|
|
chr8_+_21833111
|
0.942
|
NM_015024
|
XPO7
|
exportin 7
|
|
chr7_+_64136078
|
0.941
|
|
CCT6P3
|
chaperonin containing TCP1, subunit 6 (zeta) pseudogene 3
|
|
chr1_+_945399
|
0.938
|
|
|
|
|
chr16_-_28515868
|
0.938
|
NM_001054
|
SULT1A2
|
sulfotransferase family, cytosolic, 1A, phenol-preferring, member 2
|
|
chr19_+_811615
|
0.937
|
|
CFD
|
complement factor D (adipsin)
|
|
chr19_-_15421761
|
0.930
|
NM_021241
|
WIZ
|
widely interspaced zinc finger motifs
|
|
chr19_-_4017739
|
0.929
|
NM_015898
|
ZBTB7A
|
zinc finger and BTB domain containing 7A
|
|
chr3_-_159306214
|
0.929
|
|
|
|
|
chr19_-_8581559
|
0.924
|
NM_030957
|
ADAMTS10
|
ADAM metallopeptidase with thrombospondin type 1 motif, 10
|
|
chr19_-_7896974
|
0.924
|
NM_206833
|
CTXN1
|
cortexin 1
|
|
chr8_-_145881968
|
0.919
|
|
ARHGAP39
|
Rho GTPase activating protein 39
|
|
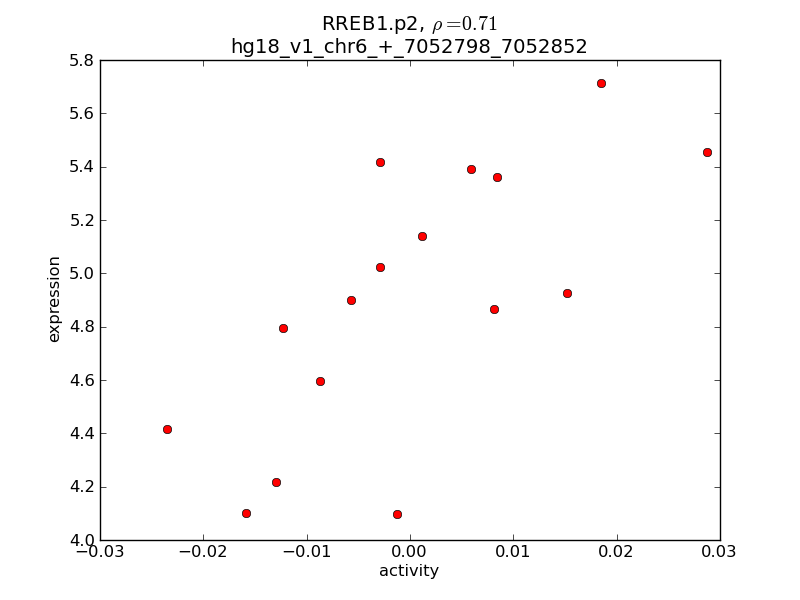
chr6_+_7052798
|
0.911
|
NM_001168344
|
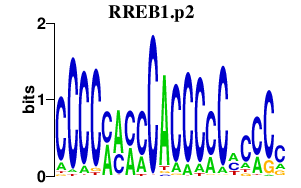
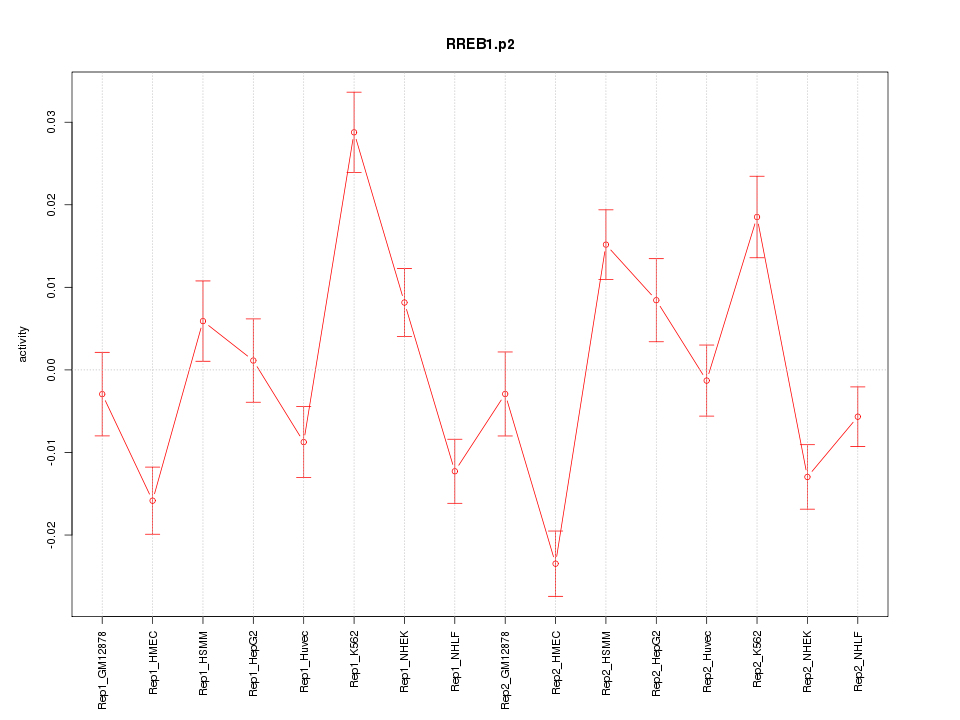
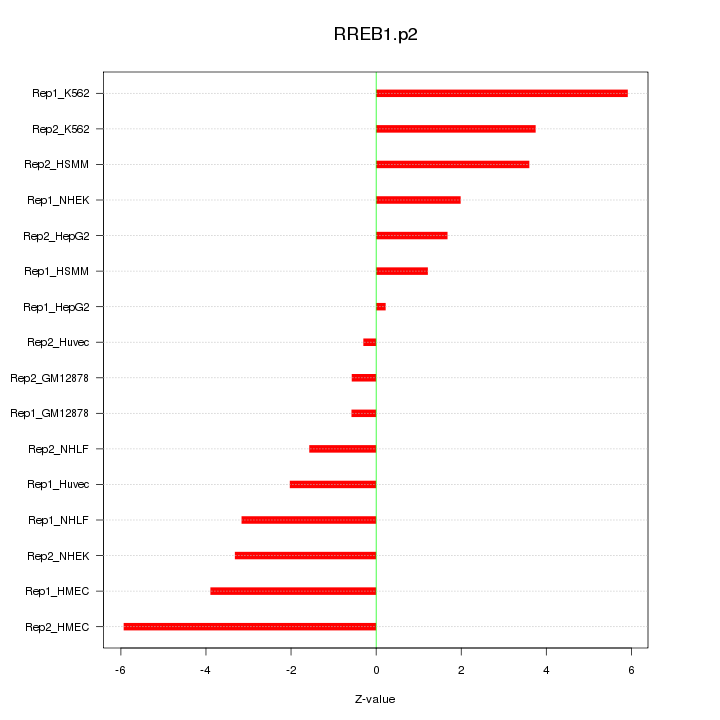
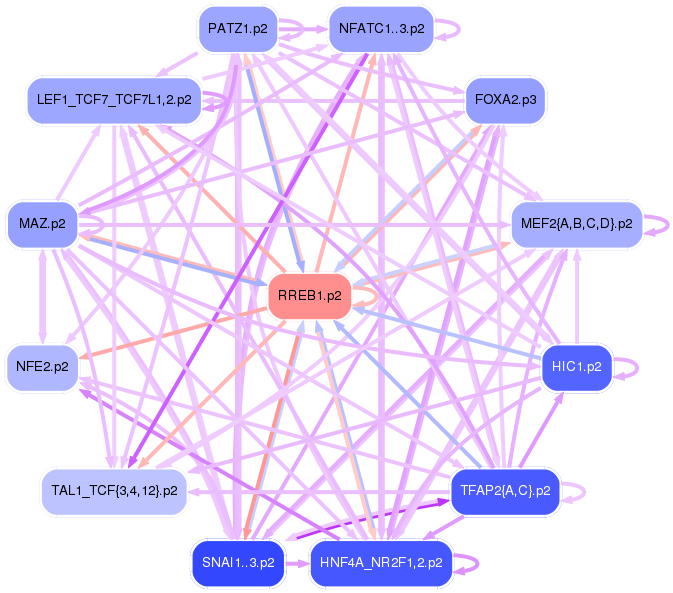
RREB1
|
ras responsive element binding protein 1
|
|
chr21_-_46428788
|
0.909
|
NM_001142854
NM_032261
|
C21orf56
|
chromosome 21 open reading frame 56
|
|
chr14_-_90352513
|
0.909
|
NM_001010854
|
TTC7B
|
tetratricopeptide repeat domain 7B
|
|
chr11_+_64694200
|
0.907
|
NM_001008778
|
SPDYC
|
speedy homolog C (Xenopus laevis)
|
|
chr14_-_20562962
|
0.906
|
NM_201538
NM_201539
NM_201540
NM_201541
|
NDRG2
|
NDRG family member 2
|
|
chr7_-_20793028
|
0.905
|
NM_182700
NM_198956
|
SP8
|
Sp8 transcription factor
|
|
chr17_-_71352090
|
0.903
|
|
UNC13D
|
unc-13 homolog D (C. elegans)
|
|
chr19_+_61344341
|
0.901
|
NM_018337
|
ZNF444
|
zinc finger protein 444
|
|
chr19_-_18409971
|
0.900
|
NM_001170938
NM_016368
|
ISYNA1
|
inositol-3-phosphate synthase 1
|
|
chr7_+_101245812
|
0.898
|
NM_001913
NM_181500
|
CUX1
|
cut-like homeobox 1
|
|
chr16_+_56286212
|
0.894
|
NM_032269
|
CCDC135
|
coiled-coil domain containing 135
|
|
chrX_-_148476903
|
0.893
|
NM_005365
NM_001080790
|
MAGEA9
MAGEA9B
|
melanoma antigen family A, 9
melanoma antigen family A, 9B
|
|
chr16_+_84202515
|
0.890
|
NM_001134473
|
KIAA0182
|
KIAA0182
|
|
chr2_-_171725150
|
0.887
|
|
TLK1
|
tousled-like kinase 1
|
|
chrX_-_119095544
|
0.884
|
NM_001099685
NM_032498
|
RHOXF2B
RHOXF2
|
Rhox homeobox family, member 2B
Rhox homeobox family, member 2
|
|
chr10_-_75085754
|
0.881
|
NM_001114133
|
SYNPO2L
|
synaptopodin 2-like
|
|
chr3_+_171558215
|
0.879
|
|
SKIL
|
SKI-like oncogene
|
|
chr2_+_42649105
|
0.877
|
NM_020744
|
MTA3
|
metastasis associated 1 family, member 3
|
|
chr1_-_149213916
|
0.875
|
|
LASS2
|
LAG1 homolog, ceramide synthase 2
|
|
chr10_+_22649977
|
0.872
|
NM_005180
|
BMI1
|
BMI1 polycomb ring finger oncogene
|
|
chr19_+_61344501
|
0.871
|
|
ZNF444
|
zinc finger protein 444
|
|
chr6_-_68655708
|
0.871
|
|
|
|
|
chr11_-_133786935
|
0.860
|
NM_018644
NM_054025
|
B3GAT1
|
beta-1,3-glucuronyltransferase 1 (glucuronosyltransferase P)
|
|
chrX_-_153632990
|
0.853
|
|
GAB3
|
GRB2-associated binding protein 3
|
|
chr1_-_149213826
|
0.853
|
|
LASS2
|
LAG1 homolog, ceramide synthase 2
|
|
chr3_+_20056857
|
0.852
|
|
KAT2B
|
K(lysine) acetyltransferase 2B
|
|
chr12_+_54832470
|
0.849
|
NM_002475
|
MYL6B
|
myosin, light chain 6B, alkali, smooth muscle and non-muscle
|
|
chr7_+_154426064
|
0.848
|
|
LOC202781
|
hypothetical LOC202781
|
|
chrX_+_128501862
|
0.843
|
NM_000276
NM_001587
|
OCRL
|
oculocerebrorenal syndrome of Lowe
|
|
chr8_-_145671947
|
0.842
|
|
FOXH1
|
forkhead box H1
|
|
chr7_-_150305933
|
0.842
|
NM_000238
NM_172056
|
KCNH2
|
potassium voltage-gated channel, subfamily H (eag-related), member 2
|
|
chr19_-_60350118
|
0.839
|
|
TNNT1
|
troponin T type 1 (skeletal, slow)
|
|
chr3_-_178397621
|
0.839
|
|
TBL1XR1
|
transducin (beta)-like 1 X-linked receptor 1
|
|
chr19_-_18515280
|
0.839
|
|
FKBP8
|
FK506 binding protein 8, 38kDa
|
|
chr7_-_733401
|
0.837
|
NM_001164760
|
PRKAR1B
|
protein kinase, cAMP-dependent, regulatory, type I, beta
|
|
chr1_-_149213929
|
0.837
|
|
LASS2
|
LAG1 homolog, ceramide synthase 2
|
|
chr6_+_14033076
|
0.834
|
NM_001165032
NM_152737
|
RNF182
|
ring finger protein 182
|
|
chr2_+_46779553
|
0.830
|
NM_014011
|
SOCS5
|
suppressor of cytokine signaling 5
|
|
chr2_+_42649348
|
0.829
|
|
MTA3
|
metastasis associated 1 family, member 3
|
|
chr7_-_733812
|
0.823
|
NM_001164758
NM_001164759
|
PRKAR1B
|
protein kinase, cAMP-dependent, regulatory, type I, beta
|
|
chr4_+_191226073
|
0.823
|
NM_012147
NM_001177376
NM_001127388
NM_001127389
NM_001164467
|
DUX2
DUX4L4
DUX4L6
DUX4L5
DUX4L3
|
double homeobox 2
double homeobox 4 like 4
double homeobox 4 like 6
double homeobox 4 like 5
double homeobox 4 like 3
|
|
chr19_-_18515376
|
0.817
|
NM_012181
|
FKBP8
|
FK506 binding protein 8, 38kDa
|
|
chr3_+_171558143
|
0.817
|
NM_001145098
NM_005414
|
SKIL
|
SKI-like oncogene
|
|
chr19_-_5291700
|
0.815
|
NM_002850
NM_130853
NM_130854
NM_130855
|
PTPRS
|
protein tyrosine phosphatase, receptor type, S
|
|
chr3_-_185578621
|
0.808
|
NM_000460
NM_001177597
NM_001177598
|
THPO
|
thrombopoietin
|
|
chr1_+_153241665
|
0.801
|
NM_015872
|
ZBTB7B
|
zinc finger and BTB domain containing 7B
|
|
chr16_+_84204424
|
0.799
|
NM_014615
|
KIAA0182
|
KIAA0182
|
|
chr1_-_23977330
|
0.798
|
|
LOC100506963
|
hypothetical LOC100506963
|
|
chr11_+_34029764
|
0.798
|
NM_005898
NM_203364
|
CAPRIN1
|
cell cycle associated protein 1
|
|
chr1_-_149213778
|
0.798
|
|
LASS2
|
LAG1 homolog, ceramide synthase 2
|
|
chr14_-_90352395
|
0.797
|
|
|
|
|
chr7_-_74705276
|
0.797
|
NM_001145064
|
GATSL2
|
GATS protein-like 2
|
|
chr10_-_7491204
|
0.790
|
NM_001018039
|
SFMBT2
|
Scm-like with four mbt domains 2
|