|
chr11_-_16380967
|
8.340
|
NM_001145819
NM_017508
|
SOX6
|
SRY (sex determining region Y)-box 6
|
|
chr6_+_105511615
|
5.597
|
NM_001004317
|
LIN28B
|
lin-28 homolog B (C. elegans)
|
|
chr3_+_173043832
|
4.226
|
NM_001164436
|
TMEM212
|
transmembrane protein 212
|
|
chr3_-_150422474
|
3.352
|
NM_000096
|
CP
|
ceruloplasmin (ferroxidase)
|
|
chr3_+_152970904
|
3.138
|
|
LOC201651
|
arylacetamide deacetylase (esterase) pseudogene
|
|
chr9_-_129752687
|
2.934
|
NM_203305
|
FAM102A
|
family with sequence similarity 102, member A
|
|
chr12_+_68028397
|
2.339
|
NM_000239
|
LYZ
|
lysozyme
|
|
chr12_+_68028407
|
2.189
|
|
LYZ
|
lysozyme
|
|
chr11_+_101488380
|
2.154
|
NM_001195045
|
YAP1
|
Yes-associated protein 1
|
|
chr2_+_228386800
|
2.006
|
NM_001130046
NM_004591
|
CCL20
|
chemokine (C-C motif) ligand 20
|
|
chr11_+_22652957
|
1.946
|
|
GAS2
|
growth arrest-specific 2
|
|
chr11_+_22652894
|
1.897
|
NM_005256
|
GAS2
|
growth arrest-specific 2
|
|
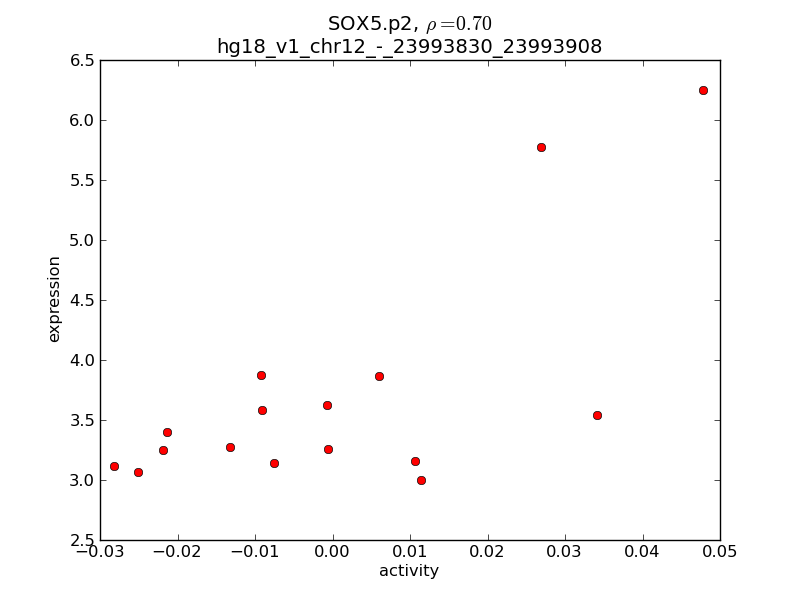
chr12_-_23995220
|
1.706
|
|
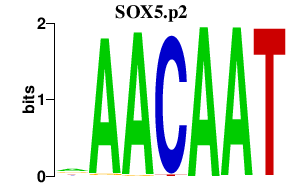
SOX5
|
SRY (sex determining region Y)-box 5
|
|
chr12_-_23995109
|
1.562
|
|
SOX5
|
SRY (sex determining region Y)-box 5
|
|
chr1_-_12599934
|
1.539
|
NM_004753
|
DHRS3
|
dehydrogenase/reductase (SDR family) member 3
|
|
chr5_+_61910318
|
1.530
|
NM_181506
|
LRRC70
|
leucine rich repeat containing 70
|
|
chr17_+_34114924
|
1.524
|
|
MLLT6
|
myeloid/lymphoid or mixed-lineage leukemia (trithorax homolog, Drosophila); translocated to, 6
|
|
chr6_+_148705421
|
1.506
|
NM_015278
|
SASH1
|
SAM and SH3 domain containing 1
|
|
chr6_+_148705817
|
1.440
|
|
SASH1
|
SAM and SH3 domain containing 1
|
|
chr3_-_71376919
|
1.415
|
|
FOXP1
|
forkhead box P1
|
|
chr13_+_96726197
|
1.405
|
|
MBNL2
|
muscleblind-like 2 (Drosophila)
|
|
chr2_+_27573206
|
1.389
|
NM_001486
|
GCKR
|
glucokinase (hexokinase 4) regulator
|
|
chr6_-_48186868
|
1.377
|
|
C6orf138
|
chromosome 6 open reading frame 138
|
|
chr13_-_47885653
|
1.366
|
NM_001162498
|
LPAR6
|
lysophosphatidic acid receptor 6
|
|
chr4_+_74491272
|
1.364
|
|
ALB
|
albumin
|
|
chr3_-_121884091
|
1.331
|
NM_000187
|
HGD
|
homogentisate 1,2-dioxygenase
|
|
chr6_-_138862273
|
1.258
|
|
|
|
|
chrX_-_99778340
|
1.226
|
NM_003270
|
TSPAN6
|
tetraspanin 6
|
|
chr20_+_31613800
|
1.218
|
NM_001039709
NM_005093
|
CBFA2T2
|
core-binding factor, runt domain, alpha subunit 2; translocated to, 2
|
|
chrX_+_105823723
|
1.212
|
NM_024539
|
RNF128
|
ring finger protein 128
|
|
chr3_+_186529376
|
1.206
|
|
MAP3K13
|
mitogen-activated protein kinase kinase kinase 13
|
|
chr13_+_96726415
|
1.203
|
|
MBNL2
|
muscleblind-like 2 (Drosophila)
|
|
chr4_-_159313167
|
1.203
|
NM_016613
|
FAM198B
|
family with sequence similarity 198, member B
|
|
chr3_-_121883647
|
1.195
|
|
HGD
|
homogentisate 1,2-dioxygenase
|
|
chr9_+_676640
|
1.193
|
|
|
|
|
chr6_-_138862271
|
1.182
|
NM_001144060
|
NHSL1
|
NHS-like 1
|
|
chr6_-_24491498
|
1.175
|
NM_001195610
|
DCDC2
|
doublecortin domain containing 2
|
|
chr4_+_124537334
|
1.148
|
NM_199327
|
SPRY1
|
sprouty homolog 1, antagonist of FGF signaling (Drosophila)
|
|
chr6_-_138935359
|
1.142
|
NM_020464
|
NHSL1
|
NHS-like 1
|
|
chr17_-_59817456
|
1.121
|
|
PECAM1
|
platelet/endothelial cell adhesion molecule
|
|
chr1_+_61319976
|
1.108
|
NM_001145512
|
NFIA
|
nuclear factor I/A
|
|
chr10_-_116434364
|
1.089
|
NM_001003407
NM_001003408
|
ABLIM1
|
actin binding LIM protein 1
|
|
chr14_-_22974707
|
1.086
|
NM_000257
|
MYH7
|
myosin, heavy chain 7, cardiac muscle, beta
|
|
chr4_-_159312973
|
1.083
|
|
FAM198B
|
family with sequence similarity 198, member B
|
|
chr17_-_53847937
|
1.080
|
|
RNF43
|
ring finger protein 43
|
|
chr16_-_11282595
|
1.063
|
NM_002761
|
PRM1
|
protamine 1
|
|
chr11_+_73037382
|
1.053
|
NM_001130036
|
PLEKHB1
|
pleckstrin homology domain containing, family B (evectins) member 1
|
|
chr16_-_30841938
|
1.045
|
|
NCRNA00095
|
non-protein coding RNA 95
|
|
chr7_-_111633428
|
1.039
|
|
DOCK4
|
dedicator of cytokinesis 4
|
|
chr10_+_101532450
|
1.026
|
NM_000392
|
ABCC2
|
ATP-binding cassette, sub-family C (CFTR/MRP), member 2
|
|
chr7_-_26198673
|
1.017
|
|
HNRNPA2B1
|
heterogeneous nuclear ribonucleoprotein A2/B1
|
|
chr2_-_192420168
|
1.017
|
NM_004657
|
SDPR
|
serum deprivation response
|
|
chr4_-_186969202
|
1.016
|
NM_001145671
|
SORBS2
|
sorbin and SH3 domain containing 2
|
|
chr10_+_114699953
|
1.014
|
NM_001146274
NM_001146283
NM_001146284
NM_001146285
NM_001146286
NM_001198525
NM_001198526
NM_001198527
NM_001198528
NM_001198529
NM_001198530
NM_001198531
NM_030756
|
TCF7L2
|
transcription factor 7-like 2 (T-cell specific, HMG-box)
|
|
chr2_-_39310176
|
1.009
|
NM_001009565
|
CDKL4
|
cyclin-dependent kinase-like 4
|
|
chr11_-_114880275
|
1.004
|
NM_001098517
NM_014333
|
CADM1
|
cell adhesion molecule 1
|
|
chr12_-_69317441
|
1.000
|
NM_001109754
|
PTPRB
|
protein tyrosine phosphatase, receptor type, B
|
|
chr12_-_88270128
|
0.983
|
|
DUSP6
|
dual specificity phosphatase 6
|
|
chr3_-_101077605
|
0.972
|
NM_014890
|
FILIP1L
|
filamin A interacting protein 1-like
|
|
chr8_-_13178399
|
0.968
|
|
DLC1
|
deleted in liver cancer 1
|
|
chr17_+_63252704
|
0.966
|
|
BPTF
|
bromodomain PHD finger transcription factor
|
|
chr5_-_148738980
|
0.951
|
NM_014443
|
IL17B
|
interleukin 17B
|
|
chr4_-_186969041
|
0.949
|
NM_001145672
|
SORBS2
|
sorbin and SH3 domain containing 2
|
|
chr20_+_10363949
|
0.946
|
NM_001009608
|
C20orf94
|
chromosome 20 open reading frame 94
|
|
chr17_-_59817575
|
0.941
|
|
PECAM1
|
platelet/endothelial cell adhesion molecule
|
|
chr8_-_13178327
|
0.926
|
|
|
|
|
chr21_+_17807167
|
0.925
|
NM_001338
|
CXADR
|
coxsackie virus and adenovirus receptor
|
|
chr6_-_128883125
|
0.918
|
NM_002844
NM_001135648
|
PTPRK
|
protein tyrosine phosphatase, receptor type, K
|
|
chr6_-_116488458
|
0.918
|
NM_002031
|
FRK
|
fyn-related kinase
|
|
chr9_-_115880494
|
0.906
|
NM_001633
|
AMBP
|
alpha-1-microglobulin/bikunin precursor
|
|
chr1_-_108032645
|
0.898
|
NM_001079874
|
VAV3
|
vav 3 guanine nucleotide exchange factor
|
|
chr4_-_101658094
|
0.894
|
NM_001159694
NM_016242
|
EMCN
|
endomucin
|
|
chr12_-_88270369
|
0.890
|
|
DUSP6
|
dual specificity phosphatase 6
|
|
chr10_-_116241572
|
0.888
|
|
|
|
|
chr9_+_27099138
|
0.886
|
NM_000459
|
TEK
|
TEK tyrosine kinase, endothelial
|
|
chrX_+_107569671
|
0.885
|
NM_000495
NM_033380
|
COL4A5
|
collagen, type IV, alpha 5
|
|
chr2_+_138438277
|
0.881
|
NM_001024074
NM_001024075
NM_006895
|
HNMT
|
histamine N-methyltransferase
|
|
chr17_+_34115383
|
0.878
|
NM_005937
|
MLLT6
|
myeloid/lymphoid or mixed-lineage leukemia (trithorax homolog, Drosophila); translocated to, 6
|
|
chr7_-_5429702
|
0.869
|
NM_001080495
|
TNRC18
|
trinucleotide repeat containing 18
|
|
chr3_+_174598937
|
0.867
|
NM_014932
|
NLGN1
|
neuroligin 1
|
|
chr5_+_147754467
|
0.867
|
|
FBXO38
|
F-box protein 38
|
|
chr7_+_116238309
|
0.864
|
|
CAPZA2
|
capping protein (actin filament) muscle Z-line, alpha 2
|
|
chr12_-_88270375
|
0.862
|
NM_001946
NM_022652
|
DUSP6
|
dual specificity phosphatase 6
|
|
chr10_+_24537725
|
0.854
|
NM_001098501
NM_019590
|
KIAA1217
|
KIAA1217
|
|
chr12_-_101835510
|
0.853
|
NM_000277
|
PAH
|
phenylalanine hydroxylase
|
|
chr7_-_111633620
|
0.851
|
NM_014705
|
DOCK4
|
dedicator of cytokinesis 4
|
|
chr3_+_82117978
|
0.847
|
|
|
|
|
chrX_-_24600661
|
0.844
|
NM_001163264
|
PCYT1B
|
phosphate cytidylyltransferase 1, choline, beta
|
|
chr10_-_32707549
|
0.828
|
|
EPC1
|
enhancer of polycomb homolog 1 (Drosophila)
|
|
chr12_-_101835183
|
0.819
|
|
PAH
|
phenylalanine hydroxylase
|
|
chr20_+_5935897
|
0.808
|
NM_001127458
|
CRLS1
|
cardiolipin synthase 1
|
|
chr9_-_85773899
|
0.805
|
|
HNRNPK
|
heterogeneous nuclear ribonucleoprotein K
|
|
chr13_-_47885018
|
0.804
|
|
LPAR6
|
lysophosphatidic acid receptor 6
|
|
chr10_+_63331401
|
0.803
|
|
ARID5B
|
AT rich interactive domain 5B (MRF1-like)
|
|
chr5_-_125956996
|
0.799
|
|
ALDH7A1
|
aldehyde dehydrogenase 7 family, member A1
|
|
chr11_+_57285809
|
0.790
|
NM_001085458
NM_001085459
NM_001085460
NM_001085461
NM_001085462
NM_001085463
NM_001085464
NM_001085465
NM_001085466
NM_001085467
NM_001085468
NM_001085469
NM_001331
|
CTNND1
|
catenin (cadherin-associated protein), delta 1
|
|
chr11_+_20005704
|
0.789
|
|
NAV2
|
neuron navigator 2
|
|
chr12_-_6103945
|
0.778
|
NM_000552
|
VWF
|
von Willebrand factor
|
|
chr2_-_238164042
|
0.772
|
|
RAB17
|
RAB17, member RAS oncogene family
|
|
chr7_+_111633878
|
0.769
|
NM_021994
|
ZNF277
|
zinc finger protein 277
|
|
chr2_-_180135559
|
0.766
|
NM_001113398
|
ZNF385B
|
zinc finger protein 385B
|
|
chr14_+_62740878
|
0.765
|
NM_020663
|
RHOJ
|
ras homolog gene family, member J
|
|
chr1_-_57057956
|
0.762
|
NM_001004303
|
C1orf168
|
chromosome 1 open reading frame 168
|
|
chr13_-_47885248
|
0.761
|
|
LPAR6
|
lysophosphatidic acid receptor 6
|
|
chr2_-_164300758
|
0.761
|
NM_018086
|
FIGN
|
fidgetin
|
|
chr10_+_101532544
|
0.758
|
|
ABCC2
|
ATP-binding cassette, sub-family C (CFTR/MRP), member 2
|
|
chr1_+_61642287
|
0.755
|
|
NFIA
|
nuclear factor I/A
|
|
chr2_-_70329067
|
0.748
|
NM_022037
NM_022173
|
TIA1
|
TIA1 cytotoxic granule-associated RNA binding protein
|
|
chr20_-_45418818
|
0.739
|
NM_012408
NM_183047
NM_183048
|
ZMYND8
|
zinc finger, MYND-type containing 8
|
|
chr7_-_100077072
|
0.736
|
NM_003227
|
TFR2
|
transferrin receptor 2
|
|
chr1_+_148603769
|
0.736
|
|
RPRD2
|
regulation of nuclear pre-mRNA domain containing 2
|
|
chr7_-_11838260
|
0.733
|
NM_015204
|
THSD7A
|
thrombospondin, type I, domain containing 7A
|
|
chr2_-_192419896
|
0.730
|
|
SDPR
|
serum deprivation response
|
|
chr14_-_19871267
|
0.715
|
NM_021178
NM_182849
|
CCNB1IP1
|
cyclin B1 interacting protein 1, E3 ubiquitin protein ligase
|
|
chr21_-_38792173
|
0.710
|
NM_001136155
NM_182918
|
ERG
|
v-ets erythroblastosis virus E26 oncogene homolog (avian)
|
|
chr12_-_101835026
|
0.709
|
|
PAH
|
phenylalanine hydroxylase
|
|
chr18_+_3441589
|
0.706
|
NM_170695
NM_173210
|
TGIF1
|
TGFB-induced factor homeobox 1
|
|
chrX_+_70419766
|
0.703
|
NM_001145408
NM_001145409
NM_001145410
NM_007363
|
NONO
|
non-POU domain containing, octamer-binding
|
|
chr2_+_62787534
|
0.701
|
NM_001142614
|
EHBP1
|
EH domain binding protein 1
|
|
chr3_-_189354510
|
0.695
|
|
LOC339929
|
hypothetical LOC339929
|
|
chr9_-_74757735
|
0.695
|
NM_000689
|
ALDH1A1
|
aldehyde dehydrogenase 1 family, member A1
|
|
chr3_+_52803823
|
0.689
|
NM_002217
|
ITIH3
|
inter-alpha (globulin) inhibitor H3
|
|
chr16_-_66535457
|
0.687
|
NM_000229
|
LCAT
|
lecithin-cholesterol acyltransferase
|
|
chr3_+_189354167
|
0.683
|
NM_001167672
|
LPP
|
LIM domain containing preferred translocation partner in lipoma
|
|
chr3_-_115825742
|
0.673
|
NM_001164347
|
ZBTB20
|
zinc finger and BTB domain containing 20
|
|
chr2_-_21084077
|
0.671
|
|
APOB
|
apolipoprotein B (including Ag(x) antigen)
|
|
chr12_+_14429499
|
0.668
|
|
ATF7IP
|
activating transcription factor 7 interacting protein
|
|
chr17_-_59818033
|
0.666
|
|
PECAM1
|
platelet/endothelial cell adhesion molecule
|
|
chrX_-_107569256
|
0.662
|
NM_001847
|
COL4A6
|
collagen, type IV, alpha 6
|
|
chr19_+_50663089
|
0.660
|
NM_001114171
NM_006732
|
FOSB
|
FBJ murine osteosarcoma viral oncogene homolog B
|
|
chr17_-_59817722
|
0.658
|
NM_000442
|
PECAM1
|
platelet/endothelial cell adhesion molecule
|
|
chr13_-_40491491
|
0.657
|
NM_172373
|
ELF1
|
E74-like factor 1 (ets domain transcription factor)
|
|
chr8_+_26206648
|
0.656
|
NM_001177591
|
PPP2R2A
|
protein phosphatase 2, regulatory subunit B, alpha
|
|
chr17_-_59817654
|
0.647
|
|
PECAM1
|
platelet/endothelial cell adhesion molecule
|
|
chr1_+_148603613
|
0.647
|
NM_015203
|
RPRD2
|
regulation of nuclear pre-mRNA domain containing 2
|
|
chr1_+_148603208
|
0.647
|
|
RPRD2
|
regulation of nuclear pre-mRNA domain containing 2
|
|
chr10_+_92970302
|
0.644
|
NM_032373
|
PCGF5
|
polycomb group ring finger 5
|
|
chr12_-_110410730
|
0.637
|
|
ATXN2
|
ataxin 2
|
|
chr7_+_111633972
|
0.634
|
|
ZNF277
|
zinc finger protein 277
|
|
chr2_+_143351536
|
0.634
|
NM_001032998
NM_003937
|
KYNU
|
kynureninase
|
|
chr11_+_129496792
|
0.632
|
|
APLP2
|
amyloid beta (A4) precursor-like protein 2
|
|
chr3_-_71715431
|
0.616
|
NM_001012505
NM_032682
|
FOXP1
|
forkhead box P1
|
|
chr12_+_32546243
|
0.615
|
NM_139241
|
FGD4
|
FYVE, RhoGEF and PH domain containing 4
|
|
chr13_-_40491405
|
0.612
|
|
ELF1
|
E74-like factor 1 (ets domain transcription factor)
|
|
chr14_-_60260211
|
0.611
|
NM_017420
|
SIX4
|
SIX homeobox 4
|
|
chr6_-_143813481
|
0.606
|
NM_182503
|
ADAT2
|
adenosine deaminase, tRNA-specific 2, TAD2 homolog (S. cerevisiae)
|
|
chr1_+_29113589
|
0.598
|
NM_001166006
|
EPB41
|
erythrocyte membrane protein band 4.1 (elliptocytosis 1, RH-linked)
|
|
chr12_+_51730101
|
0.596
|
NM_170754
|
TENC1
|
tensin like C1 domain containing phosphatase (tensin 2)
|
|
chr4_+_100714995
|
0.593
|
|
MTTP
|
microsomal triglyceride transfer protein
|
|
chr11_+_111313067
|
0.593
|
NM_001037954
|
DIXDC1
|
DIX domain containing 1
|
|
chr9_+_115265827
|
0.591
|
NM_017790
|
RGS3
|
regulator of G-protein signaling 3
|
|
chr10_+_92970487
|
0.587
|
|
PCGF5
|
polycomb group ring finger 5
|
|
chr9_-_128910132
|
0.583
|
|
ANGPTL2
|
angiopoietin-like 2
|
|
chr20_+_254205
|
0.579
|
NM_006943
|
SOX12
|
SRY (sex determining region Y)-box 12
|
|
chr9_+_138810610
|
0.574
|
NM_001039374
|
KIAA1984
|
KIAA1984
|
|
chr6_+_43135346
|
0.573
|
NM_138343
NM_201521
|
KLC4
|
kinesin light chain 4
|
|
chr14_+_22860511
|
0.573
|
|
PABPN1
|
poly(A) binding protein, nuclear 1
|
|
chr7_-_96471544
|
0.571
|
|
DLX6-AS1
|
DLX6 antisense RNA 1 (non-protein coding)
|
|
chr9_-_106730256
|
0.569
|
NM_005502
|
ABCA1
|
ATP-binding cassette, sub-family A (ABC1), member 1
|
|
chr17_+_56032271
|
0.568
|
NM_003620
|
PPM1D
|
protein phosphatase, Mg2+/Mn2+ dependent, 1D
|
|
chr15_-_32398220
|
0.565
|
NM_005135
|
SLC12A6
|
solute carrier family 12 (potassium/chloride transporters), member 6
|
|
chr14_+_38772870
|
0.565
|
NM_054024
|
MIA2
|
melanoma inhibitory activity 2
|
|
chrX_+_152562013
|
0.565
|
|
DUSP9
|
dual specificity phosphatase 9
|
|
chr6_+_37245860
|
0.564
|
NM_002648
|
PIM1
|
pim-1 oncogene
|
|
chr8_-_82769761
|
0.561
|
NM_001010893
|
SLC10A5
|
solute carrier family 10 (sodium/bile acid cotransporter family), member 5
|
|
chr16_-_45562840
|
0.559
|
|
DNAJA2
|
DnaJ (Hsp40) homolog, subfamily A, member 2
|
|
chr1_-_7998265
|
0.557
|
|
ERRFI1
|
ERBB receptor feedback inhibitor 1
|
|
chr10_-_101831579
|
0.556
|
NM_001308
|
CPN1
|
carboxypeptidase N, polypeptide 1
|
|
chr4_+_71096830
|
0.552
|
NM_017855
|
ODAM
|
odontogenic, ameloblast asssociated
|
|
chr5_-_178977441
|
0.549
|
|
HNRNPH1
|
heterogeneous nuclear ribonucleoprotein H1 (H)
|
|
chr12_+_52960798
|
0.548
|
|
HNRNPA1L2
HNRNPA1
HNRNPA1P10
|
heterogeneous nuclear ribonucleoprotein A1-like 2
heterogeneous nuclear ribonucleoprotein A1
heterogeneous nuclear ribonucleoprotein A1 pseudogene 10
|
|
chr15_+_74416156
|
0.547
|
NM_145805
|
ISL2
|
ISL LIM homeobox 2
|
|
chr14_+_22860547
|
0.545
|
|
PABPN1
|
poly(A) binding protein, nuclear 1
|
|
chr5_+_34723420
|
0.544
|
NM_001145523
|
RAI14
|
retinoic acid induced 14
|
|
chr12_+_56114724
|
0.544
|
NM_005538
|
INHBC
|
inhibin, beta C
|
|
chr18_+_53862386
|
0.538
|
NM_001144967
NM_015277
|
NEDD4L
|
neural precursor cell expressed, developmentally down-regulated 4-like
|
|
chr4_-_76817582
|
0.536
|
|
G3BP2
|
GTPase activating protein (SH3 domain) binding protein 2
|
|
chr4_-_155731288
|
0.535
|
NM_000508
NM_021871
|
FGA
|
fibrinogen alpha chain
|
|
chr1_-_229627412
|
0.534
|
NM_022051
|
EGLN1
|
egl nine homolog 1 (C. elegans)
|
|
chr2_+_201755865
|
0.534
|
NM_001230
NM_032974
NM_032977
|
CASP10
|
caspase 10, apoptosis-related cysteine peptidase
|
|
chr8_+_21980315
|
0.531
|
|
EPB49
|
erythrocyte membrane protein band 4.9 (dematin)
|
|
chr1_-_151910080
|
0.530
|
|
ILF2
|
interleukin enhancer binding factor 2, 45kDa
|
|
chr12_+_50633430
|
0.529
|
NM_020327
|
ACVR1B
|
activin A receptor, type IB
|
|
chr1_-_151910041
|
0.526
|
|
ILF2
|
interleukin enhancer binding factor 2, 45kDa
|
|
chr15_+_74416129
|
0.524
|
|
ISL2
|
ISL LIM homeobox 2
|
|
chr2_-_160181206
|
0.522
|
NM_013450
|
BAZ2B
|
bromodomain adjacent to zinc finger domain, 2B
|
|
chr6_+_43135606
|
0.521
|
NM_201523
|
KLC4
|
kinesin light chain 4
|
|
chr17_-_23721420
|
0.520
|
|
VTN
|
vitronectin
|
|
chr17_-_23721351
|
0.520
|
|
VTN
|
vitronectin
|
|
chr11_+_20000938
|
0.518
|
|
NAV2
|
neuron navigator 2
|
|
chr10_+_5228756
|
0.517
|
NM_001818
|
AKR1C4
|
aldo-keto reductase family 1, member C4 (chlordecone reductase; 3-alpha hydroxysteroid dehydrogenase, type I; dihydrodiol dehydrogenase 4)
|
|
chr4_-_76817635
|
0.517
|
NM_203504
NM_203505
|
G3BP2
|
GTPase activating protein (SH3 domain) binding protein 2
|
|
chr4_+_90252990
|
0.515
|
NM_145715
|
TIGD2
|
tigger transposable element derived 2
|
|
chr3_-_51976428
|
0.514
|
NM_020418
NM_001174100
NM_033008
|
PCBP4
|
poly(rC) binding protein 4
|
|
chr14_+_38653177
|
0.514
|
NM_001009182
NM_001009183
NM_003616
|
SIP1
|
survival of motor neuron protein interacting protein 1
|
|
chr14_+_34583863
|
0.513
|
NM_001079519
|
FAM177A1
|
family with sequence similarity 177, member A1
|
|
chr13_+_97593469
|
0.513
|
|
FARP1
|
FERM, RhoGEF (ARHGEF) and pleckstrin domain protein 1 (chondrocyte-derived)
|
|
chr4_-_76817587
|
0.510
|
|
G3BP2
|
GTPase activating protein (SH3 domain) binding protein 2
|
|
chr1_-_151910052
|
0.509
|
|
ILF2
|
interleukin enhancer binding factor 2, 45kDa
|
|
chr1_+_45926433
|
0.509
|
NM_016486
|
TMEM69
|
transmembrane protein 69
|