|
chr19_-_48815572
|
5.453
|
|
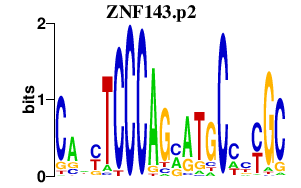
ZNF428
|
zinc finger protein 428
|
|
chr15_-_62173041
|
4.801
|
NM_001014812
NM_032231
|
FAM96A
|
family with sequence similarity 96, member A
|
|
chr20_+_55399847
|
4.698
|
NM_017495
NM_183425
|
RBM38
|
RNA binding motif protein 38
|
|
chr8_+_145705253
|
4.452
|
NM_138431
|
MFSD3
|
major facilitator superfamily domain containing 3
|
|
chr6_+_43705254
|
3.970
|
NM_001003690
|
MAD2L1BP
|
MAD2L1 binding protein
|
|
chr1_+_44978145
|
3.830
|
|
KIF2C
|
kinesin family member 2C
|
|
chr19_+_10261646
|
3.773
|
NM_003259
|
ICAM5
|
intercellular adhesion molecule 5, telencephalin
|
|
chr1_+_44978120
|
3.743
|
|
KIF2C
|
kinesin family member 2C
|
|
chr16_-_30841938
|
3.626
|
|
NCRNA00095
|
non-protein coding RNA 95
|
|
chr19_-_47438548
|
3.592
|
|
GSK3A
|
glycogen synthase kinase 3 alpha
|
|
chr1_+_45738442
|
3.499
|
NM_015506
|
MMACHC
|
methylmalonic aciduria (cobalamin deficiency) cblC type, with homocystinuria
|
|
chr16_-_69030421
|
3.429
|
NM_006927
|
ST3GAL2
|
ST3 beta-galactoside alpha-2,3-sialyltransferase 2
|
|
chr19_-_47438518
|
3.338
|
|
GSK3A
|
glycogen synthase kinase 3 alpha
|
|
chr1_+_44978053
|
3.252
|
NM_006845
|
KIF2C
|
kinesin family member 2C
|
|
chr19_-_47438583
|
3.199
|
|
GSK3A
|
glycogen synthase kinase 3 alpha
|
|
chr6_-_43704742
|
3.085
|
|
GTPBP2
|
GTP binding protein 2
|
|
chr5_+_85949511
|
3.083
|
|
COX7C
|
cytochrome c oxidase subunit VIIc
|
|
chr22_+_19666575
|
3.012
|
|
LZTR1
|
leucine-zipper-like transcription regulator 1
|
|
chr16_+_2742320
|
2.977
|
NM_016333
|
SRRM2
|
serine/arginine repetitive matrix 2
|
|
chr22_+_19666616
|
2.969
|
|
LZTR1
|
leucine-zipper-like transcription regulator 1
|
|
chr22_+_19666508
|
2.966
|
NM_006767
|
LZTR1
|
leucine-zipper-like transcription regulator 1
|
|
chr22_+_18447732
|
2.897
|
NM_001190326
NM_022720
|
DGCR8
|
DiGeorge syndrome critical region gene 8
|
|
chr2_+_74610751
|
2.789
|
|
HTRA2
|
HtrA serine peptidase 2
|
|
chr19_-_47438563
|
2.746
|
NM_019884
|
GSK3A
|
glycogen synthase kinase 3 alpha
|
|
chr6_-_43704955
|
2.730
|
|
GTPBP2
|
GTP binding protein 2
|
|
chr4_-_1692776
|
2.691
|
NM_001127266
NM_138385
|
TMEM129
|
transmembrane protein 129
|
|
chr6_-_43704897
|
2.662
|
NM_019096
|
GTPBP2
|
GTP binding protein 2
|
|
chr8_-_145881968
|
2.659
|
|
ARHGAP39
|
Rho GTPase activating protein 39
|
|
chr5_+_85949518
|
2.657
|
NM_001867
|
COX7C
|
cytochrome c oxidase subunit VIIc
|
|
chr19_+_61344501
|
2.651
|
|
ZNF444
|
zinc finger protein 444
|
|
chr6_-_27548438
|
2.574
|
NM_007149
|
ZNF184
|
zinc finger protein 184
|
|
chr15_-_38886937
|
2.521
|
|
DNAJC17
|
DnaJ (Hsp40) homolog, subfamily C, member 17
|
|
chr7_-_98901699
|
2.514
|
NM_001198879
NM_001190353
NM_001190354
NM_001003713
NM_001003714
NM_001039178
NM_004889
|
ATP5J2-PTCD1
ATP5J2
|
ATP5J2-PTCD1 readthrough
ATP synthase, H+ transporting, mitochondrial Fo complex, subunit F2
|
|
chr16_-_30010705
|
2.469
|
NM_004608
|
TBX6
|
T-box 6
|
|
chr1_-_21982256
|
2.452
|
NM_001032730
NM_032236
|
USP48
|
ubiquitin specific peptidase 48
|
|
chr19_-_47438384
|
2.430
|
|
GSK3A
|
glycogen synthase kinase 3 alpha
|
|
chr17_-_38204208
|
2.413
|
NM_001040431
|
CCDC56
|
coiled-coil domain containing 56
|
|
chr12_-_47532171
|
2.407
|
NM_004818
|
DDX23
|
DEAD (Asp-Glu-Ala-Asp) box polypeptide 23
|
|
chrX_+_70232362
|
2.396
|
NM_001170931
NM_005938
|
FOXO4
|
forkhead box O4
|
|
chr15_+_38240501
|
2.385
|
NM_001211
|
BUB1B
|
budding uninhibited by benzimidazoles 1 homolog beta (yeast)
|
|
chr19_+_61344341
|
2.377
|
NM_018337
|
ZNF444
|
zinc finger protein 444
|
|
chr19_-_48815853
|
2.312
|
NM_182498
|
ZNF428
|
zinc finger protein 428
|
|
chr15_-_38886961
|
2.305
|
NM_018163
|
DNAJC17
|
DnaJ (Hsp40) homolog, subfamily C, member 17
|
|
chr19_+_3136860
|
2.304
|
NM_020170
|
NCLN
|
nicalin
|
|
chr4_-_1692574
|
2.278
|
|
TMEM129
|
transmembrane protein 129
|
|
chr15_+_38240555
|
2.269
|
|
BUB1B
|
budding uninhibited by benzimidazoles 1 homolog beta (yeast)
|
|
chr19_+_59310601
|
2.227
|
NM_015629
|
PRPF31
|
PRP31 pre-mRNA processing factor 31 homolog (S. cerevisiae)
|
|
chr17_+_38531134
|
2.206
|
|
NBR2
|
neighbor of BRCA1 gene 2 (non-protein coding)
|
|
chr19_+_3136927
|
2.156
|
|
NCLN
|
nicalin
|
|
chr17_-_38204254
|
2.146
|
|
CCDC56
|
coiled-coil domain containing 56
|
|
chr19_+_12778391
|
2.142
|
|
RNASEH2A
|
ribonuclease H2, subunit A
|
|
chr19_+_53365748
|
2.123
|
|
C19orf68
|
chromosome 19 open reading frame 68
|
|
chr19_+_3136965
|
2.098
|
|
NCLN
|
nicalin
|
|
chr20_-_47238082
|
2.065
|
|
STAU1
|
staufen, RNA binding protein, homolog 1 (Drosophila)
|
|
chr2_+_74610666
|
2.065
|
|
HTRA2
|
HtrA serine peptidase 2
|
|
chr15_+_38886546
|
2.041
|
NM_001077268
|
ZFYVE19
|
zinc finger, FYVE domain containing 19
|
|
chr20_+_41576459
|
2.026
|
NM_015478
|
L3MBTL1
|
l(3)mbt-like 1 (Drosophila)
|
|
chr4_+_1693031
|
2.016
|
NM_006342
|
TACC3
|
transforming, acidic coiled-coil containing protein 3
|
|
chr17_+_73721924
|
2.011
|
|
BIRC5
|
baculoviral IAP repeat containing 5
|
|
chr12_+_56168120
|
1.983
|
|
MARS
|
methionyl-tRNA synthetase
|
|
chr12_+_56168082
|
1.973
|
NM_004990
|
MARS
|
methionyl-tRNA synthetase
|
|
chr1_-_54076695
|
1.941
|
NM_001168551
NM_018087
|
TMEM48
|
transmembrane protein 48
|
|
chr8_-_28803341
|
1.911
|
NM_001172562
|
INTS9
|
integrator complex subunit 9
|
|
chr8_+_30721208
|
1.907
|
NM_005671
|
UBXN8
|
UBX domain protein 8
|
|
chr15_+_72969404
|
1.903
|
NM_002435
|
MPI
|
mannose phosphate isomerase
|
|
chr12_+_54721952
|
1.902
|
NM_001029
|
RPS26
|
ribosomal protein S26
|
|
chr17_+_71292275
|
1.850
|
NM_001080419
|
UNK
|
unkempt homolog (Drosophila)
|
|
chr12_+_54784632
|
1.844
|
|
PA2G4
|
proliferation-associated 2G4, 38kDa
|
|
chr5_-_134397740
|
1.823
|
NM_002653
|
PITX1
|
paired-like homeodomain 1
|
|
chr19_+_55045754
|
1.801
|
|
PTOV1
|
prostate tumor overexpressed 1
|
|
chr6_-_119712596
|
1.788
|
NM_005907
|
MAN1A1
|
mannosidase, alpha, class 1A, member 1
|
|
chr7_+_149696901
|
1.773
|
|
REPIN1
|
replication initiator 1
|
|
chr17_+_71292535
|
1.767
|
|
|
|
|
chr17_+_24206100
|
1.761
|
NM_005702
|
ERAL1
|
Era G-protein-like 1 (E. coli)
|
|
chr16_+_1949517
|
1.743
|
NM_004548
|
NDUFB10
|
NADH dehydrogenase (ubiquinone) 1 beta subcomplex, 10, 22kDa
|
|
chr2_+_38746742
|
1.741
|
|
GALM
|
galactose mutarotase (aldose 1-epimerase)
|
|
chr12_+_54784614
|
1.728
|
|
PA2G4
|
proliferation-associated 2G4, 38kDa
|
|
chr8_+_28803804
|
1.725
|
NM_001135726
|
HMBOX1
|
homeobox containing 1
|
|
chr17_-_44847215
|
1.717
|
NM_002634
|
PHB
|
prohibitin
|
|
chr1_+_52294563
|
1.714
|
|
BTF3L4
|
basic transcription factor 3-like 4
|
|
chr17_+_73721871
|
1.704
|
NM_001012270
NM_001012271
NM_001168
|
BIRC5
|
baculoviral IAP repeat containing 5
|
|
chr1_+_52294554
|
1.703
|
|
BTF3L4
|
basic transcription factor 3-like 4
|
|
chr17_+_77574476
|
1.699
|
NM_144999
|
LRRC45
|
leucine rich repeat containing 45
|
|
chr19_-_53365371
|
1.693
|
NM_000234
|
LIG1
|
ligase I, DNA, ATP-dependent
|
|
chr9_-_116305273
|
1.685
|
NM_001083885
|
DFNB31
|
deafness, autosomal recessive 31
|
|
chr14_+_106009489
|
1.684
|
|
NCRNA00221
|
non-protein coding RNA 221
|
|
chr8_-_41774296
|
1.678
|
NM_000037
NM_020475
NM_020476
NM_020477
|
ANK1
|
ankyrin 1, erythrocytic
|
|
chr1_-_54076521
|
1.674
|
|
TMEM48
|
transmembrane protein 48
|
|
chr12_+_54784591
|
1.647
|
|
PA2G4
|
proliferation-associated 2G4, 38kDa
|
|
chr17_+_71292437
|
1.637
|
|
UNK
|
unkempt homolog (Drosophila)
|
|
chr19_+_12778409
|
1.615
|
NM_006397
|
RNASEH2A
|
ribonuclease H2, subunit A
|
|
chr12_+_52181643
|
1.608
|
NM_134324
|
TARBP2
|
TAR (HIV-1) RNA binding protein 2
|
|
chr1_+_52294444
|
1.608
|
NM_001136497
NM_152265
|
BTF3L4
|
basic transcription factor 3-like 4
|
|
chr12_+_54784625
|
1.607
|
|
PA2G4
|
proliferation-associated 2G4, 38kDa
|
|
chr12_+_54784681
|
1.605
|
|
PA2G4
|
proliferation-associated 2G4, 38kDa
|
|
chr17_+_38204335
|
1.594
|
NM_173478
|
CNTD1
|
cyclin N-terminal domain containing 1
|
|
chr17_-_44847214
|
1.592
|
|
PHB
|
prohibitin
|
|
chr16_+_56286212
|
1.592
|
NM_032269
|
CCDC135
|
coiled-coil domain containing 135
|
|
chr22_+_24468168
|
1.589
|
|
MYO18B
|
myosin XVIIIB
|
|
chr8_+_67742348
|
1.588
|
|
C8orf44
|
chromosome 8 open reading frame 44
|
|
chr2_+_38746555
|
1.577
|
NM_138801
|
GALM
|
galactose mutarotase (aldose 1-epimerase)
|
|
chrX_+_37429927
|
1.573
|
NM_021083
|
XK
|
X-linked Kx blood group (McLeod syndrome)
|
|
chr20_+_30409649
|
1.561
|
NM_001164603
NM_015338
|
ASXL1
|
additional sex combs like 1 (Drosophila)
|
|
chr6_+_4948995
|
1.552
|
|
LOC285778
|
hypothetical protein LOC285778
|
|
chr12_+_54784600
|
1.541
|
|
PA2G4
|
proliferation-associated 2G4, 38kDa
|
|
chr8_-_144770764
|
1.538
|
|
TSTA3
|
tissue specific transplantation antigen P35B
|
|
chr2_+_74610494
|
1.532
|
|
HTRA2
|
HtrA serine peptidase 2
|
|
chr20_-_47238310
|
1.527
|
NM_001037328
NM_004602
NM_017452
NM_017453
NM_017454
|
STAU1
|
staufen, RNA binding protein, homolog 1 (Drosophila)
|
|
chr2_-_74610323
|
1.507
|
|
AUP1
|
ancient ubiquitous protein 1
|
|
chr16_+_66902369
|
1.505
|
NM_001184824
NM_019023
|
PRMT7
|
protein arginine methyltransferase 7
|
|
chr6_-_4949237
|
1.502
|
NM_006638
|
RPP40
|
ribonuclease P/MRP 40kDa subunit
|
|
chr14_-_23095240
|
1.498
|
|
|
|
|
chr11_-_82675024
|
1.471
|
NM_021825
|
CCDC90B
|
coiled-coil domain containing 90B
|
|
chr19_-_42650178
|
1.466
|
NM_152484
|
ZNF569
|
zinc finger protein 569
|
|
chr2_-_74610481
|
1.463
|
NM_181575
|
AUP1
|
ancient ubiquitous protein 1
|
|
chr16_+_2742606
|
1.462
|
|
SRRM2
|
serine/arginine repetitive matrix 2
|
|
chr2_-_86186441
|
1.458
|
|
POLR1A
|
polymerase (RNA) I polypeptide A, 194kDa
|
|
chr2_+_27109327
|
1.458
|
|
TMEM214
|
transmembrane protein 214
|
|
chr12_+_54784369
|
1.454
|
NM_006191
|
PA2G4
|
proliferation-associated 2G4, 38kDa
|
|
chr3_+_4320036
|
1.449
|
|
SETMAR
|
SET domain and mariner transposase fusion gene
|
|
chr16_-_1933268
|
1.442
|
NM_016332
|
SEPX1
|
selenoprotein X, 1
|
|
chr1_+_63022359
|
1.438
|
NM_032852
NM_178221
|
ATG4C
|
ATG4 autophagy related 4 homolog C (S. cerevisiae)
|
|
chr1_-_10455190
|
1.437
|
NM_004401
NM_213566
|
DFFA
|
DNA fragmentation factor, 45kDa, alpha polypeptide
|
|
chr3_+_4319987
|
1.435
|
NM_006515
|
SETMAR
|
SET domain and mariner transposase fusion gene
|
|
chr2_+_74610624
|
1.427
|
|
HTRA2
|
HtrA serine peptidase 2
|
|
chr2_+_74610395
|
1.427
|
|
HTRA2
|
HtrA serine peptidase 2
|
|
chr2_+_27109341
|
1.425
|
|
TMEM214
|
transmembrane protein 214
|
|
chr2_+_74610635
|
1.423
|
|
HTRA2
|
HtrA serine peptidase 2
|
|
chr19_+_49290319
|
1.405
|
NM_013398
|
ZNF224
|
zinc finger protein 224
|
|
chr20_+_61760084
|
1.392
|
NM_016434
NM_032957
|
RTEL1
|
regulator of telomere elongation helicase 1
|
|
chr16_+_23597692
|
1.390
|
NM_005030
|
PLK1
|
polo-like kinase 1
|
|
chr22_+_19078397
|
1.389
|
NM_003426
|
ZNF74
|
zinc finger protein 74
|
|
chr16_+_23597691
|
1.382
|
|
PLK1
|
polo-like kinase 1
|
|
chr7_+_73709943
|
1.368
|
NM_001163636
NM_001518
NM_032999
NM_033000
NM_033001
|
GTF2I
|
general transcription factor IIi
|
|
chr2_-_74610331
|
1.362
|
|
AUP1
|
ancient ubiquitous protein 1
|
|
chr14_+_23095028
|
1.361
|
NM_001126339
NM_024328
|
THTPA
|
thiamine triphosphatase
|
|
chr9_-_137992766
|
1.356
|
|
UBAC1
|
UBA domain containing 1
|
|
chr16_-_4605003
|
1.355
|
|
FAM100A
|
family with sequence similarity 100, member A
|
|
chr8_-_144770838
|
1.351
|
|
TSTA3
|
tissue specific transplantation antigen P35B
|
|
chr16_+_23597735
|
1.350
|
|
PLK1
|
polo-like kinase 1
|
|
chr16_+_23597661
|
1.347
|
|
PLK1
|
polo-like kinase 1
|
|
chr17_+_37694007
|
1.344
|
|
STAT5A
|
signal transducer and activator of transcription 5A
|
|
chr16_+_2742704
|
1.339
|
|
SRRM2
|
serine/arginine repetitive matrix 2
|
|
chr1_-_26197121
|
1.339
|
NM_000437
|
PAFAH2
|
platelet-activating factor acetylhydrolase 2, 40kDa
|
|
chr16_-_1933209
|
1.336
|
|
SEPX1
|
selenoprotein X, 1
|
|
chr1_-_45578193
|
1.334
|
NM_001048174
NM_001048172
NM_001048173
NM_001048171
NM_001128425
NM_012222
|
MUTYH
|
mutY homolog (E. coli)
|
|
chr19_+_54160468
|
1.332
|
|
FTL
|
ferritin, light polypeptide
|
|
chr7_+_73709974
|
1.324
|
|
GTF2I
|
general transcription factor IIi
|
|
chr16_-_626293
|
1.323
|
NM_001040160
NM_001040161
NM_001040162
NM_001040165
NM_032366
|
C16orf13
|
chromosome 16 open reading frame 13
|
|
chr8_-_144770859
|
1.323
|
NM_003313
|
TSTA3
|
tissue specific transplantation antigen P35B
|
|
chr2_-_242096592
|
1.319
|
|
STK25
|
serine/threonine kinase 25
|
|
chr16_+_23597713
|
1.319
|
|
PLK1
|
polo-like kinase 1
|
|
chr11_+_47247718
|
1.312
|
NM_001135944
NM_003682
NM_130471
NM_130472
NM_130473
NM_130474
|
MADD
|
MAP-kinase activating death domain
|
|
chr1_-_247119908
|
1.310
|
NM_001193328
NM_017865
|
ZNF692
|
zinc finger protein 692
|
|
chr16_+_2742709
|
1.309
|
|
SRRM2
|
serine/arginine repetitive matrix 2
|
|
chr1_+_246087230
|
1.308
|
|
TRIM58
|
tripartite motif containing 58
|
|
chr11_-_64334752
|
1.307
|
NM_000244
NM_130799
NM_130802
|
MEN1
|
multiple endocrine neoplasia I
|
|
chr7_+_107171514
|
1.303
|
NM_024814
|
CBLL1
|
Cas-Br-M (murine) ecotropic retroviral transforming sequence-like 1
|
|
chr16_+_2742653
|
1.300
|
|
SRRM2
|
serine/arginine repetitive matrix 2
|
|
chr16_-_4604781
|
1.297
|
|
FAM100A
|
family with sequence similarity 100, member A
|
|
chr15_-_89276657
|
1.296
|
NM_198527
|
HDDC3
|
HD domain containing 3
|
|
chr11_+_64565118
|
1.295
|
|
SAC3D1
|
SAC3 domain containing 1
|
|
chr15_+_38843535
|
1.295
|
NM_005258
|
GCHFR
|
GTP cyclohydrolase I feedback regulator
|
|
chr19_+_63611819
|
1.291
|
NM_173548
|
ZNF584
|
zinc finger protein 584
|
|
chr16_-_4604895
|
1.290
|
NM_145253
|
FAM100A
|
family with sequence similarity 100, member A
|
|
chr1_-_10455100
|
1.287
|
|
DFFA
|
DNA fragmentation factor, 45kDa, alpha polypeptide
|
|
chr1_-_218168404
|
1.286
|
|
|
|
|
chr11_-_64334593
|
1.279
|
NM_130800
NM_130801
|
MEN1
|
multiple endocrine neoplasia I
|
|
chr11_-_63690069
|
1.276
|
NM_014067
|
MACROD1
|
MACRO domain containing 1
|
|
chrX_+_154764136
|
1.272
|
NM_001145149
NM_001185183
NM_005638
|
VAMP7
|
vesicle-associated membrane protein 7
|
|
chr17_-_77573974
|
1.271
|
NM_144998
|
STRA13
|
stimulated by retinoic acid 13 homolog (mouse)
|
|
chr19_+_55844446
|
1.270
|
NM_001195076
|
LOC342918
|
hypothetical protein LOC342918
|
|
chr6_+_42639714
|
1.266
|
NM_001184801
NM_015255
|
UBR2
|
ubiquitin protein ligase E3 component n-recognin 2
|
|
chr19_-_59310837
|
1.260
|
NM_013342
|
TFPT
|
TCF3 (E2A) fusion partner (in childhood Leukemia)
|
|
chr6_+_43711566
|
1.255
|
|
MAD2L1BP
|
MAD2L1 binding protein
|
|
chr16_+_2742657
|
1.252
|
|
SRRM2
|
serine/arginine repetitive matrix 2
|
|
chr2_-_74610346
|
1.249
|
|
AUP1
|
ancient ubiquitous protein 1
|
|
chr16_+_2742635
|
1.248
|
|
SRRM2
|
serine/arginine repetitive matrix 2
|
|
chr19_-_41955493
|
1.245
|
NM_001193552
|
ZNF850
|
zinc finger protein 850
|
|
chr16_+_2742684
|
1.244
|
|
SRRM2
|
serine/arginine repetitive matrix 2
|
|
chr16_-_1933190
|
1.243
|
|
SEPX1
|
selenoprotein X, 1
|
|
chr16_+_2742641
|
1.240
|
|
SRRM2
|
serine/arginine repetitive matrix 2
|
|
chr9_-_137992967
|
1.238
|
NM_016172
|
UBAC1
|
UBA domain containing 1
|
|
chr16_+_2742674
|
1.236
|
|
SRRM2
|
serine/arginine repetitive matrix 2
|
|
chr19_+_4742756
|
1.225
|
|
FEM1A
|
fem-1 homolog a (C. elegans)
|
|
chr6_-_31741369
|
1.223
|
|
GPANK1
|
G patch domain and ankyrin repeats 1
|
|
chr5_-_134397470
|
1.220
|
|
PITX1
|
paired-like homeodomain 1
|
|
chr6_+_43711532
|
1.219
|
NM_014628
|
MAD2L1BP
|
MAD2L1 binding protein
|
|
chr9_+_103200939
|
1.213
|
NM_003452
NM_197977
|
ZNF189
|
zinc finger protein 189
|
|
chr22_+_24468110
|
1.209
|
NM_032608
|
MYO18B
|
myosin XVIIIB
|
|
chr22_-_18222348
|
1.206
|
NM_053004
NM_024627
|
GNB1L
C22orf29
|
guanine nucleotide binding protein (G protein), beta polypeptide 1-like
chromosome 22 open reading frame 29
|
|
chr2_-_74610332
|
1.198
|
|
AUP1
|
ancient ubiquitous protein 1
|
|
chr6_+_57062974
|
1.197
|
|
ZNF451
|
zinc finger protein 451
|
|
chr19_-_1441403
|
1.196
|
NM_017573
|
PCSK4
|
proprotein convertase subtilisin/kexin type 4
|
|
chr1_-_247119516
|
1.193
|
NM_001136036
|
ZNF692
|
zinc finger protein 692
|
|
chr3_-_15081705
|
1.193
|
|
MRPS25
|
mitochondrial ribosomal protein S25
|
|
chr11_+_47247469
|
1.192
|
NM_130470
|
MADD
|
MAP-kinase activating death domain
|
|
chr2_-_169455167
|
1.189
|
NM_020675
|
SPC25
|
SPC25, NDC80 kinetochore complex component, homolog (S. cerevisiae)
|
|
chr11_+_64564971
|
1.185
|
|
SAC3D1
|
SAC3 domain containing 1
|
|
chr6_+_42639745
|
1.177
|
|
UBR2
|
ubiquitin protein ligase E3 component n-recognin 2
|