|
chr1_+_556968
|
2.545
|
|
|
|
|
chr9_-_205892
|
1.271
|
NM_152569
|
C9orf66
|
chromosome 9 open reading frame 66
|
|
chr18_+_27210737
|
1.213
|
NM_001134453
NM_177986
|
DSG4
|
desmoglein 4
|
|
chr2_+_166137091
|
1.196
|
NM_024969
|
CSRNP3
|
cysteine-serine-rich nuclear protein 3
|
|
chr21_-_14840506
|
1.196
|
NM_022136
|
SAMSN1
|
SAM domain, SH3 domain and nuclear localization signals 1
|
|
chr6_-_155818728
|
1.139
|
NM_015718
|
NOX3
|
NADPH oxidase 3
|
|
chr6_+_49575629
|
1.133
|
NM_001010904
|
GLYATL3
|
glycine-N-acyltransferase-like 3
|
|
chr9_-_99740243
|
1.100
|
NM_197978
|
HEMGN
|
hemogen
|
|
chr17_-_64752550
|
1.044
|
NM_080282
|
ABCA10
|
ATP-binding cassette, sub-family A (ABC1), member 10
|
|
chr17_-_36376663
|
1.035
|
NM_213656
|
KRT39
|
keratin 39
|
|
chr3_-_166278969
|
1.029
|
NM_001041
|
SI
|
sucrase-isomaltase (alpha-glucosidase)
|
|
chr3_+_174598937
|
1.014
|
NM_014932
|
NLGN1
|
neuroligin 1
|
|
chr1_-_156923111
|
0.993
|
NM_003126
|
SPTA1
|
spectrin, alpha, erythrocytic 1 (elliptocytosis 2)
|
|
chr7_+_113842284
|
0.986
|
NM_001172766
NM_014491
NM_148898
NM_148900
|
FOXP2
|
forkhead box P2
|
|
chr6_-_49820030
|
0.982
|
NM_001190986
NM_006061
|
CRISP3
|
cysteine-rich secretory protein 3
|
|
chr4_+_74520796
|
0.976
|
NM_001134
|
AFP
|
alpha-fetoprotein
|
|
chr17_-_10265991
|
0.961
|
NM_002472
|
MYH8
|
myosin, heavy chain 8, skeletal muscle, perinatal
|
|
chr14_+_67238355
|
0.960
|
NM_152443
|
RDH12
|
retinol dehydrogenase 12 (all-trans/9-cis/11-cis)
|
|
chr7_-_91632525
|
0.959
|
NM_001161528
|
LOC401387
|
leucine-rich repeat and death domain-containing protein
|
|
chr2_+_200031333
|
0.953
|
|
|
|
|
chr1_+_86707113
|
0.952
|
NM_001285
|
CLCA1
|
chloride channel accessory 1
|
|
chr2_+_102401580
|
0.907
|
NM_003853
|
IL18RAP
|
interleukin 18 receptor accessory protein
|
|
chr2_-_131073329
|
0.903
|
NM_032545
NM_001079530
|
CFC1
CFC1B
|
cripto, FRL-1, cryptic family 1
cripto, FRL-1, cryptic family 1B
|
|
chr10_-_21847126
|
0.902
|
|
|
|
|
chr12_+_79362256
|
0.891
|
NM_001145026
|
PTPRQ
|
protein tyrosine phosphatase, receptor type, Q
|
|
chr1_-_155936904
|
0.885
|
NM_052939
|
FCRL3
|
Fc receptor-like 3
|
|
chr4_-_163304567
|
0.877
|
NM_001128427
NM_001128428
NM_020116
|
FSTL5
|
follistatin-like 5
|
|
chr15_+_46285789
|
0.875
|
NM_000338
NM_001184832
|
SLC12A1
|
solute carrier family 12 (sodium/potassium/chloride transporters), member 1
|
|
chrX_-_18600108
|
0.875
|
NM_000330
|
RS1
|
retinoschisin 1
|
|
chr16_-_73012740
|
0.872
|
NM_001011880
|
CLEC18C
CLEC18A
CLEC18B
|
C-type lectin domain family 18, member C
C-type lectin domain family 18, member A
C-type lectin domain family 18, member B
|
|
chr15_-_96875133
|
0.861
|
NM_182562
|
FAM169B
|
family with sequence similarity 169, member B
|
|
chrX_+_99726445
|
0.858
|
NM_022144
|
TNMD
|
tenomodulin
|
|
chr17_+_25292748
|
0.841
|
NM_198529
|
EFCAB5
|
EF-hand calcium binding domain 5
|
|
chr11_-_16454493
|
0.816
|
NM_033326
|
SOX6
|
SRY (sex determining region Y)-box 6
|
|
chr10_+_44726635
|
0.802
|
NM_001123376
|
TMEM72
|
transmembrane protein 72
|
|
chr2_+_169465995
|
0.775
|
NM_001081686
NM_021176
|
G6PC2
|
glucose-6-phosphatase, catalytic, 2
|
|
chr8_-_72431274
|
0.772
|
NM_172058
NM_172059
NM_172060
|
EYA1
|
eyes absent homolog 1 (Drosophila)
|
|
chr16_+_20370359
|
0.772
|
NM_001010845
|
ACSM2A
|
acyl-CoA synthetase medium-chain family member 2A
|
|
chr6_-_25982418
|
0.761
|
NM_001098486
NM_006632
|
SLC17A3
|
solute carrier family 17 (sodium phosphate), member 3
|
|
chr6_+_12825818
|
0.746
|
NM_030948
|
PHACTR1
|
phosphatase and actin regulator 1
|
|
chr7_-_25234582
|
0.741
|
NM_022150
|
NPVF
|
neuropeptide VF precursor
|
|
chr2_+_161981046
|
0.737
|
|
TBR1
|
T-box, brain, 1
|
|
chr6_-_89984214
|
0.736
|
NM_002042
|
GABRR1
|
gamma-aminobutyric acid (GABA) receptor, rho 1
|
|
chr3_-_197726587
|
0.729
|
NM_001077657
|
C3orf43
|
chromosome 3 open reading frame 43
|
|
chr5_+_139485703
|
0.728
|
NM_001007189
|
C5orf53
|
chromosome 5 open reading frame 53
|
|
chr7_+_106897737
|
0.717
|
NM_005295
|
GPR22
|
G protein-coupled receptor 22
|
|
chr9_+_101628829
|
0.713
|
NM_173200
|
NR4A3
|
nuclear receptor subfamily 4, group A, member 3
|
|
chr1_+_557269
|
0.710
|
|
|
|
|
chr4_-_185376012
|
0.699
|
NM_153343
|
ENPP6
|
ectonucleotide pyrophosphatase/phosphodiesterase 6
|
|
chr13_+_112349358
|
0.679
|
NM_207440
|
C13orf35
|
chromosome 13 open reading frame 35
|
|
chr12_-_16321885
|
0.667
|
NM_001170798
|
SLC15A5
|
solute carrier family 15, member 5
|
|
chr3_-_184756101
|
0.664
|
NM_130446
|
KLHL6
|
kelch-like 6 (Drosophila)
|
|
chr2_+_158559936
|
0.663
|
NM_001135098
|
UPP2
|
uridine phosphorylase 2
|
|
chr5_-_22889192
|
0.661
|
|
CDH12
|
cadherin 12, type 2 (N-cadherin 2)
|
|
chr6_-_29163027
|
0.648
|
NM_001005226
|
OR2B3
|
olfactory receptor, family 2, subfamily B, member 3
|
|
chr6_-_33016561
|
0.643
|
NM_002118
|
HLA-DMB
|
major histocompatibility complex, class II, DM beta
|
|
chr2_-_69033515
|
0.636
|
NM_182536
|
GKN2
|
gastrokine 2
|
|
chr11_-_62668268
|
0.636
|
NM_001136506
|
SLC22A24
|
solute carrier family 22, member 24
|
|
chr2_-_144994038
|
0.633
|
|
ZEB2
|
zinc finger E-box binding homeobox 2
|
|
chr2_+_157822355
|
0.620
|
NM_014568
|
GALNT5
|
UDP-N-acetyl-alpha-D-galactosamine:polypeptide N-acetylgalactosaminyltransferase 5 (GalNAc-T5)
|
|
chr11_-_5279750
|
0.618
|
NM_033179
|
OR51B4
|
olfactory receptor, family 51, subfamily B, member 4
|
|
chr6_-_50097606
|
0.617
|
NM_001037497
NM_001037728
|
DEFB110
|
defensin, beta 110 locus
|
|
chr6_+_29249289
|
0.616
|
NM_030905
|
OR2J2
|
olfactory receptor, family 2, subfamily J, member 2
|
|
chr3_+_153074118
|
0.612
|
NM_033050
|
SUCNR1
|
succinate receptor 1
|
|
chr18_+_50409387
|
0.612
|
NM_173629
|
C18orf26
|
chromosome 18 open reading frame 26
|
|
chr10_-_17211795
|
0.608
|
NM_001081
|
CUBN
|
cubilin (intrinsic factor-cobalamin receptor)
|
|
chr6_+_50894397
|
0.605
|
NM_003221
|
TFAP2B
|
transcription factor AP-2 beta (activating enhancer binding protein 2 beta)
|
|
chr20_-_7869068
|
0.597
|
NM_017545
|
HAO1
|
hydroxyacid oxidase (glycolate oxidase) 1
|
|
chr1_+_67404756
|
0.597
|
NM_144701
|
IL23R
|
interleukin 23 receptor
|
|
chr2_+_204509698
|
0.597
|
NM_012092
|
ICOS
|
inducible T-cell co-stimulator
|
|
chr14_-_20098929
|
0.590
|
NM_001001673
NM_001110356
NM_001110357
NM_001110358
NM_001110359
NM_001110360
NM_001110361
|
RNASE9
|
ribonuclease, RNase A family, 9 (non-active)
|
|
chr15_+_48434397
|
0.589
|
|
LOC100129387
|
hypothetical LOC100129387
|
|
chr2_+_166034402
|
0.588
|
NM_001172173
|
CSRNP3
|
cysteine-serine-rich nuclear protein 3
|
|
chr7_-_15568099
|
0.584
|
NM_001004320
|
AGMO
|
alkylglycerol monooxygenase
|
|
chr17_+_4638966
|
0.582
|
NM_001014985
|
GLTPD2
|
glycolipid transfer protein domain containing 2
|
|
chr5_-_131907071
|
0.581
|
NM_000879
|
IL5
|
interleukin 5 (colony-stimulating factor, eosinophil)
|
|
chr8_-_102872354
|
0.579
|
|
NCALD
|
neurocalcin delta
|
|
chr14_-_91268136
|
0.574
|
NM_024764
|
CATSPERB
|
cation channel, sperm-associated, beta
|
|
chr11_-_55661769
|
0.570
|
NM_001004064
|
OR8J3
|
olfactory receptor, family 8, subfamily J, member 3
|
|
chrX_-_55074125
|
0.569
|
NM_000032
NM_001037967
NM_001037968
|
ALAS2
|
aminolevulinate, delta-, synthase 2
|
|
chr1_-_114215768
|
0.566
|
NM_001193431
NM_012411
NM_015967
|
PTPN22
|
protein tyrosine phosphatase, non-receptor type 22 (lymphoid)
|
|
chr1_+_152560179
|
0.565
|
NM_080429
|
AQP10
|
aquaporin 10
|
|
chr7_+_29840865
|
0.550
|
NM_001080529
|
WIPF3
|
WAS/WASL interacting protein family, member 3
|
|
chr5_-_22889487
|
0.545
|
NM_004061
|
CDH12
|
cadherin 12, type 2 (N-cadherin 2)
|
|
chr9_-_94226380
|
0.544
|
NM_005014
|
OMD
|
osteomodulin
|
|
chr11_+_59564323
|
0.544
|
NM_173801
|
PLAC1L
|
placenta-specific 1-like
|
|
chr9_+_134843918
|
0.537
|
NM_001135031
NM_004188
|
GFI1B
|
growth factor independent 1B transcription repressor
|
|
chr1_+_195503956
|
0.537
|
NM_001193640
NM_201253
|
CRB1
|
crumbs homolog 1 (Drosophila)
|
|
chr11_-_123685871
|
0.534
|
NM_001002917
|
OR8D1
|
olfactory receptor, family 8, subfamily D, member 1
|
|
chr16_+_68765428
|
0.531
|
NM_173619
|
CLEC18C
CLEC18A
CLEC18B
|
C-type lectin domain family 18, member C
C-type lectin domain family 18, member A
C-type lectin domain family 18, member B
|
|
chr2_+_161981138
|
0.530
|
|
TBR1
|
T-box, brain, 1
|
|
chr5_+_147672181
|
0.527
|
NM_032566
|
SPINK7
|
serine peptidase inhibitor, Kazal type 7 (putative)
|
|
chr1_-_115039614
|
0.522
|
NM_000036
NM_001172626
|
AMPD1
|
adenosine monophosphate deaminase 1
|
|
chr4_-_64957595
|
0.519
|
NM_001010874
|
TECRL
|
trans-2,3-enoyl-CoA reductase-like
|
|
chr2_-_87102453
|
0.513
|
NM_002665
NM_001032392
|
PLGLB2
PLGLB1
|
plasminogen-like B2
plasminogen-like B1
|
|
chr5_-_134290789
|
0.510
|
|
|
|
|
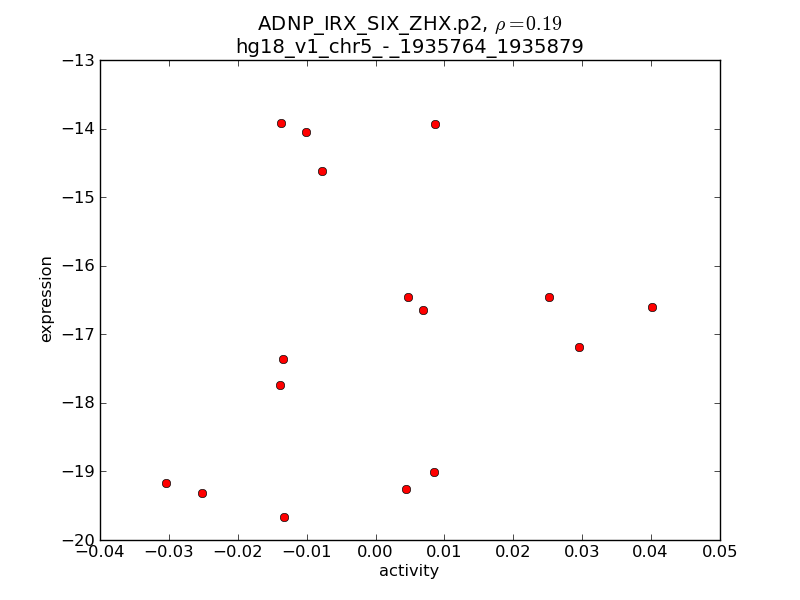
chr5_-_1935764
|
0.500
|
NM_016358
|
IRX4
|
iroquois homeobox 4
|
|
chr2_+_176677479
|
0.496
|
|
|
|
|
chr3_-_69254226
|
0.495
|
NM_198271
|
LMOD3
|
leiomodin 3 (fetal)
|
|
chr17_-_25685175
|
0.495
|
NM_206832
|
TMIGD1
|
transmembrane and immunoglobulin domain containing 1
|
|
chr5_+_60969392
|
0.494
|
NM_173667
|
FLJ37543
|
hypothetical protein FLJ37543
|
|
chr4_-_69116839
|
0.493
|
NM_001077
|
UGT2B17
|
UDP glucuronosyltransferase 2 family, polypeptide B17
|
|
chr6_-_27988152
|
0.491
|
NM_033057
|
OR2B2
|
olfactory receptor, family 2, subfamily B, member 2
|
|
chr8_-_108579270
|
0.484
|
NM_001146
|
ANGPT1
|
angiopoietin 1
|
|
chr17_-_64568641
|
0.482
|
NM_080283
|
ABCA9
|
ATP-binding cassette, sub-family A (ABC1), member 9
|
|
chr3_-_57209319
|
0.482
|
NM_003865
|
HESX1
|
HESX homeobox 1
|
|
chr2_-_208763017
|
0.480
|
NM_001099334
|
C2orf80
|
chromosome 2 open reading frame 80
|
|
chr5_+_152850276
|
0.479
|
NM_000827
NM_001114183
|
GRIA1
|
glutamate receptor, ionotropic, AMPA 1
|
|
chr2_+_161980865
|
0.475
|
NM_006593
|
TBR1
|
T-box, brain, 1
|
|
chr5_-_88235624
|
0.475
|
NM_001131005
NM_001193347
|
MEF2C
|
myocyte enhancer factor 2C
|
|
chr11_+_123600553
|
0.474
|
NM_001007249
|
OR8G2
|
olfactory receptor, family 8, subfamily G, member 2
|
|
chr5_-_27074407
|
0.473
|
NM_016279
|
CDH9
|
cadherin 9, type 2 (T1-cadherin)
|
|
chr21_-_30460841
|
0.472
|
NM_012131
|
CLDN17
|
claudin 17
|
|
chr2_+_220087135
|
0.472
|
NM_018674
NM_182847
|
ACCN4
|
amiloride-sensitive cation channel 4, pituitary
|
|
chr4_+_74825138
|
0.470
|
NM_000584
|
IL8
|
interleukin 8
|
|
chr1_-_246804680
|
0.470
|
NM_001001821
|
OR2T34
|
olfactory receptor, family 2, subfamily T, member 34
|
|
chr3_-_147696411
|
0.469
|
NM_020359
|
PLSCR2
|
phospholipid scramblase 2
|
|
chr22_-_15682555
|
0.467
|
NM_175878
|
XKR3
|
XK, Kell blood group complex subunit-related family, member 3
|
|
chr12_+_8557402
|
0.467
|
NM_080387
|
CLEC4D
|
C-type lectin domain family 4, member D
|
|
chr6_+_105511615
|
0.461
|
NM_001004317
|
LIN28B
|
lin-28 homolog B (C. elegans)
|
|
chrX_+_90977115
|
0.461
|
NM_001168360
NM_001168361
NM_001168362
NM_001168363
|
PCDH11X
|
protocadherin 11 X-linked
|
|
chr20_-_604822
|
0.460
|
NM_033129
|
SCRT2
|
scratch homolog 2, zinc finger protein (Drosophila)
|
|
chr13_-_69580459
|
0.459
|
NM_020866
|
KLHL1
|
kelch-like 1 (Drosophila)
|
|
chr21_-_38955487
|
0.457
|
NM_001136154
NM_004449
|
ERG
|
v-ets erythroblastosis virus E26 oncogene homolog (avian)
|
|
chr10_+_68355797
|
0.456
|
NM_178011
|
LRRTM3
|
leucine rich repeat transmembrane neuronal 3
|
|
chr12_+_56802
|
0.455
|
NM_015232
|
IQSEC3
|
IQ motif and Sec7 domain 3
|
|
chr22_+_21065134
|
0.455
|
|
LOC100290481
|
immunoglobulin lambda light chain-like
|
|
chr11_+_113280727
|
0.450
|
NM_006028
|
HTR3B
|
5-hydroxytryptamine (serotonin) receptor 3B
|
|
chr5_-_95774444
|
0.446
|
NM_001177876
|
PCSK1
|
proprotein convertase subtilisin/kexin type 1
|
|
chr16_-_20495126
|
0.445
|
NM_001105069
NM_182617
|
ACSM2B
|
acyl-CoA synthetase medium-chain family member 2B
|
|
chr4_+_88748704
|
0.442
|
NM_014208
|
DSPP
|
dentin sialophosphoprotein
|
|
chr13_-_34948758
|
0.441
|
NM_005584
|
MAB21L1
|
mab-21-like 1 (C. elegans)
|
|
chr19_+_15699833
|
0.440
|
NM_013939
|
OR10H2
|
olfactory receptor, family 10, subfamily H, member 2
|
|
chr6_+_29534109
|
0.440
|
NM_030883
|
OR2H1
|
olfactory receptor, family 2, subfamily H, member 1
|
|
chr3_-_36756355
|
0.439
|
NM_033403
|
DCLK3
|
doublecortin-like kinase 3
|
|
chr6_+_25862905
|
0.438
|
NM_005495
|
SLC17A4
|
solute carrier family 17 (sodium phosphate), member 4
|
|
chr20_+_186376
|
0.436
|
NM_207469
|
DEFB132
|
defensin, beta 132
|
|
chr2_-_99238001
|
0.435
|
NM_175735
|
LYG2
|
lysozyme G-like 2
|
|
chr4_+_96980261
|
0.434
|
NM_005390
|
PDHA2
|
pyruvate dehydrogenase (lipoamide) alpha 2
|
|
chr4_+_78651929
|
0.432
|
NM_006419
|
CXCL13
|
chemokine (C-X-C motif) ligand 13
|
|
chr2_+_185171337
|
0.431
|
NM_194250
|
ZNF804A
|
zinc finger protein 804A
|
|
chr17_-_30909219
|
0.430
|
NM_001129820
|
SLFN14
|
schlafen family member 14
|
|
chr6_+_112775224
|
0.429
|
NM_001013734
|
RFPL4B
|
ret finger protein-like 4B
|
|
chr1_-_120189301
|
0.429
|
NM_001047980
|
NBPF7
|
neuroblastoma breakpoint family, member 7
|
|
chr1_+_100776280
|
0.428
|
NM_022049
|
GPR88
|
G protein-coupled receptor 88
|
|
chr1_+_226712430
|
0.426
|
NM_175055
|
HIST3H2BB
|
histone cluster 3, H2bb
|
|
chr1_-_245763763
|
0.425
|
NM_198074
|
OR2C3
|
olfactory receptor, family 2, subfamily C, member 3
|
|
chr1_+_196153122
|
0.423
|
NM_020204
|
LHX9
|
LIM homeobox 9
|
|
chr6_-_133008834
|
0.423
|
NM_138327
|
TAAR1
|
trace amine associated receptor 1
|
|
chr2_+_185171480
|
0.421
|
|
ZNF804A
|
zinc finger protein 804A
|
|
chr19_+_53450743
|
0.420
|
|
|
|
|
chr10_-_6144119
|
0.416
|
NM_000417
|
IL2RA
|
interleukin 2 receptor, alpha
|
|
chr1_-_108588186
|
0.414
|
NM_001143989
|
NBPF4
NBPF6
|
neuroblastoma breakpoint family, member 4
neuroblastoma breakpoint family, member 6
|
|
chrX_+_37524250
|
0.414
|
|
CYBB
|
cytochrome b-245, beta polypeptide
|
|
chrX_-_133620103
|
0.412
|
NM_021796
|
PLAC1
|
placenta-specific 1
|
|
chr17_-_44006808
|
0.408
|
NM_002146
|
HOXB3
|
homeobox B3
|
|
chr1_-_191422346
|
0.406
|
NM_003783
|
B3GALT2
|
UDP-Gal:betaGlcNAc beta 1,3-galactosyltransferase, polypeptide 2
|
|
chr20_+_30019465
|
0.405
|
NM_001011718
|
XKR7
|
XK, Kell blood group complex subunit-related family, member 7
|
|
chr1_-_214663360
|
0.404
|
NM_007123
NM_206933
|
USH2A
|
Usher syndrome 2A (autosomal recessive, mild)
|
|
chr3_+_35697432
|
0.401
|
NM_198399
|
ARPP21
|
cAMP-regulated phosphoprotein, 21kDa
|
|
chrX_-_106033202
|
0.400
|
NM_001171706
NM_138382
|
RIPPLY1
|
ripply1 homolog (zebrafish)
|
|
chr2_+_225973845
|
0.398
|
NM_020864
|
KIAA1486
|
KIAA1486
|
|
chr4_+_71142893
|
0.396
|
NM_005212
|
CSN3
|
casein kappa
|
|
chr6_+_54281161
|
0.394
|
NM_014464
|
TINAG
|
tubulointerstitial nephritis antigen
|
|
chr4_-_44348414
|
0.394
|
NM_182592
|
YIPF7
|
Yip1 domain family, member 7
|
|
chr1_+_196874839
|
0.393
|
|
PTPRC
|
protein tyrosine phosphatase, receptor type, C
|
|
chr11_+_34599163
|
0.392
|
NM_012153
|
EHF
|
ets homologous factor
|
|
chr3_-_196792059
|
0.391
|
|
APOD
|
apolipoprotein D
|
|
chr1_+_115373937
|
0.386
|
NM_000549
|
TSHB
|
thyroid stimulating hormone, beta
|
|
chr12_+_52680143
|
0.385
|
NM_006897
|
HOXC9
|
homeobox C9
|
|
chr11_+_64114857
|
0.383
|
NM_144585
NM_153378
|
SLC22A12
|
solute carrier family 22 (organic anion/urate transporter), member 12
|
|
chr2_+_158666627
|
0.383
|
NM_173355
|
UPP2
|
uridine phosphorylase 2
|
|
chr2_-_200030412
|
0.382
|
|
SATB2
|
SATB homeobox 2
|
|
chr5_+_169713458
|
0.381
|
NM_001034838
|
KCNIP1
|
Kv channel interacting protein 1
|
|
chr1_+_196874759
|
0.376
|
NM_002838
NM_080921
NM_080923
|
PTPRC
|
protein tyrosine phosphatase, receptor type, C
|
|
chr4_-_176970407
|
0.375
|
|
GPM6A
|
glycoprotein M6A
|
|
chr6_-_2696152
|
0.375
|
NM_001012418
|
MYLK4
|
myosin light chain kinase family, member 4
|
|
chr1_-_224195495
|
0.373
|
NM_001172425
NM_003240
|
LEFTY2
|
left-right determination factor 2
|
|
chr12_-_10497195
|
0.371
|
NM_002259
NM_007328
|
KLRC1
|
killer cell lectin-like receptor subfamily C, member 1
|
|
chr18_-_13905534
|
0.371
|
NM_000529
|
MC2R
|
melanocortin 2 receptor (adrenocorticotropic hormone)
|
|
chr19_-_60941551
|
0.370
|
NM_176820
|
NLRP9
|
NLR family, pyrin domain containing 9
|
|
chr15_+_56217686
|
0.370
|
NM_020980
|
AQP9
|
aquaporin 9
|
|
chr17_-_70367479
|
0.369
|
NM_000835
|
GRIN2C
|
glutamate receptor, ionotropic, N-methyl D-aspartate 2C
|
|
chr15_-_48434340
|
0.369
|
|
FLJ10038
|
hypothetical protein FLJ10038
|
|
chr4_+_46728051
|
0.367
|
NM_000812
|
GABRB1
|
gamma-aminobutyric acid (GABA) A receptor, beta 1
|
|
chr1_+_108794426
|
0.364
|
NM_001143987
NM_001143988
|
NBPF4
NBPF6
|
neuroblastoma breakpoint family, member 4
neuroblastoma breakpoint family, member 6
|
|
chr6_+_154402135
|
0.363
|
NM_000914
NM_001008503
NM_001008504
NM_001008505
NM_001145282
NM_001145283
NM_001145285
NM_001145286
NM_001145284
|
OPRM1
|
opioid receptor, mu 1
|
|
chr7_-_83116414
|
0.360
|
NM_012431
|
SEMA3E
|
sema domain, immunoglobulin domain (Ig), short basic domain, secreted, (semaphorin) 3E
|
|
chr5_+_140583098
|
0.360
|
NM_018934
|
PCDHB14
|
protocadherin beta 14
|
|
chr3_+_46370228
|
0.357
|
NM_001123041
NM_001123396
|
CCR2
|
chemokine (C-C motif) receptor 2
|
|
chr6_-_2580296
|
0.357
|
NM_152554
|
C6orf195
|
chromosome 6 open reading frame 195
|
|
chrX_-_65176564
|
0.357
|
NM_001100431
NM_001184830
NM_001184831
NM_007268
|
VSIG4
|
V-set and immunoglobulin domain containing 4
|
|
chr11_-_89181390
|
0.355
|
NM_020358
|
TRIM49
|
tripartite motif containing 49
|
|
chr7_+_129693938
|
0.355
|
NM_001869
|
CPA2
|
carboxypeptidase A2 (pancreatic)
|
|
chrX_-_142551587
|
0.352
|
NM_001184749
|
SLITRK4
|
SLIT and NTRK-like family, member 4
|
|
chr20_+_58064360
|
0.352
|
NM_173644
|
C20orf197
|
chromosome 20 open reading frame 197
|
|
chr1_+_109057078
|
0.351
|
NM_001144937
|
FNDC7
|
fibronectin type III domain containing 7
|
|
chr6_+_55300225
|
0.351
|
NM_207410
|
GFRAL
|
GDNF family receptor alpha like
|
|
chr18_+_27152049
|
0.349
|
NM_001942
|
DSG1
|
desmoglein 1
|
|
chr2_-_113526910
|
0.349
|
NM_014438
NM_173178
|
IL1F8
|
interleukin 1 family, member 8 (eta)
|