|
chr17_-_37022465
|
1.542
|
NM_005557
|
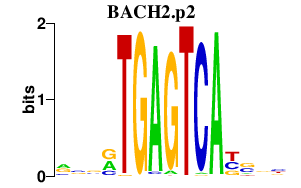
KRT16
|
keratin 16
|
|
chr11_-_117640196
|
1.450
|
|
MPZL2
|
myelin protein zero-like 2
|
|
chr11_+_384238
|
1.356
|
|
PKP3
|
plakophilin 3
|
|
chr11_+_384199
|
1.147
|
NM_007183
|
PKP3
|
plakophilin 3
|
|
chr11_-_117640407
|
1.073
|
NM_005797
NM_144765
|
MPZL2
|
myelin protein zero-like 2
|
|
chr3_-_48576204
|
1.016
|
NM_033199
|
UCN2
|
urocortin 2
|
|
chr17_-_36996611
|
0.982
|
NM_000526
|
KRT14
|
keratin 14
|
|
chr11_-_117640078
|
0.964
|
|
|
|
|
chr11_-_117640166
|
0.960
|
|
MPZL2
|
myelin protein zero-like 2
|
|
chr2_+_113591940
|
0.897
|
NM_000577
NM_173841
NM_173843
|
IL1RN
|
interleukin 1 receptor antagonist
|
|
chr19_-_48661563
|
0.876
|
NM_014400
|
LYPD3
|
LY6/PLAUR domain containing 3
|
|
chr9_-_106705780
|
0.820
|
|
ABCA1
|
ATP-binding cassette, sub-family A (ABC1), member 1
|
|
chr3_-_152517204
|
0.791
|
NM_023915
|
GPR87
|
G protein-coupled receptor 87
|
|
chr11_-_119499188
|
0.786
|
|
TRIM29
|
tripartite motif containing 29
|
|
chr11_+_12265022
|
0.778
|
NM_032867
|
MICALCL
|
MICAL C-terminal like
|
|
chr16_+_56219802
|
0.761
|
NM_001145771
NM_001145772
NM_001145773
NM_201524
NM_201525
|
GPR56
|
G protein-coupled receptor 56
|
|
chr16_+_55199978
|
0.741
|
NM_005953
|
MT2A
|
metallothionein 2A
|
|
chr12_+_54760153
|
0.717
|
NM_001005915
NM_001982
|
ERBB3
|
v-erb-b2 erythroblastic leukemia viral oncogene homolog 3 (avian)
|
|
chr19_+_7859380
|
0.690
|
NM_025061
|
LRRC8E
|
leucine rich repeat containing 8 family, member E
|
|
chr12_-_51629874
|
0.682
|
|
KRT8
|
keratin 8
|
|
chr3_-_48607596
|
0.674
|
NM_000094
|
COL7A1
|
collagen, type VII, alpha 1
|
|
chr8_-_144887876
|
0.667
|
NM_198488
|
FAM83H
|
family with sequence similarity 83, member H
|
|
chr17_+_71229151
|
0.665
|
|
ITGB4
|
integrin, beta 4
|
|
chr18_+_19706979
|
0.653
|
NM_000227
NM_001127718
|
LAMA3
|
laminin, alpha 3
|
|
chr17_+_71229110
|
0.651
|
NM_000213
NM_001005731
|
ITGB4
|
integrin, beta 4
|
|
chr8_+_120289735
|
0.624
|
NM_052886
|
MAL2
|
mal, T-cell differentiation protein 2 (gene/pseudogene)
|
|
chr3_-_188936941
|
0.618
|
NM_001130845
|
BCL6
|
B-cell CLL/lymphoma 6
|
|
chr1_+_221955876
|
0.604
|
NM_001146068
|
CAPN2
|
calpain 2, (m/II) large subunit
|
|
chr3_-_12775718
|
0.597
|
NM_018306
|
TMEM40
|
transmembrane protein 40
|
|
chr1_+_181421984
|
0.594
|
|
LAMC2
|
laminin, gamma 2
|
|
chr3_+_11153778
|
0.592
|
NM_001098213
|
HRH1
|
histamine receptor H1
|
|
chr20_-_1257782
|
0.581
|
|
SDCBP2
|
syndecan binding protein (syntenin) 2
|
|
chr6_+_32229278
|
0.571
|
NM_138717
|
PPT2
|
palmitoyl-protein thioesterase 2
|
|
chr6_+_31190505
|
0.543
|
NM_014068
|
PSORS1C1
|
psoriasis susceptibility 1 candidate 1
|
|
chr17_+_71229191
|
0.536
|
|
ITGB4
|
integrin, beta 4
|
|
chr19_-_56215084
|
0.535
|
NM_002776
NM_001077500
|
KLK10
|
kallikrein-related peptidase 10
|
|
chr1_-_156923111
|
0.528
|
NM_003126
|
SPTA1
|
spectrin, alpha, erythrocytic 1 (elliptocytosis 2)
|
|
chr7_+_116099648
|
0.525
|
NM_000245
NM_001127500
|
MET
|
met proto-oncogene (hepatocyte growth factor receptor)
|
|
chr1_+_3378030
|
0.522
|
|
ARHGEF16
|
Rho guanine nucleotide exchange factor (GEF) 16
|
|
chr2_+_47449790
|
0.521
|
NM_002354
|
EPCAM
|
epithelial cell adhesion molecule
|
|
chr12_-_56445653
|
0.514
|
|
CYP27B1
|
cytochrome P450, family 27, subfamily B, polypeptide 1
|
|
chr2_+_47449951
|
0.503
|
|
EPCAM
|
epithelial cell adhesion molecule
|
|
chr9_-_129381086
|
0.503
|
NM_001035534
|
FAM129B
|
family with sequence similarity 129, member B
|
|
chr7_-_1465487
|
0.493
|
|
MICALL2
|
MICAL-like 2
|
|
chr12_+_54760211
|
0.489
|
|
ERBB3
|
v-erb-b2 erythroblastic leukemia viral oncogene homolog 3 (avian)
|
|
chr3_-_197549640
|
0.484
|
NM_138461
|
TM4SF19
|
transmembrane 4 L six family member 19
|
|
chr19_+_55398680
|
0.471
|
NM_001077186
NM_001145809
NM_024729
|
MYH14
|
myosin, heavy chain 14, non-muscle
|
|
chr1_-_207891264
|
0.464
|
NM_001017402
|
LAMB3
|
laminin, beta 3
|
|
chr7_-_96177010
|
0.452
|
|
SHFM1
|
split hand/foot malformation (ectrodactyly) type 1
|
|
chr15_+_57691272
|
0.443
|
NM_004751
|
GCNT3
|
glucosaminyl (N-acetyl) transferase 3, mucin type
|
|
chr1_+_891739
|
0.436
|
NM_001160184
NM_032129
|
PLEKHN1
|
pleckstrin homology domain containing, family N member 1
|
|
chr7_-_107430566
|
0.428
|
NM_002291
|
LAMB1
|
laminin, beta 1
|
|
chr9_+_131291224
|
0.426
|
|
LOC100506190
|
hypothetical LOC100506190
|
|
chr19_-_43955984
|
0.424
|
NM_002307
|
LGALS7
LGALS7B
|
lectin, galactoside-binding, soluble, 7
lectin, galactoside-binding, soluble, 7B
|
|
chrX_+_30143595
|
0.415
|
NM_002364
|
MAGEB2
|
melanoma antigen family B, 2
|
|
chr1_-_151788341
|
0.414
|
NM_002960
|
S100A3
|
S100 calcium binding protein A3
|
|
chrX_+_133198742
|
0.413
|
NM_001101357
|
CCDC160
|
coiled-coil domain containing 160
|
|
chr2_-_73170290
|
0.409
|
|
RAB11FIP5
|
RAB11 family interacting protein 5 (class I)
|
|
chr18_+_59295123
|
0.404
|
NM_002639
|
SERPINB5
|
serpin peptidase inhibitor, clade B (ovalbumin), member 5
|
|
chr8_-_27528215
|
0.398
|
NM_001831
|
CLU
|
clusterin
|
|
chr20_+_42463387
|
0.397
|
|
HNF4A
|
hepatocyte nuclear factor 4, alpha
|
|
chr13_+_96592051
|
0.395
|
|
MBNL2
|
muscleblind-like 2 (Drosophila)
|
|
chr16_+_88515917
|
0.387
|
NM_001197181
|
TUBB3
|
tubulin, beta 3
|
|
chr1_+_181422016
|
0.377
|
|
LAMC2
|
laminin, gamma 2
|
|
chr2_+_87536106
|
0.377
|
|
NCRNA00152
|
non-protein coding RNA 152
|
|
chr5_+_145297490
|
0.371
|
|
SH3RF2
|
SH3 domain containing ring finger 2
|
|
chr1_+_15128882
|
0.367
|
NM_001018001
|
KAZN
|
kazrin, periplakin interacting protein
|
|
chr1_-_6474346
|
0.356
|
NM_020631
|
PLEKHG5
|
pleckstrin homology domain containing, family G (with RhoGef domain) member 5
|
|
chr19_-_40696393
|
0.355
|
NM_001126056
NM_001126057
NM_001126058
NM_001190347
NM_001190348
NM_001190349
NM_033317
|
DMKN
|
dermokine
|
|
chr19_+_43486640
|
0.352
|
NM_033520
|
C19orf33
|
chromosome 19 open reading frame 33
|
|
chr7_+_30927439
|
0.348
|
NM_001185060
NM_001185061
NM_001185062
|
AQP1
|
aquaporin 1 (Colton blood group)
|
|
chr22_+_21340757
|
0.346
|
|
|
|
|
chr4_+_74825138
|
0.345
|
NM_000584
|
IL8
|
interleukin 8
|
|
chr15_+_57691382
|
0.343
|
|
GCNT3
|
glucosaminyl (N-acetyl) transferase 3, mucin type
|
|
chr21_-_35343065
|
0.340
|
|
RUNX1
|
runt-related transcription factor 1
|
|
chr9_-_34652629
|
0.339
|
NM_006664
|
CCL27
|
chemokine (C-C motif) ligand 27
|
|
chr6_+_41712907
|
0.333
|
|
MDFI
|
MyoD family inhibitor
|
|
chr7_-_7724762
|
0.333
|
NM_002947
|
RPA3
|
replication protein A3, 14kDa
|
|
chr6_-_31812251
|
0.332
|
|
CLIC1
|
chloride intracellular channel 1
|
|
chr1_-_6585485
|
0.331
|
NM_014851
|
KLHL21
|
kelch-like 21 (Drosophila)
|
|
chr19_-_40673185
|
0.330
|
NM_207392
|
KRTDAP
|
keratinocyte differentiation-associated protein
|
|
chr4_-_191143017
|
0.328
|
NM_020040
|
TUBB4Q
|
tubulin, beta polypeptide 4, member Q
|
|
chr3_+_185386664
|
0.327
|
|
ABCF3
|
ATP-binding cassette, sub-family F (GCN20), member 3
|
|
chr6_-_31812266
|
0.327
|
|
CLIC1
|
chloride intracellular channel 1
|
|
chr2_+_87536174
|
0.324
|
|
NCRNA00152
|
non-protein coding RNA 152
|
|
chr6_-_31812283
|
0.320
|
|
CLIC1
|
chloride intracellular channel 1
|
|
chr6_-_31812072
|
0.317
|
|
CLIC1
|
chloride intracellular channel 1
|
|
chr12_-_49689255
|
0.317
|
|
SLC11A2
|
solute carrier family 11 (proton-coupled divalent metal ion transporters), member 2
|
|
chr1_+_181421796
|
0.314
|
NM_005562
NM_018891
|
LAMC2
|
laminin, gamma 2
|
|
chr16_-_28515195
|
0.312
|
NM_177528
|
SULT1A2
|
sulfotransferase family, cytosolic, 1A, phenol-preferring, member 2
|
|
chr9_+_131291144
|
0.312
|
|
|
|
|
chr4_-_658035
|
0.312
|
NM_007100
|
ATP5I
|
ATP synthase, H+ transporting, mitochondrial Fo complex, subunit E
|
|
chr1_+_148747208
|
0.312
|
|
ECM1
|
extracellular matrix protein 1
|
|
chr1_-_108032645
|
0.310
|
NM_001079874
|
VAV3
|
vav 3 guanine nucleotide exchange factor
|
|
chr18_+_54039818
|
0.307
|
|
NEDD4L
|
neural precursor cell expressed, developmentally down-regulated 4-like
|
|
chr1_-_244647333
|
0.306
|
NM_022743
|
SMYD3
|
SET and MYND domain containing 3
|
|
chr11_-_47164001
|
0.305
|
NM_001184975
|
PACSIN3
|
protein kinase C and casein kinase substrate in neurons 3
|
|
chr4_+_152549776
|
0.305
|
NM_001109977
|
FAM160A1
|
family with sequence similarity 160, member A1
|
|
chr6_+_32021687
|
0.303
|
NM_001710
|
CFB
|
complement factor B
|
|
chr3_+_185386556
|
0.303
|
NM_018358
|
ABCF3
|
ATP-binding cassette, sub-family F (GCN20), member 3
|
|
chr6_-_31812049
|
0.300
|
|
CLIC1
|
chloride intracellular channel 1
|
|
chr6_-_134538526
|
0.297
|
|
SGK1
|
serum/glucocorticoid regulated kinase 1
|
|
chr6_-_31812214
|
0.297
|
|
CLIC1
|
chloride intracellular channel 1
|
|
chr20_-_51633042
|
0.296
|
NM_006526
|
ZNF217
|
zinc finger protein 217
|
|
chr20_-_1257809
|
0.296
|
NM_080489
|
SDCBP2
|
syndecan binding protein (syntenin) 2
|
|
chr8_-_17797127
|
0.294
|
NM_147203
NM_201553
NM_004467
NM_201552
|
FGL1
|
fibrinogen-like 1
|
|
chr7_-_150352484
|
0.294
|
NM_173681
|
ATG9B
|
ATG9 autophagy related 9 homolog B (S. cerevisiae)
|
|
chr4_-_89299034
|
0.292
|
NM_004827
|
ABCG2
|
ATP-binding cassette, sub-family G (WHITE), member 2
|
|
chr21_-_35343331
|
0.291
|
|
RUNX1
|
runt-related transcription factor 1
|
|
chr12_+_50631704
|
0.291
|
NM_004302
NM_020328
|
ACVR1B
|
activin A receptor, type IB
|
|
chr21_-_35343448
|
0.290
|
|
RUNX1
|
runt-related transcription factor 1
|
|
chr17_+_7063873
|
0.288
|
NM_000018
NM_001033859
|
ACADVL
|
acyl-CoA dehydrogenase, very long chain
|
|
chr11_-_102219450
|
0.288
|
NM_002422
|
MMP3
|
matrix metallopeptidase 3 (stromelysin 1, progelatinase)
|
|
chr13_+_112746908
|
0.287
|
|
MCF2L
|
MCF.2 cell line derived transforming sequence-like
|
|
chr19_-_411995
|
0.287
|
NM_012435
|
SHC2
|
SHC (Src homology 2 domain containing) transforming protein 2
|
|
chr16_-_2848106
|
0.283
|
NM_022119
|
PRSS22
|
protease, serine, 22
|
|
chr1_+_151270301
|
0.282
|
NM_003125
|
SPRR1B
|
small proline-rich protein 1B
|
|
chr9_+_102231616
|
0.277
|
NM_001198806
|
C9orf30
|
chromosome 9 open reading frame 30
|
|
chr17_+_69941430
|
0.276
|
NM_018653
|
GPRC5C
|
G protein-coupled receptor, family C, group 5, member C
|
|
chr6_-_31853027
|
0.276
|
NM_025258
|
C6orf27
|
chromosome 6 open reading frame 27
|
|
chr6_+_47774247
|
0.274
|
NM_153838
|
GPR115
|
G protein-coupled receptor 115
|
|
chr10_+_121401076
|
0.272
|
|
BAG3
|
BCL2-associated athanogene 3
|
|
chr2_-_65447267
|
0.272
|
|
SPRED2
|
sprouty-related, EVH1 domain containing 2
|
|
chr10_+_85889164
|
0.271
|
NM_014394
|
GHITM
|
growth hormone inducible transmembrane protein
|
|
chr12_-_7935010
|
0.270
|
|
SLC2A14
|
solute carrier family 2 (facilitated glucose transporter), member 14
|
|
chr8_-_27528105
|
0.270
|
|
CLU
|
clusterin
|
|
chr20_+_43468617
|
0.270
|
NM_001048223
NM_001048224
|
DBNDD2
|
dysbindin (dystrobrevin binding protein 1) domain containing 2
|
|
chr1_-_202387532
|
0.269
|
|
ETNK2
|
ethanolamine kinase 2
|
|
chr6_+_30983941
|
0.266
|
NM_001517
|
GTF2H4
|
general transcription factor IIH, polypeptide 4, 52kDa
|
|
chr22_+_21053972
|
0.263
|
|
|
|
|
chr17_-_36165050
|
0.262
|
NM_181534
|
KRT25
|
keratin 25
|
|
chr3_-_197549588
|
0.261
|
|
TM4SF19
|
transmembrane 4 L six family member 19
|
|
chr10_+_121400926
|
0.261
|
|
BAG3
|
BCL2-associated athanogene 3
|
|
chr18_+_258147
|
0.260
|
|
|
|
|
chr12_+_50631734
|
0.257
|
|
ACVR1B
|
activin A receptor, type IB
|
|
chr3_+_57069508
|
0.254
|
NM_181727
|
SPATA12
|
spermatogenesis associated 12
|
|
chr1_-_6585268
|
0.254
|
|
KLHL21
|
kelch-like 21 (Drosophila)
|
|
chr3_-_195571748
|
0.254
|
NM_001135057
NM_130830
|
LRRC15
|
leucine rich repeat containing 15
|
|
chr6_-_31812260
|
0.252
|
|
CLIC1
|
chloride intracellular channel 1
|
|
chr18_+_59593591
|
0.251
|
NM_003784
|
SERPINB7
|
serpin peptidase inhibitor, clade B (ovalbumin), member 7
|
|
chr17_+_71892538
|
0.251
|
|
SPHK1
|
sphingosine kinase 1
|
|
chr11_-_65860450
|
0.250
|
NM_004292
|
RIN1
|
Ras and Rab interactor 1
|
|
chr7_-_158304062
|
0.248
|
|
ESYT2
|
extended synaptotagmin-like protein 2
|
|
chr17_-_53335748
|
0.247
|
NM_017949
|
CUEDC1
|
CUE domain containing 1
|
|
chr12_-_46438447
|
0.246
|
NM_001098532
NM_006105
|
RAPGEF3
|
Rap guanine nucleotide exchange factor (GEF) 3
|
|
chr6_+_32021742
|
0.245
|
|
CFB
|
complement factor B
|
|
chr16_+_29984647
|
0.245
|
|
ALDOA
|
aldolase A, fructose-bisphosphate
|
|
chr11_-_65424434
|
0.244
|
|
FOSL1
|
FOS-like antigen 1
|
|
chr18_+_54039779
|
0.241
|
|
NEDD4L
|
neural precursor cell expressed, developmentally down-regulated 4-like
|
|
chr6_-_84197463
|
0.241
|
|
ME1
|
malic enzyme 1, NADP(+)-dependent, cytosolic
|
|
chr9_-_106705867
|
0.240
|
|
ABCA1
|
ATP-binding cassette, sub-family A (ABC1), member 1
|
|
chr2_-_65447370
|
0.240
|
NM_001128210
|
SPRED2
|
sprouty-related, EVH1 domain containing 2
|
|
chr10_+_121400881
|
0.240
|
|
BAG3
|
BCL2-associated athanogene 3
|
|
chr7_+_150319076
|
0.237
|
NM_000603
|
NOS3
|
nitric oxide synthase 3 (endothelial cell)
|
|
chr18_+_54039730
|
0.237
|
NM_001144966
|
NEDD4L
|
neural precursor cell expressed, developmentally down-regulated 4-like
|
|
chr6_-_35996794
|
0.236
|
|
SRPK1
|
SRSF protein kinase 1
|
|
chr22_+_21393107
|
0.236
|
|
IGLJ3
|
immunoglobulin lambda joining 3
|
|
chr7_+_99485352
|
0.235
|
NM_145914
|
ZSCAN21
|
zinc finger and SCAN domain containing 21
|
|
chr11_-_102250876
|
0.233
|
NM_002426
|
MMP12
|
matrix metallopeptidase 12 (macrophage elastase)
|
|
chr3_+_189413414
|
0.233
|
NM_005578
|
LPP
|
LIM domain containing preferred translocation partner in lipoma
|
|
chr7_-_38355949
|
0.231
|
|
|
|
|
chr10_-_95350949
|
0.230
|
NM_006744
|
RBP4
|
retinol binding protein 4, plasma
|
|
chr22_+_19191884
|
0.229
|
NM_001003891
NM_015889
|
MED15
|
mediator complex subunit 15
|
|
chr12_-_38123027
|
0.228
|
NM_001173463
NM_001173464
NM_001173465
NM_017641
|
KIF21A
|
kinesin family member 21A
|
|
chr17_+_71893014
|
0.227
|
|
SPHK1
|
sphingosine kinase 1
|
|
chr19_+_54068300
|
0.225
|
|
PPP1R15A
|
protein phosphatase 1, regulatory (inhibitor) subunit 15A
|
|
chr10_+_121400741
|
0.223
|
NM_004281
|
BAG3
|
BCL2-associated athanogene 3
|
|
chr19_+_61039755
|
0.222
|
NM_134444
|
NLRP4
|
NLR family, pyrin domain containing 4
|
|
chr1_+_221966684
|
0.222
|
NM_001748
|
CAPN2
|
calpain 2, (m/II) large subunit
|
|
chr14_-_93924663
|
0.222
|
|
SERPINA1
|
serpin peptidase inhibitor, clade A (alpha-1 antiproteinase, antitrypsin), member 1
|
|
chr12_+_121180439
|
0.222
|
|
MLXIP
|
MLX interacting protein
|
|
chr22_+_19699441
|
0.221
|
NM_001159554
NM_005446
|
P2RX6
|
purinergic receptor P2X, ligand-gated ion channel, 6
|
|
chr20_+_41621119
|
0.220
|
|
SGK2
|
serum/glucocorticoid regulated kinase 2
|
|
chr8_-_59734801
|
0.219
|
|
NSMAF
|
neutral sphingomyelinase (N-SMase) activation associated factor
|
|
chr6_+_43705254
|
0.217
|
NM_001003690
|
MAD2L1BP
|
MAD2L1 binding protein
|
|
chr6_-_138470160
|
0.215
|
NM_022121
|
PERP
|
PERP, TP53 apoptosis effector
|
|
chr1_+_221966835
|
0.213
|
|
CAPN2
|
calpain 2, (m/II) large subunit
|
|
chr9_-_124030770
|
0.211
|
NM_014368
NM_199160
|
LHX6
|
LIM homeobox 6
|
|
chr9_-_90983195
|
0.210
|
|
SHC3
|
SHC (Src homology 2 domain containing) transforming protein 3
|
|
chr21_-_35343500
|
0.209
|
|
RUNX1
|
runt-related transcription factor 1
|
|
chr20_+_4614796
|
0.209
|
NM_000311
NM_001080121
NM_001080122
NM_183079
NM_001080123
|
PRNP
|
prion protein
|
|
chr20_+_42463279
|
0.208
|
NM_000457
NM_178849
NM_178850
|
HNF4A
|
hepatocyte nuclear factor 4, alpha
|
|
chr7_+_48094750
|
0.207
|
NM_181597
|
UPP1
|
uridine phosphorylase 1
|
|
chr19_+_43971689
|
0.207
|
NM_001042507
|
LGALS7B
|
lectin, galactoside-binding, soluble, 7B
|
|
chr14_-_24173205
|
0.207
|
NM_004131
|
GZMB
|
granzyme B (granzyme 2, cytotoxic T-lymphocyte-associated serine esterase 1)
|
|
chr16_-_46823682
|
0.206
|
NM_033151
|
ABCC11
|
ATP-binding cassette, sub-family C (CFTR/MRP), member 11
|
|
chr6_-_31812297
|
0.205
|
NM_001288
|
CLIC1
|
chloride intracellular channel 1
|
|
chr17_+_72827227
|
0.203
|
|
SEPT9
|
septin 9
|
|
chr10_+_24795465
|
0.203
|
|
KIAA1217
|
KIAA1217
|
|
chr14_-_60260211
|
0.203
|
NM_017420
|
SIX4
|
SIX homeobox 4
|
|
chr10_-_85154
|
0.199
|
NM_177987
|
TUBB8
|
tubulin, beta 8
|
|
chr1_+_27591738
|
0.199
|
NM_005281
|
GPR3
|
G protein-coupled receptor 3
|
|
chr10_+_24795446
|
0.197
|
|
KIAA1217
|
KIAA1217
|
|
chr14_-_20642214
|
0.195
|
|
|
|
|
chr1_-_115682374
|
0.194
|
NM_002506
|
NGF
|
nerve growth factor (beta polypeptide)
|
|
chr8_-_59734474
|
0.193
|
NM_001144772
|
NSMAF
|
neutral sphingomyelinase (N-SMase) activation associated factor
|
|
chr2_+_36777336
|
0.193
|
NM_001177969
NM_001177970
NM_001177971
NM_001177972
NM_053276
|
VIT
|
vitrin
|
|
chr17_+_71892781
|
0.192
|
NM_001142602
|
SPHK1
|
sphingosine kinase 1
|
|
chrX_+_41078787
|
0.191
|
|
DDX3X
|
DEAD (Asp-Glu-Ala-Asp) box polypeptide 3, X-linked
|
|
chr7_+_128219307
|
0.191
|
NM_022742
|
CCDC136
|
coiled-coil domain containing 136
|