|
chr19_+_57492236
|
3.069
|
NM_144684
|
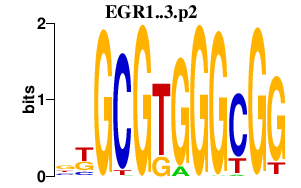
ZNF480
|
zinc finger protein 480
|
|
chr4_-_25473528
|
1.777
|
NM_015187
|
SEL1L3
|
sel-1 suppressor of lin-12-like 3 (C. elegans)
|
|
chr2_+_42128521
|
1.452
|
NM_138370
|
PKDCC
|
protein kinase domain containing, cytoplasmic homolog (mouse)
|
|
chr13_+_19430906
|
1.429
|
NM_001190965
|
ZMYM2
|
zinc finger, MYM-type 2
|
|
chr21_+_16024241
|
1.345
|
NM_013396
|
USP25
|
ubiquitin specific peptidase 25
|
|
chr7_-_81910956
|
1.327
|
NM_000722
|
CACNA2D1
|
calcium channel, voltage-dependent, alpha 2/delta subunit 1
|
|
chr7_-_81910740
|
1.322
|
|
CACNA2D1
|
calcium channel, voltage-dependent, alpha 2/delta subunit 1
|
|
chr3_-_15875932
|
1.291
|
NM_015199
|
ANKRD28
|
ankyrin repeat domain 28
|
|
chr6_-_74420330
|
1.253
|
|
SLC17A5
|
solute carrier family 17 (anion/sugar transporter), member 5
|
|
chr12_+_129388543
|
1.246
|
|
PIWIL1
|
piwi-like 1 (Drosophila)
|
|
chr8_+_72918889
|
1.224
|
|
|
|
|
chr3_+_171558143
|
1.162
|
NM_001145098
NM_005414
|
SKIL
|
SKI-like oncogene
|
|
chr5_-_81082699
|
1.108
|
NM_012446
|
SSBP2
|
single-stranded DNA binding protein 2
|
|
chr13_+_19430881
|
1.091
|
|
ZMYM2
|
zinc finger, MYM-type 2
|
|
chr13_+_19430788
|
1.085
|
NM_003453
NM_197968
NM_001190964
|
ZMYM2
|
zinc finger, MYM-type 2
|
|
chr8_+_72918772
|
1.043
|
|
LOC100132891
|
hypothetical LOC100132891
|
|
chr7_-_107883929
|
1.025
|
NM_001193582
NM_001193583
NM_001193584
NM_005010
|
NRCAM
|
neuronal cell adhesion molecule
|
|
chr7_+_64975596
|
1.012
|
NM_173517
|
VKORC1L1
|
vitamin K epoxide reductase complex, subunit 1-like 1
|
|
chr10_+_11099860
|
0.993
|
NM_006561
|
CELF2
|
CUGBP, Elav-like family member 2
|
|
chr9_-_85622366
|
0.981
|
NM_001135953
NM_025211
|
GKAP1
|
G kinase anchoring protein 1
|
|
chr5_+_89806436
|
0.979
|
NM_006467
|
POLR3G
|
polymerase (RNA) III (DNA directed) polypeptide G (32kD)
|
|
chr7_+_128257698
|
0.979
|
NM_001127487
NM_001458
|
FLNC
|
filamin C, gamma
|
|
chr22_+_18081968
|
0.961
|
NM_002688
|
SEPT5
|
septin 5
|
|
chr1_+_234372454
|
0.955
|
NM_003272
|
GPR137B
|
G protein-coupled receptor 137B
|
|
chr10_-_74925753
|
0.947
|
NM_001142353
NM_001142354
NM_021132
|
PPP3CB
|
protein phosphatase 3, catalytic subunit, beta isozyme
|
|
chr22_+_38183262
|
0.938
|
NM_002409
|
MGAT3
|
mannosyl (beta-1,4-)-glycoprotein beta-1,4-N-acetylglucosaminyltransferase
|
|
chr6_+_135544170
|
0.932
|
|
MYB
|
v-myb myeloblastosis viral oncogene homolog (avian)
|
|
chr5_-_114660139
|
0.930
|
NM_001040440
|
CCDC112
|
coiled-coil domain containing 112
|
|
chr1_+_35507145
|
0.928
|
NM_005095
|
ZMYM4
|
zinc finger, MYM-type 4
|
|
chr1_-_32574185
|
0.919
|
NM_023009
|
MARCKSL1
|
MARCKS-like 1
|
|
chr10_+_11100075
|
0.917
|
|
CELF2
|
CUGBP, Elav-like family member 2
|
|
chr12_-_95317928
|
0.903
|
|
CDK17
|
cyclin-dependent kinase 17
|
|
chr5_-_137116746
|
0.897
|
|
HNRNPA0
|
heterogeneous nuclear ribonucleoprotein A0
|
|
chr21_-_39642808
|
0.895
|
|
HMGN1
|
high-mobility group nucleosome binding domain 1
|
|
chr16_-_19803606
|
0.882
|
NM_016235
|
GPRC5B
|
G protein-coupled receptor, family C, group 5, member B
|
|
chr6_-_85530617
|
0.880
|
NM_001080508
|
TBX18
|
T-box 18
|
|
chr3_+_171558188
|
0.870
|
|
SKIL
|
SKI-like oncogene
|
|
chr3_+_171558215
|
0.861
|
|
SKIL
|
SKI-like oncogene
|
|
chr2_-_210744158
|
0.858
|
NM_152519
|
C2orf67
|
chromosome 2 open reading frame 67
|
|
chr18_+_12937972
|
0.856
|
NM_001013437
NM_031216
|
SEH1L
|
SEH1-like (S. cerevisiae)
|
|
chr6_+_133604181
|
0.855
|
NM_004100
NM_172103
NM_172105
|
EYA4
|
eyes absent homolog 4 (Drosophila)
|
|
chr10_+_93160066
|
0.853
|
NM_173497
NM_182765
|
HECTD2
|
HECT domain containing 2
|
|
chr10_-_74925653
|
0.850
|
|
PPP3CB
|
protein phosphatase 3, catalytic subunit, beta isozyme
|
|
chr1_+_224317044
|
0.821
|
|
H3F3A
LOC440926
|
H3 histone, family 3A
H3 histone, family 3A pseudogene
|
|
chr3_-_184180985
|
0.804
|
NM_020640
|
DCUN1D1
|
DCN1, defective in cullin neddylation 1, domain containing 1 (S. cerevisiae)
|
|
chr1_+_78126787
|
0.802
|
NM_001172309
NM_144573
|
NEXN
|
nexilin (F actin binding protein)
|
|
chr2_+_191222077
|
0.801
|
NM_005966
|
NAB1
|
NGFI-A binding protein 1 (EGR1 binding protein 1)
|
|
chr10_-_74925724
|
0.800
|
|
PPP3CB
|
protein phosphatase 3, catalytic subunit, beta isozyme
|
|
chr17_-_44010543
|
0.787
|
NM_024015
|
HOXB4
|
homeobox B4
|
|
chr6_+_18263514
|
0.779
|
NM_153042
|
KDM1B
|
lysine (K)-specific demethylase 1B
|
|
chr10_-_33286792
|
0.776
|
NM_133376
|
ITGB1
|
integrin, beta 1 (fibronectin receptor, beta polypeptide, antigen CD29 includes MDF2, MSK12)
|
|
chr21_+_16024157
|
0.775
|
|
USP25
|
ubiquitin specific peptidase 25
|
|
chr19_-_54314090
|
0.773
|
NM_018111
|
C19orf73
|
chromosome 19 open reading frame 73
|
|
chr6_+_111911226
|
0.772
|
|
LOC643749
|
hypothetical LOC643749
|
|
chr1_+_65763978
|
0.769
|
|
LEPR
|
leptin receptor
|
|
chr17_+_63252668
|
0.766
|
|
BPTF
|
bromodomain PHD finger transcription factor
|
|
chr3_-_172660545
|
0.761
|
NM_001161560
NM_001161561
NM_001161562
NM_001161563
NM_001161564
NM_001161565
NM_001161566
NM_015028
|
TNIK
|
TRAF2 and NCK interacting kinase
|
|
chr1_+_65763945
|
0.752
|
NM_001198687
NM_001198688
NM_001198689
|
LEPR
|
leptin receptor
|
|
chr1_+_177261627
|
0.751
|
|
FAM20B
|
family with sequence similarity 20, member B
|
|
chr2_-_144991386
|
0.750
|
|
ZEB2
|
zinc finger E-box binding homeobox 2
|
|
chr6_+_135544138
|
0.744
|
NM_001130172
NM_001130173
NM_001161656
NM_001161657
NM_001161658
NM_001161659
NM_001161660
NM_005375
|
MYB
|
v-myb myeloblastosis viral oncogene homolog (avian)
|
|
chr5_-_88215034
|
0.738
|
NM_001193350
NM_002397
|
MEF2C
|
myocyte enhancer factor 2C
|
|
chr10_+_89613399
|
0.729
|
|
PTEN
|
phosphatase and tensin homolog
|
|
chr11_+_46359878
|
0.721
|
NM_001012333
|
MDK
|
midkine (neurite growth-promoting factor 2)
|
|
chr17_+_63252704
|
0.720
|
|
BPTF
|
bromodomain PHD finger transcription factor
|
|
chr5_+_176493233
|
0.718
|
NM_022455
|
NSD1
|
nuclear receptor binding SET domain protein 1
|
|
chr9_-_15500209
|
0.708
|
NM_021144
|
PSIP1
|
PC4 and SFRS1 interacting protein 1
|
|
chr9_-_100510657
|
0.706
|
NM_005458
|
GABBR2
|
gamma-aminobutyric acid (GABA) B receptor, 2
|
|
chr7_-_140270749
|
0.701
|
NM_004333
|
BRAF
|
v-raf murine sarcoma viral oncogene homolog B1
|
|
chr10_+_94598204
|
0.700
|
NM_019053
|
EXOC6
|
exocyst complex component 6
|
|
chr12_+_19484044
|
0.699
|
|
AEBP2
|
AE binding protein 2
|
|
chr1_+_39229474
|
0.698
|
NM_001136275
NM_024595
|
AKIRIN1
|
akirin 1
|
|
chr5_+_176493488
|
0.697
|
|
NSD1
|
nuclear receptor binding SET domain protein 1
|
|
chr7_-_27206249
|
0.694
|
NM_000522
|
HOXA13
|
homeobox A13
|
|
chr6_+_133604203
|
0.692
|
|
EYA4
|
eyes absent homolog 4 (Drosophila)
|
|
chr2_+_181553333
|
0.685
|
NM_182678
NM_006357
|
UBE2E3
|
ubiquitin-conjugating enzyme E2E 3 (UBC4/5 homolog, yeast)
|
|
chr3_-_88190737
|
0.682
|
NM_001008390
NM_003663
|
CGGBP1
|
CGG triplet repeat binding protein 1
|
|
chr5_+_76542461
|
0.679
|
NM_001029851
NM_001029852
NM_001029853
NM_001029854
NM_003719
|
PDE8B
|
phosphodiesterase 8B
|
|
chr2_-_174537021
|
0.678
|
NM_001017371
|
SP3
|
Sp3 transcription factor
|
|
chr13_+_77170470
|
0.676
|
NM_001040153
|
SLAIN1
|
SLAIN motif family, member 1
|
|
chr12_-_122415327
|
0.676
|
|
SBNO1
|
strawberry notch homolog 1 (Drosophila)
|
|
chr10_+_49184658
|
0.662
|
|
MAPK8
|
mitogen-activated protein kinase 8
|
|
chrX_-_153952447
|
0.660
|
NM_001018024
NM_001018025
|
MTCP1NB
MTCP1
|
mature T-cell proliferation 1 neighbor
mature T-cell proliferation 1
|
|
chr17_+_63252087
|
0.655
|
NM_004459
NM_182641
|
BPTF
|
bromodomain PHD finger transcription factor
|
|
chr9_+_130491668
|
0.654
|
|
SET
|
SET nuclear oncogene
|
|
chr8_+_57286875
|
0.652
|
|
CHCHD7
|
coiled-coil-helix-coiled-coil-helix domain containing 7
|
|
chr5_-_81082614
|
0.648
|
|
SSBP2
|
single-stranded DNA binding protein 2
|
|
chr2_+_56264627
|
0.645
|
NM_001080433
|
CCDC85A
|
coiled-coil domain containing 85A
|
|
chr16_+_65620536
|
0.640
|
NM_001755
NM_022845
|
CBFB
|
core-binding factor, beta subunit
|
|
chr22_+_42751487
|
0.640
|
NM_013327
|
PARVB
|
parvin, beta
|
|
chr2_+_198377561
|
0.639
|
NM_006226
|
PLCL1
|
phospholipase C-like 1
|
|
chr19_+_60487578
|
0.636
|
|
BRSK1
|
BR serine/threonine kinase 1
|
|
chr6_+_143423723
|
0.635
|
|
AIG1
|
androgen-induced 1
|
|
chr21_-_39642935
|
0.634
|
|
HMGN1
|
high-mobility group nucleosome binding domain 1
|
|
chr6_-_46566969
|
0.632
|
|
RCAN2
|
regulator of calcineurin 2
|
|
chr5_+_86599800
|
0.627
|
|
RASA1
|
RAS p21 protein activator (GTPase activating protein) 1
|
|
chr21_+_46473494
|
0.627
|
|
MCM3AP-AS1
|
MCM3AP antisense RNA 1 (non-protein coding)
|
|
chr8_+_16929116
|
0.623
|
NM_181723
|
EFHA2
|
EF-hand domain family, member A2
|
|
chr2_-_219141199
|
0.620
|
NM_020935
|
USP37
|
ubiquitin specific peptidase 37
|
|
chr20_-_30636535
|
0.614
|
|
LOC284804
|
hypothetical protein LOC284804
|
|
chr12_+_102982365
|
0.612
|
NM_013320
|
HCFC2
|
host cell factor C2
|
|
chr10_+_89613071
|
0.610
|
NM_000314
|
PTEN
|
phosphatase and tensin homolog
|
|
chr16_+_51722285
|
0.607
|
|
CHD9
|
chromodomain helicase DNA binding protein 9
|
|
chr12_+_19484387
|
0.604
|
|
AEBP2
|
AE binding protein 2
|
|
chr6_+_76368337
|
0.604
|
NM_001100409
NM_015571
|
SENP6
|
SUMO1/sentrin specific peptidase 6
|
|
chr3_+_20056857
|
0.603
|
|
KAT2B
|
K(lysine) acetyltransferase 2B
|
|
chr7_+_119700924
|
0.602
|
NM_012281
|
KCND2
|
potassium voltage-gated channel, Shal-related subfamily, member 2
|
|
chr8_+_17058377
|
0.600
|
|
ZDHHC2
|
zinc finger, DHHC-type containing 2
|
|
chr8_-_74821610
|
0.597
|
|
STAU2
LOC729696
|
staufen, RNA binding protein, homolog 2 (Drosophila)
hypothetical protein LOC729696
|
|
chr11_+_107304344
|
0.597
|
NM_017516
|
RAB39
|
RAB39, member RAS oncogene family
|
|
chr18_-_802268
|
0.595
|
NM_005433
|
YES1
|
v-yes-1 Yamaguchi sarcoma viral oncogene homolog 1
|
|
chr14_-_52327895
|
0.591
|
|
GNPNAT1
|
glucosamine-phosphate N-acetyltransferase 1
|
|
chrX_-_16798383
|
0.588
|
NM_002893
|
RBBP7
|
retinoblastoma binding protein 7
|
|
chr9_+_130491291
|
0.584
|
NM_003011
|
SET
|
SET nuclear oncogene
|
|
chr6_+_84799969
|
0.582
|
NM_138409
|
MRAP2
|
melanocortin 2 receptor accessory protein 2
|
|
chr8_+_26204997
|
0.581
|
|
PPP2R2A
|
protein phosphatase 2, regulatory subunit B, alpha
|
|
chr10_+_93160033
|
0.580
|
|
|
|
|
chr10_-_43082372
|
0.579
|
NM_145313
|
RASGEF1A
|
RasGEF domain family, member 1A
|
|
chr21_-_39642712
|
0.578
|
|
HMGN1
|
high-mobility group nucleosome binding domain 1
|
|
chr1_-_93199586
|
0.577
|
NM_001006605
|
FAM69A
|
family with sequence similarity 69, member A
|
|
chrX_-_16798363
|
0.573
|
|
RBBP7
|
retinoblastoma binding protein 7
|
|
chr12_+_75682016
|
0.572
|
|
ZDHHC17
|
zinc finger, DHHC-type containing 17
|
|
chr14_-_22840249
|
0.571
|
|
|
|
|
chr8_-_74821636
|
0.571
|
NM_001164380
NM_001164381
NM_001164382
NM_001164383
NM_001164385
NM_014393
|
STAU2
|
staufen, RNA binding protein, homolog 2 (Drosophila)
|
|
chr15_+_73922838
|
0.570
|
|
UBE2Q2
|
ubiquitin-conjugating enzyme E2Q family member 2
|
|
chr5_-_40834232
|
0.569
|
|
PRKAA1
|
protein kinase, AMP-activated, alpha 1 catalytic subunit
|
|
chr3_-_38666122
|
0.568
|
NM_000335
NM_001099404
NM_001099405
NM_198056
NM_001160160
NM_001160161
|
SCN5A
|
sodium channel, voltage-gated, type V, alpha subunit
|
|
chr12_+_129388385
|
0.566
|
NM_001190971
NM_004764
|
PIWIL1
|
piwi-like 1 (Drosophila)
|
|
chr6_-_153494076
|
0.565
|
NM_012419
|
RGS17
|
regulator of G-protein signaling 17
|
|
chr7_+_106472243
|
0.565
|
NM_002736
|
PRKAR2B
|
protein kinase, cAMP-dependent, regulatory, type II, beta
|
|
chr1_+_35507197
|
0.564
|
|
ZMYM4
|
zinc finger, MYM-type 4
|
|
chr3_-_25680723
|
0.563
|
NM_001068
|
TOP2B
|
topoisomerase (DNA) II beta 180kDa
|
|
chr1_-_115433570
|
0.561
|
NM_005725
|
TSPAN2
|
tetraspanin 2
|
|
chr9_+_130491370
|
0.560
|
|
SET
|
SET nuclear oncogene
|
|
chr5_-_137396677
|
0.558
|
NM_001101800
NM_001101801
NM_016603
|
FAM13B
|
family with sequence similarity 13, member B
|
|
chr7_+_35807352
|
0.552
|
|
SEPT7
|
septin 7
|
|
chr15_+_73923047
|
0.551
|
|
UBE2Q2
|
ubiquitin-conjugating enzyme E2Q family member 2
|
|
chrX_-_16798096
|
0.550
|
|
RBBP7
|
retinoblastoma binding protein 7
|
|
chrX_-_135161185
|
0.550
|
NM_001173517
NM_024597
|
MAP7D3
|
MAP7 domain containing 3
|
|
chr10_-_64248932
|
0.550
|
NM_001136178
|
EGR2
|
early growth response 2
|
|
chr6_+_19945578
|
0.547
|
NM_001546
|
ID4
|
inhibitor of DNA binding 4, dominant negative helix-loop-helix protein
|
|
chr9_-_15500899
|
0.546
|
NM_001128217
NM_033222
|
PSIP1
|
PC4 and SFRS1 interacting protein 1
|
|
chr1_-_166171838
|
0.545
|
NM_015415
|
BRP44
|
brain protein 44
|
|
chr7_+_35807139
|
0.545
|
NM_001011553
NM_001788
|
SEPT7
|
septin 7
|
|
chr17_-_60345364
|
0.543
|
NM_199340
|
LRRC37A3
|
leucine rich repeat containing 37, member A3
|
|
chr11_+_32870935
|
0.540
|
NM_001076786
|
QSER1
|
glutamine and serine rich 1
|
|
chr5_-_167938875
|
0.539
|
|
PANK3
|
pantothenate kinase 3
|
|
chr6_-_79844618
|
0.539
|
|
PHIP
|
pleckstrin homology domain interacting protein
|
|
chr12_+_75682146
|
0.539
|
|
ZDHHC17
|
zinc finger, DHHC-type containing 17
|
|
chr7_+_64136078
|
0.537
|
|
CCT6P3
|
chaperonin containing TCP1, subunit 6 (zeta) pseudogene 3
|
|
chr1_+_210525885
|
0.536
|
|
PPP2R5A
|
protein phosphatase 2, regulatory subunit B', alpha
|
|
chr14_-_101623139
|
0.536
|
NM_005348
|
HSP90AA1
|
heat shock protein 90kDa alpha (cytosolic), class A member 1
|
|
chr12_+_50271283
|
0.535
|
NM_014191
|
SCN8A
|
sodium channel, voltage gated, type VIII, alpha subunit
|
|
chr3_+_23822481
|
0.533
|
|
UBE2E1
|
ubiquitin-conjugating enzyme E2E 1 (UBC4/5 homolog, yeast)
|
|
chr7_-_120823556
|
0.532
|
|
FAM3C
|
family with sequence similarity 3, member C
|
|
chr12_+_49444509
|
0.531
|
|
ATF1
|
activating transcription factor 1
|
|
chr18_+_12938010
|
0.529
|
|
SEH1L
|
SEH1-like (S. cerevisiae)
|
|
chr2_-_225615556
|
0.523
|
NM_014689
|
DOCK10
|
dedicator of cytokinesis 10
|
|
chr6_+_76367944
|
0.522
|
|
SENP6
|
SUMO1/sentrin specific peptidase 6
|
|
chr12_-_99060590
|
0.520
|
|
UHRF1BP1L
|
UHRF1 binding protein 1-like
|
|
chr7_+_64975778
|
0.518
|
|
VKORC1L1
|
vitamin K epoxide reductase complex, subunit 1-like 1
|
|
chr14_-_101623097
|
0.518
|
|
HSP90AA1
|
heat shock protein 90kDa alpha (cytosolic), class A member 1
|
|
chr1_-_181871473
|
0.517
|
|
ARPC5
|
actin related protein 2/3 complex, subunit 5, 16kDa
|
|
chr13_+_24844084
|
0.516
|
NM_016529
|
ATP8A2
|
ATPase, aminophospholipid transporter, class I, type 8A, member 2
|
|
chr8_+_172199
|
0.514
|
NM_173539
NM_001042415
NM_001042416
|
ZNF596
|
zinc finger protein 596
|
|
chr4_-_71924052
|
0.513
|
NM_001098477
|
GRSF1
|
G-rich RNA sequence binding factor 1
|
|
chr2_+_102602579
|
0.512
|
NM_003048
|
SLC9A2
|
solute carrier family 9 (sodium/hydrogen exchanger), member 2
|
|
chr1_-_224441024
|
0.511
|
NM_022735
|
ACBD3
|
acyl-CoA binding domain containing 3
|
|
chr1_-_58784967
|
0.510
|
NM_145243
|
OMA1
|
OMA1 homolog, zinc metallopeptidase (S. cerevisiae)
|
|
chr2_+_207016525
|
0.510
|
NM_003812
|
ADAM23
|
ADAM metallopeptidase domain 23
|
|
chr15_+_73922676
|
0.510
|
NM_173469
|
UBE2Q2
|
ubiquitin-conjugating enzyme E2Q family member 2
|
|
chr7_+_102502852
|
0.508
|
|
ARMC10
|
armadillo repeat containing 10
|
|
chr1_+_67168470
|
0.506
|
NM_001077701
NM_001077704
|
MIER1
|
mesoderm induction early response 1 homolog (Xenopus laevis)
|
|
chr9_-_126945536
|
0.506
|
NM_001144877
NM_173690
|
SCAI
|
suppressor of cancer cell invasion
|
|
chr12_+_69046241
|
0.505
|
NM_014505
|
KCNMB4
|
potassium large conductance calcium-activated channel, subfamily M, beta member 4
|
|
chr13_-_40533072
|
0.504
|
|
ELF1
|
E74-like factor 1 (ets domain transcription factor)
|
|
chr6_+_76368462
|
0.504
|
|
SENP6
|
SUMO1/sentrin specific peptidase 6
|
|
chr2_+_181553613
|
0.503
|
|
UBE2E3
|
ubiquitin-conjugating enzyme E2E 3 (UBC4/5 homolog, yeast)
|
|
chr5_-_114659863
|
0.503
|
NM_152549
|
CCDC112
|
coiled-coil domain containing 112
|
|
chr4_+_108965167
|
0.502
|
NM_001136258
|
SGMS2
|
sphingomyelin synthase 2
|
|
chr1_-_182273114
|
0.501
|
|
GLT25D2
|
glycosyltransferase 25 domain containing 2
|
|
chr4_+_154606900
|
0.501
|
NM_001131007
NM_015196
|
KIAA0922
|
KIAA0922
|
|
chr6_-_79844606
|
0.498
|
|
PHIP
|
pleckstrin homology domain interacting protein
|
|
chr12_-_116983276
|
0.497
|
NM_018639
|
WSB2
|
WD repeat and SOCS box containing 2
|
|
chr14_-_57688560
|
0.492
|
NM_001001872
|
C14orf37
|
chromosome 14 open reading frame 37
|
|
chr7_-_120823591
|
0.491
|
NM_001040020
NM_014888
|
FAM3C
|
family with sequence similarity 3, member C
|
|
chr12_-_99060771
|
0.490
|
NM_001006947
NM_015054
|
UHRF1BP1L
|
UHRF1 binding protein 1-like
|
|
chrX_-_19918958
|
0.490
|
|
LOC729609
|
hypothetical LOC729609
|
|
chr2_+_135392857
|
0.489
|
NM_001241
NM_058241
|
CCNT2
|
cyclin T2
|
|
chr1_-_181871416
|
0.487
|
|
ARPC5
|
actin related protein 2/3 complex, subunit 5, 16kDa
|
|
chr9_-_134220179
|
0.486
|
NM_015046
|
SETX
|
senataxin
|
|
chr1_-_181871462
|
0.485
|
|
ARPC5
|
actin related protein 2/3 complex, subunit 5, 16kDa
|
|
chr10_+_89613347
|
0.484
|
|
PTEN
|
phosphatase and tensin homolog
|
|
chrX_+_9392980
|
0.483
|
NM_005647
|
TBL1X
|
transducin (beta)-like 1X-linked
|
|
chr12_+_75681973
|
0.481
|
NM_015336
|
ZDHHC17
|
zinc finger, DHHC-type containing 17
|
|
chr10_+_64951114
|
0.479
|
NM_001001330
|
REEP3
|
receptor accessory protein 3
|
|
chr7_+_35807369
|
0.478
|
|
SEPT7
|
septin 7
|
|
chr1_-_224441023
|
0.477
|
|
ACBD3
|
acyl-CoA binding domain containing 3
|
|
chr10_+_94439658
|
0.476
|
NM_002729
|
HHEX
|
hematopoietically expressed homeobox
|
|
chr14_+_66777578
|
0.476
|
NM_022474
|
MPP5
|
membrane protein, palmitoylated 5 (MAGUK p55 subfamily member 5)
|