|
chr12_-_52975777
|
4.172
|
NM_006163
|
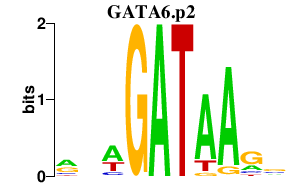
NFE2
|
nuclear factor (erythroid-derived 2), 45kDa
|
|
chr10_-_48036698
|
4.049
|
NM_016204
|
GDF2
|
growth differentiation factor 2
|
|
chr1_-_156923111
|
3.815
|
NM_003126
|
SPTA1
|
spectrin, alpha, erythrocytic 1 (elliptocytosis 2)
|
|
chr7_-_142369534
|
3.406
|
NM_000420
|
KEL
|
Kell blood group, metallo-endopeptidase
|
|
chr9_-_99740243
|
3.281
|
NM_197978
|
HEMGN
|
hemogen
|
|
chr7_-_142369519
|
3.184
|
|
KEL
|
Kell blood group, metallo-endopeptidase
|
|
chrX_+_65152004
|
3.137
|
|
|
|
|
chr12_-_52975823
|
3.118
|
|
NFE2
|
nuclear factor (erythroid-derived 2), 45kDa
|
|
chr12_-_68291208
|
3.046
|
NM_201550
|
LRRC10
|
leucine rich repeat containing 10
|
|
chr16_-_87570716
|
2.969
|
NM_005187
|
CBFA2T3
|
core-binding factor, runt domain, alpha subunit 2; translocated to, 3
|
|
chr6_-_46155937
|
2.729
|
NM_001114086
|
CLIC5
|
chloride intracellular channel 5
|
|
chr6_-_49712483
|
2.571
|
NM_000324
|
RHAG
|
Rh-associated glycoprotein
|
|
chr1_+_152560179
|
2.232
|
NM_080429
|
AQP10
|
aquaporin 10
|
|
chr7_-_100077072
|
2.227
|
NM_003227
|
TFR2
|
transferrin receptor 2
|
|
chr17_-_59437782
|
2.174
|
NM_000873
|
ICAM2
|
intercellular adhesion molecule 2
|
|
chr19_-_12858956
|
2.160
|
NM_006563
|
KLF1
|
Kruppel-like factor 1 (erythroid)
|
|
chr17_-_53764867
|
1.888
|
|
|
|
|
chr1_-_30969016
|
1.865
|
NM_002379
|
MATN1
|
matrilin 1, cartilage matrix protein
|
|
chr8_+_124264054
|
1.832
|
|
FAM83A
|
family with sequence similarity 83, member A
|
|
chrX_-_55074125
|
1.758
|
NM_000032
NM_001037967
NM_001037968
|
ALAS2
|
aminolevulinate, delta-, synthase 2
|
|
chr9_+_263025
|
1.711
|
NM_001190458
NM_001193536
|
DOCK8
|
dedicator of cytokinesis 8
|
|
chr12_+_70618892
|
1.689
|
NM_173353
|
TPH2
|
tryptophan hydroxylase 2
|
|
chr1_-_46789473
|
1.649
|
NM_001097611
|
KNCN
|
kinocilin
|
|
chr1_-_206125877
|
1.616
|
|
|
|
|
chr11_-_5419358
|
1.615
|
NM_001005288
|
OR51I1
|
olfactory receptor, family 51, subfamily I, member 1
|
|
chr8_+_124263932
|
1.615
|
NM_032899
NM_207006
|
FAM83A
|
family with sequence similarity 83, member A
|
|
chr2_+_169465995
|
1.585
|
NM_001081686
NM_021176
|
G6PC2
|
glucose-6-phosphatase, catalytic, 2
|
|
chr1_+_87368044
|
1.584
|
|
LOC339524
|
hypothetical LOC339524
|
|
chr12_+_8557402
|
1.568
|
NM_080387
|
CLEC4D
|
C-type lectin domain family 4, member D
|
|
chr10_+_118340460
|
1.536
|
NM_006229
|
PNLIPRP1
|
pancreatic lipase-related protein 1
|
|
chr11_-_5099422
|
1.490
|
NM_001005222
|
OR52A4
|
olfactory receptor, family 52, subfamily A, member 4
|
|
chr19_-_60241424
|
1.490
|
NM_001083899
NM_016363
|
GP6
|
glycoprotein VI (platelet)
|
|
chr7_+_150321771
|
1.457
|
NM_001160109
NM_001160110
NM_001160111
|
NOS3
|
nitric oxide synthase 3 (endothelial cell)
|
|
chr6_+_31782618
|
1.430
|
NM_001003693
|
LY6G6F
|
lymphocyte antigen 6 complex, locus G6F
|
|
chr3_-_185912240
|
1.419
|
NM_022149
|
MAGEF1
|
melanoma antigen family F, 1
|
|
chr11_-_26700121
|
1.382
|
NM_178498
|
SLC5A12
|
solute carrier family 5 (sodium/glucose cotransporter), member 12
|
|
chr7_+_129807467
|
1.344
|
NM_001868
|
CPA1
|
carboxypeptidase A1 (pancreatic)
|
|
chr6_-_30236667
|
1.339
|
NM_006778
NM_052828
|
TRIM10
|
tripartite motif containing 10
|
|
chr1_-_148124738
|
1.333
|
NM_003528
|
HIST2H2BE
|
histone cluster 2, H2be
|
|
chr16_+_55456619
|
1.333
|
NM_000339
NM_001126107
NM_001126108
|
SLC12A3
|
solute carrier family 12 (sodium/chloride transporters), member 3
|
|
chr2_+_27573206
|
1.331
|
NM_001486
|
GCKR
|
glucokinase (hexokinase 4) regulator
|
|
chr19_-_60360768
|
1.325
|
NM_000363
|
TNNI3
|
troponin I type 3 (cardiac)
|
|
chr19_+_7647934
|
1.321
|
NM_174918
|
C19orf59
|
chromosome 19 open reading frame 59
|
|
chr16_+_70117523
|
1.312
|
NM_005769
NM_001166395
|
CHST4
|
carbohydrate (N-acetylglucosamine 6-O) sulfotransferase 4
|
|
chr18_-_62422195
|
1.290
|
NM_021153
|
CDH19
|
cadherin 19, type 2
|
|
chr2_+_170742900
|
1.283
|
NM_001083615
NM_001171642
NM_138995
|
MYO3B
|
myosin IIIB
|
|
chr7_-_87774130
|
1.282
|
NM_024636
|
STEAP4
|
STEAP family member 4
|
|
chr1_+_50347188
|
1.272
|
|
ELAVL4
|
ELAV (embryonic lethal, abnormal vision, Drosophila)-like 4 (Hu antigen D)
|
|
chr16_+_24765052
|
1.268
|
NM_052944
|
SLC5A11
|
solute carrier family 5 (sodium/glucose cotransporter), member 11
|
|
chr11_+_71605466
|
1.250
|
NM_000803
NM_001113534
NM_001113535
NM_001113536
|
FOLR2
|
folate receptor 2 (fetal)
|
|
chr19_+_16860807
|
1.249
|
NM_003950
|
F2RL3
|
coagulation factor II (thrombin) receptor-like 3
|
|
chr17_-_39822366
|
1.235
|
NM_000419
|
ITGA2B
|
integrin, alpha 2b (platelet glycoprotein IIb of IIb/IIIa complex, antigen CD41)
|
|
chr12_+_121218218
|
1.221
|
NM_152759
|
LRRC43
|
leucine rich repeat containing 43
|
|
chr11_+_59027624
|
1.204
|
NM_001004706
|
OR4D11
|
olfactory receptor, family 4, subfamily D, member 11
|
|
chr11_-_5766621
|
1.189
|
NM_001001913
|
OR52N1
|
olfactory receptor, family 52, subfamily N, member 1
|
|
chr19_+_16860871
|
1.161
|
|
F2RL3
|
coagulation factor II (thrombin) receptor-like 3
|
|
chr7_+_142459538
|
1.154
|
NM_001001667
|
OR6V1
|
olfactory receptor, family 6, subfamily V, member 1
|
|
chr21_+_42697058
|
1.146
|
NM_001001895
NM_018961
|
UBASH3A
|
ubiquitin associated and SH3 domain containing A
|
|
chr1_+_22176004
|
1.146
|
NM_007352
|
CELA3A
CELA3B
|
chymotrypsin-like elastase family, member 3A
chymotrypsin-like elastase family, member 3B
|
|
chr1_+_246290586
|
1.144
|
NM_001004687
|
OR2L3
|
olfactory receptor, family 2, subfamily L, member 3
|
|
chr19_-_13074513
|
1.127
|
|
LYL1
|
lymphoblastic leukemia derived sequence 1
|
|
chr16_+_31446703
|
1.118
|
NM_016633
|
AHSP
|
alpha hemoglobin stabilizing protein
|
|
chr1_-_26266571
|
1.102
|
NM_032588
|
TRIM63
|
tripartite motif containing 63
|
|
chr12_-_14740694
|
1.087
|
NM_004963
|
GUCY2C
|
guanylate cyclase 2C (heat stable enterotoxin receptor)
|
|
chr19_-_11355882
|
1.084
|
NM_000121
|
EPOR
|
erythropoietin receptor
|
|
chr21_-_38792173
|
1.075
|
NM_001136155
NM_182918
|
ERG
|
v-ets erythroblastosis virus E26 oncogene homolog (avian)
|
|
chr9_-_124431634
|
1.050
|
NM_001004450
|
OR1B1
|
olfactory receptor, family 1, subfamily B, member 1
|
|
chr13_-_45654327
|
1.049
|
NM_002298
|
LCP1
|
lymphocyte cytosolic protein 1 (L-plastin)
|
|
chr2_-_175207521
|
1.035
|
NM_003387
|
WIPF1
|
WAS/WASL interacting protein family, member 1
|
|
chr9_-_205892
|
1.033
|
NM_152569
|
C9orf66
|
chromosome 9 open reading frame 66
|
|
chr13_-_45654296
|
1.032
|
|
LCP1
|
lymphocyte cytosolic protein 1 (L-plastin)
|
|
chr7_+_106293112
|
1.021
|
NM_002649
|
PIK3CG
|
phosphoinositide-3-kinase, catalytic, gamma polypeptide
|
|
chr12_-_23628774
|
1.007
|
NM_178010
|
SOX5
|
SRY (sex determining region Y)-box 5
|
|
chr10_+_98054074
|
0.973
|
NM_001017520
NM_004088
|
DNTT
|
deoxynucleotidyltransferase, terminal
|
|
chr12_+_54132264
|
0.968
|
NM_054105
|
OR6C2
|
olfactory receptor, family 6, subfamily C, member 2
|
|
chr17_+_54188205
|
0.965
|
|
PPM1E
|
protein phosphatase, Mg2+/Mn2+ dependent, 1E
|
|
chr22_+_33792125
|
0.946
|
NM_001008494
|
ISX
|
intestine-specific homeobox
|
|
chr5_-_131907071
|
0.946
|
NM_000879
|
IL5
|
interleukin 5 (colony-stimulating factor, eosinophil)
|
|
chrX_+_65299352
|
0.944
|
|
HEPH
|
hephaestin
|
|
chr1_+_195503956
|
0.942
|
NM_001193640
NM_201253
|
CRB1
|
crumbs homolog 1 (Drosophila)
|
|
chr7_+_129693938
|
0.941
|
NM_001869
|
CPA2
|
carboxypeptidase A2 (pancreatic)
|
|
chr6_+_135558572
|
0.937
|
|
|
|
|
chr9_-_70780574
|
0.933
|
|
|
|
|
chr11_-_67047374
|
0.928
|
NM_016366
NM_031204
|
CABP2
|
calcium binding protein 2
|
|
chr9_-_113977285
|
0.922
|
NM_022486
|
SUSD1
|
sushi domain containing 1
|
|
chr5_-_176868483
|
0.921
|
|
DOK3
|
docking protein 3
|
|
chr7_-_122627235
|
0.917
|
NM_022444
|
SLC13A1
|
solute carrier family 13 (sodium/sulfate symporters), member 1
|
|
chr8_-_72431274
|
0.911
|
NM_172058
NM_172059
NM_172060
|
EYA1
|
eyes absent homolog 1 (Drosophila)
|
|
chr12_-_51383513
|
0.910
|
NM_175078
|
KRT77
|
keratin 77
|
|
chr8_-_86477585
|
0.902
|
NM_001128829
NM_001128830
NM_001128831
NM_001738
|
CA1
|
carbonic anhydrase I
|
|
chr1_+_198263352
|
0.902
|
NM_003822
NM_205860
|
NR5A2
|
nuclear receptor subfamily 5, group A, member 2
|
|
chr6_-_29451042
|
0.887
|
NM_030959
|
OR12D3
|
olfactory receptor, family 12, subfamily D, member 3
|
|
chr10_-_134449467
|
0.882
|
NM_177400
|
NKX6-2
|
NK6 homeobox 2
|
|
chr12_+_52105131
|
0.881
|
|
AMHR2
|
anti-Mullerian hormone receptor, type II
|
|
chr5_-_96504194
|
0.879
|
|
LIX1
|
Lix1 homolog (chicken)
|
|
chr11_+_5399916
|
0.877
|
NM_001004757
|
OR51Q1
|
olfactory receptor, family 51, subfamily Q, member 1
|
|
chr17_-_44400952
|
0.871
|
NM_004123
|
GIP
|
gastric inhibitory polypeptide
|
|
chr8_-_20084892
|
0.865
|
NM_001135691
NM_001142324
NM_001142325
NM_003053
|
SLC18A1
|
solute carrier family 18 (vesicular monoamine), member 1
|
|
chr3_+_115099007
|
0.858
|
NM_001172105
|
GRAMD1C
|
GRAM domain containing 1C
|
|
chrX_-_78509367
|
0.855
|
|
ITM2A
|
integral membrane protein 2A
|
|
chr1_+_173303616
|
0.855
|
NM_022093
|
TNN
|
tenascin N
|
|
chrX_+_34870833
|
0.854
|
NM_152631
|
FAM47B
|
family with sequence similarity 47, member B
|
|
chr12_-_51298599
|
0.845
|
NM_175068
|
KRT73
|
keratin 73
|
|
chr11_-_123816190
|
0.844
|
NM_012378
|
OR8B8
|
olfactory receptor, family 8, subfamily B, member 8
|
|
chr18_-_39111243
|
0.836
|
NM_020783
|
SYT4
|
synaptotagmin IV
|
|
chr4_+_111616630
|
0.829
|
NM_001977
|
ENPEP
|
glutamyl aminopeptidase (aminopeptidase A)
|
|
chr2_+_102294393
|
0.819
|
NM_016232
|
IL18R1
IL1RL1
|
interleukin 18 receptor 1
interleukin 1 receptor-like 1
|
|
chr7_+_139175420
|
0.818
|
NM_001061
NM_001166253
NM_030984
|
TBXAS1
|
thromboxane A synthase 1 (platelet)
|
|
chr3_-_57209319
|
0.806
|
NM_003865
|
HESX1
|
HESX homeobox 1
|
|
chrX_+_44588192
|
0.800
|
NM_022076
|
DUSP21
|
dual specificity phosphatase 21
|
|
chr19_-_53239030
|
0.788
|
NM_019855
|
CABP5
|
calcium binding protein 5
|
|
chr14_+_75058518
|
0.788
|
NM_006399
|
BATF
|
basic leucine zipper transcription factor, ATF-like
|
|
chr6_-_29503468
|
0.783
|
NM_013937
|
OR11A1
|
olfactory receptor, family 11, subfamily A, member 1
|
|
chr5_+_140481763
|
0.783
|
NM_018938
|
PCDHB4
|
protocadherin beta 4
|
|
chr1_-_153537810
|
0.780
|
NM_000298
|
PKLR
|
pyruvate kinase, liver and RBC
|
|
chr13_-_45654292
|
0.779
|
|
LCP1
|
lymphocyte cytosolic protein 1 (L-plastin)
|
|
chr7_+_20621769
|
0.776
|
NM_001163941
|
ABCB5
|
ATP-binding cassette, sub-family B (MDR/TAP), member 5
|
|
chr12_-_16321885
|
0.771
|
NM_001170798
|
SLC15A5
|
solute carrier family 15, member 5
|
|
chr14_+_19681734
|
0.770
|
NM_001004724
|
OR4N5
|
olfactory receptor, family 4, subfamily N, member 5
|
|
chr6_+_167624792
|
0.769
|
NM_001143947
NM_018974
|
UNC93A
|
unc-93 homolog A (C. elegans)
|
|
chr13_+_31211678
|
0.756
|
NM_001166058
NM_130806
|
RXFP2
|
relaxin/insulin-like family peptide receptor 2
|
|
chrX_+_65299157
|
0.755
|
NM_138737
|
HEPH
|
hephaestin
|
|
chr11_-_16387001
|
0.753
|
NM_001145811
|
SOX6
|
SRY (sex determining region Y)-box 6
|
|
chr1_-_27113018
|
0.751
|
NM_021969
|
NR0B2
|
nuclear receptor subfamily 0, group B, member 2
|
|
chr11_+_91724909
|
0.749
|
NM_001008781
|
FAT3
|
FAT tumor suppressor homolog 3 (Drosophila)
|
|
chr2_-_68952006
|
0.746
|
NM_014482
|
BMP10
|
bone morphogenetic protein 10
|
|
chr4_+_120276386
|
0.741
|
NM_016599
|
MYOZ2
|
myozenin 2
|
|
chr19_+_9984861
|
0.736
|
NM_015725
|
RDH8
|
retinol dehydrogenase 8 (all-trans)
|
|
chr6_+_135558744
|
0.735
|
|
MYB
|
v-myb myeloblastosis viral oncogene homolog (avian)
|
|
chr9_+_101628829
|
0.727
|
NM_173200
|
NR4A3
|
nuclear receptor subfamily 4, group A, member 3
|
|
chr11_-_56914668
|
0.721
|
NM_002728
|
PRG2
|
proteoglycan 2, bone marrow (natural killer cell activator, eosinophil granule major basic protein)
|
|
chr17_-_45196516
|
0.719
|
NM_030802
|
FAM117A
|
family with sequence similarity 117, member A
|
|
chr1_-_204179169
|
0.719
|
NM_052934
NM_134325
|
SLC26A9
|
solute carrier family 26, member 9
|
|
chr10_-_21226536
|
0.719
|
NM_006393
|
NEBL
|
nebulette
|
|
chr17_-_3766441
|
0.703
|
|
P2RX1
|
purinergic receptor P2X, ligand-gated ion channel, 1
|
|
chr5_-_135318420
|
0.695
|
NM_002302
|
LECT2
|
leukocyte cell-derived chemotaxin 2
|
|
chr6_+_41118214
|
0.685
|
NM_001010873
NM_001159726
|
TSPO2
|
translocator protein 2
|
|
chr10_-_7722747
|
0.683
|
|
ITIH5
|
inter-alpha (globulin) inhibitor H5
|
|
chr3_-_139333813
|
0.682
|
NM_016161
|
A4GNT
|
alpha-1,4-N-acetylglucosaminyltransferase
|
|
chr2_+_69055208
|
0.681
|
NM_019617
|
GKN1
|
gastrokine 1
|
|
chr13_-_27441290
|
0.679
|
NM_001265
|
CDX2
|
caudal type homeobox 2
|
|
chr6_+_54281161
|
0.678
|
NM_014464
|
TINAG
|
tubulointerstitial nephritis antigen
|
|
chr5_-_39255335
|
0.662
|
NM_001465
NM_199335
|
FYB
|
FYN binding protein
|
|
chr2_+_220087135
|
0.661
|
NM_018674
NM_182847
|
ACCN4
|
amiloride-sensitive cation channel 4, pituitary
|
|
chr8_-_72437020
|
0.658
|
NM_000503
|
EYA1
|
eyes absent homolog 1 (Drosophila)
|
|
chr17_+_65612589
|
0.657
|
NM_170742
|
KCNJ16
|
potassium inwardly-rectifying channel, subfamily J, member 16
|
|
chr17_-_53761119
|
0.656
|
NM_004758
NM_024418
|
BZRAP1
|
benzodiazapine receptor (peripheral) associated protein 1
|
|
chr6_-_118103062
|
0.655
|
|
|
|
|
chr11_+_59612712
|
0.649
|
NM_000139
|
MS4A2
|
membrane-spanning 4-domains, subfamily A, member 2 (Fc fragment of IgE, high affinity I, receptor for; beta polypeptide)
|
|
chr17_-_29714293
|
0.644
|
NM_002981
|
CCL1
|
chemokine (C-C motif) ligand 1
|
|
chr21_-_14840506
|
0.641
|
NM_022136
|
SAMSN1
|
SAM domain, SH3 domain and nuclear localization signals 1
|
|
chr4_+_78651929
|
0.634
|
NM_006419
|
CXCL13
|
chemokine (C-X-C motif) ligand 13
|
|
chr1_-_166149867
|
0.631
|
NM_001167749
NM_018417
|
ADCY10
|
adenylate cyclase 10 (soluble)
|
|
chr6_-_49820030
|
0.631
|
NM_001190986
NM_006061
|
CRISP3
|
cysteine-rich secretory protein 3
|
|
chr8_-_41774296
|
0.630
|
NM_000037
NM_020475
NM_020476
NM_020477
|
ANK1
|
ankyrin 1, erythrocytic
|
|
chr1_-_109651140
|
0.629
|
NM_001010985
|
MYBPHL
|
myosin binding protein H-like
|
|
chr3_+_46370578
|
0.621
|
|
CCR2
|
chemokine (C-C motif) receptor 2
|
|
chr8_-_124818754
|
0.621
|
NM_001003954
NM_004306
|
ANXA13
|
annexin A13
|
|
chr8_+_12847521
|
0.617
|
NM_020844
|
KIAA1456
|
KIAA1456
|
|
chr5_+_131424245
|
0.616
|
NM_000588
|
IL3
|
interleukin 3 (colony-stimulating factor, multiple)
|
|
chr19_+_10258642
|
0.615
|
NM_001039132
NM_001544
NM_022377
|
ICAM4
|
intercellular adhesion molecule 4 (Landsteiner-Wiener blood group)
|
|
chr6_-_123999640
|
0.611
|
NM_006073
|
TRDN
|
triadin
|
|
chr17_-_45196465
|
0.608
|
|
FAM117A
|
family with sequence similarity 117, member A
|
|
chr20_-_29524476
|
0.602
|
NM_001037500
|
DEFB124
|
defensin, beta 124
|
|
chr2_-_49235059
|
0.597
|
NM_000145
NM_181446
|
FSHR
|
follicle stimulating hormone receptor
|
|
chr22_+_21559959
|
0.591
|
NM_001178126
|
IGLL5
IGLC1
|
immunoglobulin lambda-like polypeptide 5
immunoglobulin lambda constant 1 (Mcg marker)
|
|
chr7_+_143287952
|
0.589
|
NM_012369
|
OR2F1
|
olfactory receptor, family 2, subfamily F, member 1
|
|
chr14_+_75058591
|
0.588
|
|
BATF
|
basic leucine zipper transcription factor, ATF-like
|
|
chrX_+_119379967
|
0.588
|
NM_001142447
NM_012069
|
ATP1B4
|
ATPase, Na+/K+ transporting, beta 4 polypeptide
|
|
chr19_-_13074669
|
0.588
|
|
LYL1
|
lymphoblastic leukemia derived sequence 1
|
|
chr6_+_49575629
|
0.585
|
NM_001010904
|
GLYATL3
|
glycine-N-acyltransferase-like 3
|
|
chr18_-_26996742
|
0.585
|
NM_004948
NM_024421
|
DSC1
|
desmocollin 1
|
|
chr11_+_1064869
|
0.582
|
NM_002457
|
MUC2
|
mucin 2, oligomeric mucus/gel-forming
|
|
chr16_+_142853
|
0.580
|
NM_005332
|
HBZ
|
hemoglobin, zeta
|
|
chr19_+_40824486
|
0.578
|
NM_014209
|
ETV2
|
ets variant 2
|
|
chr7_+_127020924
|
0.576
|
NM_020369
|
FSCN3
|
fascin homolog 3, actin-bundling protein, testicular (Strongylocentrotus purpuratus)
|
|
chr12_+_98565663
|
0.575
|
NM_153364
|
FAM71C
|
family with sequence similarity 71, member C
|
|
chr4_+_75393053
|
0.567
|
NM_001013442
|
EPGN
|
epithelial mitogen homolog (mouse)
|
|
chr2_-_219558517
|
0.566
|
NM_017521
|
FEV
|
FEV (ETS oncogene family)
|
|
chr2_+_166137091
|
0.563
|
NM_024969
|
CSRNP3
|
cysteine-serine-rich nuclear protein 3
|
|
chr3_+_129124591
|
0.560
|
NM_207335
|
KBTBD12
|
kelch repeat and BTB (POZ) domain containing 12
|
|
chr6_-_46997579
|
0.558
|
NM_001098518
|
GPR116
|
G protein-coupled receptor 116
|
|
chr8_+_120148604
|
0.555
|
NM_006438
|
COLEC10
|
collectin sub-family member 10 (C-type lectin)
|
|
chr2_-_144711375
|
0.555
|
NM_024659
|
GTDC1
|
glycosyltransferase-like domain containing 1
|
|
chrX_-_70248022
|
0.555
|
NM_000206
|
IL2RG
|
interleukin 2 receptor, gamma
|
|
chr5_-_34020445
|
0.553
|
NM_001012509
NM_016180
|
SLC45A2
|
solute carrier family 45, member 2
|
|
chr3_+_133518900
|
0.553
|
NM_001099
NM_001134194
|
ACPP
|
acid phosphatase, prostate
|
|
chr22_-_48865864
|
0.550
|
|
MLC1
|
megalencephalic leukoencephalopathy with subcortical cysts 1
|
|
chr1_+_213245507
|
0.550
|
NM_001017424
|
KCNK2
|
potassium channel, subfamily K, member 2
|
|
chr3_-_3127057
|
0.545
|
NM_000564
NM_175724
NM_175725
NM_175726
NM_175727
NM_175728
|
IL5RA
|
interleukin 5 receptor, alpha
|
|
chr5_+_32824701
|
0.544
|
NM_024563
|
NPR3
|
natriuretic peptide receptor C/guanylate cyclase C (atrionatriuretic peptide receptor C)
|
|
chr2_+_234191029
|
0.542
|
NM_019076
|
UGT1A8
|
UDP glucuronosyltransferase 1 family, polypeptide A8
|
|
chrX_+_15435351
|
0.536
|
NM_001721
|
BMX
|
BMX non-receptor tyrosine kinase
|
|
chr15_-_91078307
|
0.535
|
|
FAM174B
|
family with sequence similarity 174, member B
|
|
chr11_+_56705796
|
0.534
|
NM_001005210
|
LRRC55
|
leucine rich repeat containing 55
|
|
chr8_-_93144366
|
0.531
|
NM_004349
|
RUNX1T1
|
runt-related transcription factor 1; translocated to, 1 (cyclin D-related)
|
|
chr7_-_112515068
|
0.530
|
NM_001146265
NM_018970
|
GPR85
|
G protein-coupled receptor 85
|
|
chr10_-_48010879
|
0.529
|
NM_002900
|
RBP3
|
retinol binding protein 3, interstitial
|
|
chr1_-_153537362
|
0.528
|
NM_181871
|
PKLR
|
pyruvate kinase, liver and RBC
|
|
chr15_-_41300316
|
0.527
|
|
EPB42
|
erythrocyte membrane protein band 4.2
|
