|
chr20_+_34603311
|
4.209
|
|
MYL9
|
myosin, light chain 9, regulatory
|
|
chr5_+_137829065
|
4.197
|
|
EGR1
|
early growth response 1
|
|
chr20_+_34603290
|
4.015
|
NM_006097
NM_181526
|
MYL9
|
myosin, light chain 9, regulatory
|
|
chr2_+_73973640
|
3.370
|
|
ACTG2
|
actin, gamma 2, smooth muscle, enteric
|
|
chr5_-_33928049
|
2.963
|
|
ADAMTS12
|
ADAM metallopeptidase with thrombospondin type 1 motif, 12
|
|
chr9_-_78710698
|
2.930
|
NM_015225
|
PRUNE2
|
prune homolog 2 (Drosophila)
|
|
chr5_-_33927724
|
2.540
|
NM_030955
|
ADAMTS12
|
ADAM metallopeptidase with thrombospondin type 1 motif, 12
|
|
chr2_+_73973600
|
2.534
|
NM_001615
|
ACTG2
|
actin, gamma 2, smooth muscle, enteric
|
|
chr5_+_137829077
|
2.461
|
NM_001964
|
EGR1
|
early growth response 1
|
|
chr1_-_89303478
|
2.254
|
NM_002053
|
GBP1
|
guanylate binding protein 1, interferon-inducible, 67kDa
|
|
chr9_+_36126667
|
2.048
|
|
GLIPR2
|
GLI pathogenesis-related 2
|
|
chr15_-_32875040
|
1.957
|
NM_005159
|
ACTC1
|
actin, alpha, cardiac muscle 1
|
|
chr1_-_166373434
|
1.822
|
|
GPR161
|
G protein-coupled receptor 161
|
|
chr17_-_44026042
|
1.772
|
NM_002147
|
HOXB5
|
homeobox B5
|
|
chr12_+_50731457
|
1.715
|
NM_002135
NM_173157
|
NR4A1
|
nuclear receptor subfamily 4, group A, member 1
|
|
chr17_+_39990124
|
1.617
|
NM_001466
|
FZD2
|
frizzled homolog 2 (Drosophila)
|
|
chr5_+_60663842
|
1.612
|
NM_020928
|
ZSWIM6
|
zinc finger, SWIM-type containing 6
|
|
chr1_-_166373351
|
1.601
|
|
GPR161
|
G protein-coupled receptor 161
|
|
chr9_+_91409746
|
1.526
|
NM_006705
|
GADD45G
|
growth arrest and DNA-damage-inducible, gamma
|
|
chr1_-_166373159
|
1.509
|
|
GPR161
|
G protein-coupled receptor 161
|
|
chr6_+_116939500
|
1.450
|
NM_153711
|
FAM26E
|
family with sequence similarity 26, member E
|
|
chr10_-_131652364
|
1.447
|
|
EBF3
|
early B-cell factor 3
|
|
chr9_+_36126710
|
1.431
|
NM_022343
|
GLIPR2
|
GLI pathogenesis-related 2
|
|
chr17_-_44026321
|
1.355
|
|
HOXB5
|
homeobox B5
|
|
chr2_-_160765008
|
1.302
|
|
ITGB6
|
integrin, beta 6
|
|
chr22_+_29810981
|
1.289
|
|
SMTN
|
smoothelin
|
|
chr1_+_179324458
|
1.191
|
|
IER5
|
immediate early response 5
|
|
chr15_-_63147350
|
1.177
|
NM_016563
|
RASL12
|
RAS-like, family 12
|
|
chr1_-_89261021
|
1.149
|
NM_018284
|
GBP3
|
guanylate binding protein 3
|
|
chr4_+_81337663
|
1.095
|
NM_001099403
|
PRDM8
|
PR domain containing 8
|
|
chr18_-_42804531
|
1.072
|
NM_145653
|
TCEB3C
|
transcription elongation factor B polypeptide 3C (elongin A3)
|
|
chr19_-_15204767
|
1.064
|
NM_001142886
|
EPHX3
|
epoxide hydrolase 3
|
|
chr1_-_227636462
|
1.062
|
NM_001100
|
ACTA1
|
actin, alpha 1, skeletal muscle
|
|
chr10_-_16899342
|
1.048
|
|
RSU1
|
Ras suppressor protein 1
|
|
chr7_-_27149750
|
1.045
|
NM_019102
|
HOXA5
|
homeobox A5
|
|
chr9_+_18464090
|
1.037
|
NM_001040272
NM_052866
|
ADAMTSL1
|
ADAMTS-like 1
|
|
chr5_+_92944680
|
1.000
|
NM_005654
|
NR2F1
|
nuclear receptor subfamily 2, group F, member 1
|
|
chr1_-_206151055
|
0.995
|
NM_001025109
NM_001773
|
CD34
|
CD34 molecule
|
|
chr11_-_118799058
|
0.929
|
|
THY1
|
Thy-1 cell surface antigen
|
|
chr3_-_46879883
|
0.911
|
NM_000258
|
MYL3
|
myosin, light chain 3, alkali; ventricular, skeletal, slow
|
|
chr20_-_42249146
|
0.880
|
|
JPH2
|
junctophilin 2
|
|
chr10_+_112247614
|
0.876
|
NM_004419
|
DUSP5
|
dual specificity phosphatase 5
|
|
chr19_-_40939756
|
0.859
|
NM_144617
|
HSPB6
|
heat shock protein, alpha-crystallin-related, B6
|
|
chr8_-_22606653
|
0.849
|
NM_004430
|
EGR3
|
early growth response 3
|
|
chr3_+_150675117
|
0.842
|
NM_004617
|
TM4SF4
|
transmembrane 4 L six family member 4
|
|
chr2_-_151052391
|
0.825
|
NM_005168
|
RND3
|
Rho family GTPase 3
|
|
chr11_+_116575249
|
0.806
|
NM_001001522
NM_003186
|
TAGLN
|
transgelin
|
|
chr6_-_105691675
|
0.801
|
|
BVES
|
blood vessel epicardial substance
|
|
chr16_+_69215395
|
0.792
|
NM_001172772
|
IL34
|
interleukin 34
|
|
chr9_+_139892049
|
0.764
|
NM_000718
|
CACNA1B
|
calcium channel, voltage-dependent, N type, alpha 1B subunit
|
|
chr18_-_42804291
|
0.760
|
NM_001100817
|
TCEB3C
TCEB3CL
|
transcription elongation factor B polypeptide 3C (elongin A3)
transcription elongation factor B polypeptide 3C-like
|
|
chr10_-_90702490
|
0.760
|
NM_001613
|
ACTA2
|
actin, alpha 2, smooth muscle, aorta
|
|
chr2_-_40593074
|
0.760
|
NM_001112802
|
SLC8A1
|
solute carrier family 8 (sodium/calcium exchanger), member 1
|
|
chr18_-_42810446
|
0.751
|
NM_145653
|
TCEB3C
|
transcription elongation factor B polypeptide 3C (elongin A3)
|
|
chr19_+_977608
|
0.746
|
|
CNN2
|
calponin 2
|
|
chrX_-_99873728
|
0.733
|
NM_001129896
|
SYTL4
|
synaptotagmin-like 4
|
|
chr11_-_65424434
|
0.727
|
|
FOSL1
|
FOS-like antigen 1
|
|
chr2_-_128149112
|
0.721
|
NM_001136037
NM_001161403
|
LIMS2
|
LIM and senescent cell antigen-like domains 2
|
|
chr3_+_189413414
|
0.711
|
NM_005578
|
LPP
|
LIM domain containing preferred translocation partner in lipoma
|
|
chrX_-_10761729
|
0.707
|
NM_033290
|
MID1
|
midline 1 (Opitz/BBB syndrome)
|
|
chr10_-_29963906
|
0.698
|
NM_021738
|
SVIL
|
supervillin
|
|
chr12_+_52713098
|
0.687
|
NM_018953
|
HOXC5
|
homeobox C5
|
|
chr6_-_109882116
|
0.681
|
|
MICAL1
|
microtubule associated monoxygenase, calponin and LIM domain containing 1
|
|
chr11_-_65424436
|
0.680
|
NM_005438
|
FOSL1
|
FOS-like antigen 1
|
|
chr5_-_58331515
|
0.654
|
NM_001197223
|
PDE4D
|
phosphodiesterase 4D, cAMP-specific
|
|
chr14_-_52487558
|
0.646
|
NM_001134999
NM_001135000
NM_006832
|
FERMT2
|
fermitin family member 2
|
|
chr11_-_65424385
|
0.641
|
|
FOSL1
|
FOS-like antigen 1
|
|
chr17_-_1336073
|
0.640
|
|
MYO1C
|
myosin IC
|
|
chr4_+_109033868
|
0.633
|
NM_001136257
NM_152621
|
SGMS2
|
sphingomyelin synthase 2
|
|
chr22_-_35114001
|
0.620
|
NM_002473
|
MYH9
|
myosin, heavy chain 9, non-muscle
|
|
chr19_+_12996368
|
0.619
|
|
NFIX
|
nuclear factor I/X (CCAAT-binding transcription factor)
|
|
chr10_+_88418243
|
0.617
|
NM_001080116
NM_001080114
NM_001080115
NM_001171611
NM_007078
|
LDB3
|
LIM domain binding 3
|
|
chr19_+_977582
|
0.615
|
|
CNN2
|
calponin 2
|
|
chr7_-_5536783
|
0.614
|
|
ACTB
|
actin, beta
|
|
chr19_+_2427122
|
0.599
|
NM_015675
|
GADD45B
|
growth arrest and DNA-damage-inducible, beta
|
|
chr15_-_63147228
|
0.595
|
|
RASL12
|
RAS-like, family 12
|
|
chr19_+_16039170
|
0.588
|
NM_001145160
|
TPM4
|
tropomyosin 4
|
|
chr6_-_117256890
|
0.576
|
NM_148963
|
GPRC6A
|
G protein-coupled receptor, family C, group 6, member A
|
|
chr15_+_94674849
|
0.575
|
NM_021005
|
NR2F2
|
nuclear receptor subfamily 2, group F, member 2
|
|
chr7_+_142788521
|
0.575
|
|
ZYX
|
zyxin
|
|
chr7_+_142788480
|
0.567
|
NM_001010972
NM_003461
|
ZYX
|
zyxin
|
|
chr12_-_90029672
|
0.553
|
NM_002345
|
LUM
|
lumican
|
|
chr2_-_160764819
|
0.551
|
NM_000888
|
ITGB6
|
integrin, beta 6
|
|
chr19_+_977601
|
0.551
|
|
CNN2
|
calponin 2
|
|
chr6_+_151603201
|
0.550
|
|
AKAP12
|
A kinase (PRKA) anchor protein 12
|
|
chr2_-_215956429
|
0.549
|
|
FN1
|
fibronectin 1
|
|
chr11_+_59564323
|
0.533
|
NM_173801
|
PLAC1L
|
placenta-specific 1-like
|
|
chr3_+_150675169
|
0.526
|
|
TM4SF4
|
transmembrane 4 L six family member 4
|
|
chr3_-_158704056
|
0.515
|
NM_001167915
NM_001167916
|
VEPH1
|
ventricular zone expressed PH domain homolog 1 (zebrafish)
|
|
chr19_+_977624
|
0.513
|
|
CNN2
|
calponin 2
|
|
chr6_+_151602787
|
0.510
|
NM_005100
|
AKAP12
|
A kinase (PRKA) anchor protein 12
|
|
chr19_+_977555
|
0.508
|
|
CNN2
|
calponin 2
|
|
chr19_+_50663089
|
0.504
|
NM_001114171
NM_006732
|
FOSB
|
FBJ murine osteosarcoma viral oncogene homolog B
|
|
chr1_-_16217025
|
0.503
|
|
HSPB7
|
heat shock 27kDa protein family, member 7 (cardiovascular)
|
|
chr7_+_142788569
|
0.499
|
|
ZYX
|
zyxin
|
|
chr14_+_74815233
|
0.498
|
NM_005252
|
FOS
|
FBJ murine osteosarcoma viral oncogene homolog
|
|
chr17_+_30498948
|
0.498
|
NM_001033576
NM_173167
|
UNC45B
|
unc-45 homolog B (C. elegans)
|
|
chr5_+_149526533
|
0.496
|
NM_001804
|
CDX1
|
caudal type homeobox 1
|
|
chr7_+_142788517
|
0.496
|
|
ZYX
|
zyxin
|
|
chr14_+_73775927
|
0.490
|
NM_182894
|
VSX2
|
visual system homeobox 2
|
|
chr7_+_142788566
|
0.488
|
|
ZYX
|
zyxin
|
|
chr17_-_4831388
|
0.487
|
NM_001171167
NM_001171168
|
CAMTA2
|
calmodulin binding transcription activator 2
|
|
chr7_-_80386602
|
0.486
|
NM_006379
|
SEMA3C
|
sema domain, immunoglobulin domain (Ig), short basic domain, secreted, (semaphorin) 3C
|
|
chr15_+_72006015
|
0.482
|
|
LOXL1
|
lysyl oxidase-like 1
|
|
chr1_-_11830328
|
0.480
|
NM_006172
|
NPPA
|
natriuretic peptide A
|
|
chr16_+_31390567
|
0.473
|
NM_001042454
NM_001164719
|
TGFB1I1
|
transforming growth factor beta 1 induced transcript 1
|
|
chr7_-_107430566
|
0.461
|
NM_002291
|
LAMB1
|
laminin, beta 1
|
|
chr11_-_47330797
|
0.456
|
NM_000256
|
MYBPC3
|
myosin binding protein C, cardiac
|
|
chr11_+_74950893
|
0.456
|
|
SERPINH1
|
serpin peptidase inhibitor, clade H (heat shock protein 47), member 1, (collagen binding protein 1)
|
|
chr22_+_36334811
|
0.453
|
|
GGA1
|
golgi-associated, gamma adaptin ear containing, ARF binding protein 1
|
|
chr4_-_88669625
|
0.430
|
NM_001128310
NM_004684
|
SPARCL1
|
SPARC-like 1 (hevin)
|
|
chr17_-_36456949
|
0.427
|
NM_001123387
|
KRTAP2-1
|
keratin associated protein 2-1
|
|
chr10_-_64246080
|
0.424
|
|
EGR2
|
early growth response 2
|
|
chr1_-_206151002
|
0.411
|
|
CD34
|
CD34 molecule
|
|
chr19_-_52666886
|
0.410
|
|
SLC8A2
|
solute carrier family 8 (sodium/calcium exchanger), member 2
|
|
chr5_+_140730014
|
0.399
|
NM_018924
NM_032097
|
PCDHGB3
|
protocadherin gamma subfamily B, 3
|
|
chr10_-_16899395
|
0.394
|
|
RSU1
|
Ras suppressor protein 1
|
|
chr7_-_5536704
|
0.393
|
NM_001101
|
ACTB
|
actin, beta
|
|
chrX_-_37591760
|
0.392
|
NM_006520
|
DYNLT3
|
dynein, light chain, Tctex-type 3
|
|
chr22_+_36334400
|
0.392
|
NM_001001560
NM_001001561
NM_001172687
NM_013365
|
GGA1
|
golgi-associated, gamma adaptin ear containing, ARF binding protein 1
|
|
chr21_-_27139143
|
0.388
|
|
ADAMTS1
|
ADAM metallopeptidase with thrombospondin type 1 motif, 1
|
|
chr5_-_141981083
|
0.386
|
NM_001144892
|
FGF1
|
fibroblast growth factor 1 (acidic)
|
|
chr17_-_4831644
|
0.384
|
NM_001171166
NM_015099
|
CAMTA2
|
calmodulin binding transcription activator 2
|
|
chr7_-_80386258
|
0.377
|
|
SEMA3C
|
sema domain, immunoglobulin domain (Ig), short basic domain, secreted, (semaphorin) 3C
|
|
chr7_+_94123612
|
0.376
|
NM_001172437
NM_001172438
|
PEG10
|
paternally expressed 10
|
|
chr1_-_2451543
|
0.374
|
NM_001010926
|
HES5
|
hairy and enhancer of split 5 (Drosophila)
|
|
chr13_-_77447664
|
0.359
|
NM_000115
|
EDNRB
|
endothelin receptor type B
|
|
chr10_+_31650069
|
0.359
|
NM_001128128
NM_001174094
|
ZEB1
|
zinc finger E-box binding homeobox 1
|
|
chr2_+_26768894
|
0.354
|
NM_002246
|
KCNK3
|
potassium channel, subfamily K, member 3
|
|
chr7_+_142788579
|
0.353
|
|
ZYX
|
zyxin
|
|
chr2_-_105381855
|
0.352
|
NM_001039492
NM_001450
NM_201555
|
FHL2
|
four and a half LIM domains 2
|
|
chr2_+_42128521
|
0.345
|
NM_138370
|
PKDCC
|
protein kinase domain containing, cytoplasmic homolog (mouse)
|
|
chr2_+_100545827
|
0.342
|
NM_024065
|
PDCL3
|
phosducin-like 3
|
|
chr12_+_8167494
|
0.336
|
NM_016184
NM_194447
NM_194448
NM_194450
|
CLEC4A
|
C-type lectin domain family 4, member A
|
|
chr22_+_24468110
|
0.325
|
NM_032608
|
MYO18B
|
myosin XVIIIB
|
|
chr19_+_59064471
|
0.322
|
NM_001020821
NM_001020818
|
MYADM
|
myeloid-associated differentiation marker
|
|
chr22_+_36334622
|
0.317
|
|
GGA1
|
golgi-associated, gamma adaptin ear containing, ARF binding protein 1
|
|
chr7_-_526005
|
0.315
|
NM_002607
NM_033023
|
PDGFA
|
platelet-derived growth factor alpha polypeptide
|
|
chr1_-_148080888
|
0.308
|
NM_001040874
NM_003516
|
HIST2H2AA4
HIST2H2AA3
|
histone cluster 2, H2aa4
histone cluster 2, H2aa3
|
|
chr19_+_12995782
|
0.307
|
|
NFIX
|
nuclear factor I/X (CCAAT-binding transcription factor)
|
|
chr9_-_4290028
|
0.305
|
NM_001042413
|
GLIS3
|
GLIS family zinc finger 3
|
|
chr19_-_50975603
|
0.304
|
NM_001081563
|
DMPK
|
dystrophia myotonica-protein kinase
|
|
chr2_+_46560207
|
0.303
|
NM_001145051
|
LOC388946
|
transmembrane protein ENSP00000343375
|
|
chr7_+_142788730
|
0.300
|
|
ZYX
|
zyxin
|
|
chr4_+_86918882
|
0.298
|
|
ARHGAP24
|
Rho GTPase activating protein 24
|
|
chr1_+_15957832
|
0.298
|
NM_017556
|
FBLIM1
|
filamin binding LIM protein 1
|
|
chrX_-_37591703
|
0.298
|
|
DYNLT3
|
dynein, light chain, Tctex-type 3
|
|
chr12_-_11439752
|
0.294
|
NM_006248
|
PRB1
PRB2
|
proline-rich protein BstNI subfamily 1
proline-rich protein BstNI subfamily 2
|
|
chr15_-_57452357
|
0.290
|
|
MYO1E
|
myosin IE
|
|
chr18_-_63333487
|
0.288
|
|
DSEL
|
dermatan sulfate epimerase-like
|
|
chr2_-_69033515
|
0.284
|
NM_182536
|
GKN2
|
gastrokine 2
|
|
chr3_+_189354167
|
0.280
|
NM_001167672
|
LPP
|
LIM domain containing preferred translocation partner in lipoma
|
|
chr3_-_124821868
|
0.277
|
|
MYLK
|
myosin light chain kinase
|
|
chr7_+_134114701
|
0.277
|
NM_004342
NM_033138
NM_033157
|
CALD1
|
caldesmon 1
|
|
chr20_-_21442663
|
0.276
|
NM_002509
|
NKX2-2
|
NK2 homeobox 2
|
|
chr18_-_42798364
|
0.274
|
NM_001100817
|
TCEB3C
TCEB3CL
|
transcription elongation factor B polypeptide 3C (elongin A3)
transcription elongation factor B polypeptide 3C-like
|
|
chr4_-_158111995
|
0.271
|
NM_016205
|
PDGFC
|
platelet derived growth factor C
|
|
chr2_-_31659472
|
0.270
|
NM_000348
|
SRD5A2
|
steroid-5-alpha-reductase, alpha polypeptide 2 (3-oxo-5 alpha-steroid delta 4-dehydrogenase alpha 2)
|
|
chr2_+_28469172
|
0.265
|
|
FOSL2
|
FOS-like antigen 2
|
|
chr2_+_84986273
|
0.265
|
NM_021103
|
TMSB10
|
thymosin beta 10
|
|
chr14_+_104338423
|
0.243
|
|
ZBTB42
|
zinc finger and BTB domain containing 42
|
|
chr4_-_88669267
|
0.238
|
|
SPARCL1
|
SPARC-like 1 (hevin)
|
|
chr7_+_94123672
|
0.237
|
|
PEG10
|
paternally expressed 10
|
|
chr4_+_156899575
|
0.237
|
NM_000857
|
GUCY1B3
|
guanylate cyclase 1, soluble, beta 3
|
|
chr19_-_50517971
|
0.237
|
|
CKM
|
creatine kinase, muscle
|
|
chr11_-_8982107
|
0.230
|
NM_020645
|
NRIP3
|
nuclear receptor interacting protein 3
|
|
chr17_-_77094426
|
0.229
|
|
ACTG1
|
actin, gamma 1
|
|
chr19_+_977627
|
0.227
|
|
CNN2
|
calponin 2
|
|
chr4_+_14985272
|
0.226
|
NM_001135171
|
C1QTNF7
|
C1q and tumor necrosis factor related protein 7
|
|
chr16_-_66535457
|
0.226
|
NM_000229
|
LCAT
|
lecithin-cholesterol acyltransferase
|
|
chr3_+_153014550
|
0.225
|
NM_001086
|
AADAC
|
arylacetamide deacetylase (esterase)
|
|
chr12_+_6884157
|
0.224
|
NM_001135217
NM_006992
NM_201650
|
LRRC23
|
leucine rich repeat containing 23
|
|
chr5_-_39461054
|
0.224
|
NM_001343
|
DAB2
|
disabled homolog 2, mitogen-responsive phosphoprotein (Drosophila)
|
|
chr15_-_68177244
|
0.223
|
|
TLE3
|
transducin-like enhancer of split 3 (E(sp1) homolog, Drosophila)
|
|
chr11_+_65945050
|
0.222
|
NM_178864
|
NPAS4
|
neuronal PAS domain protein 4
|
|
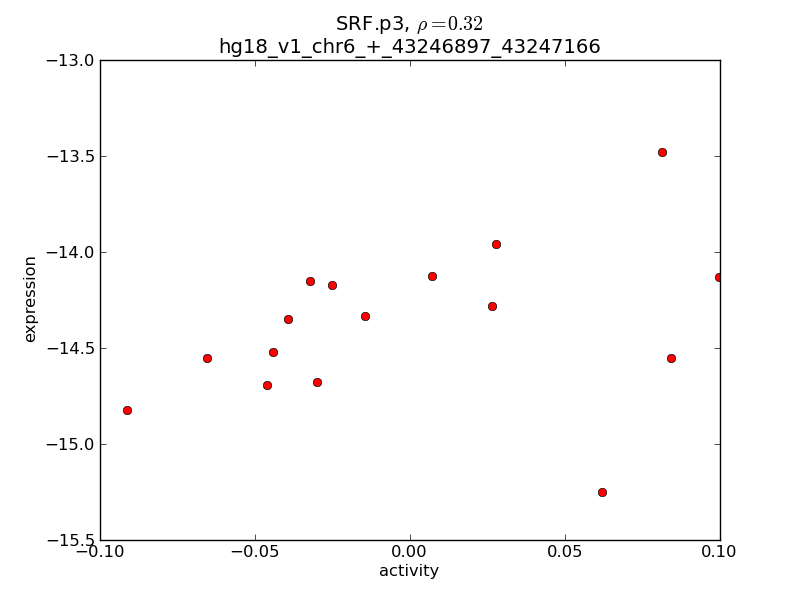
chr6_+_43246897
|
0.221
|
NM_003131
|
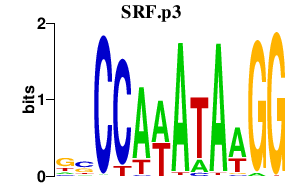
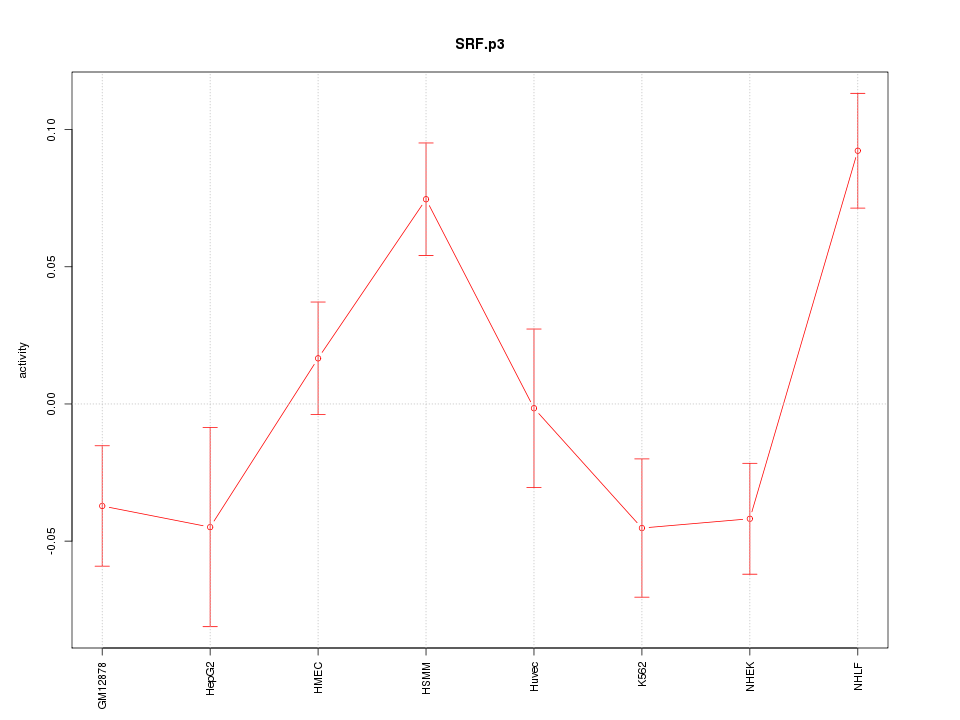
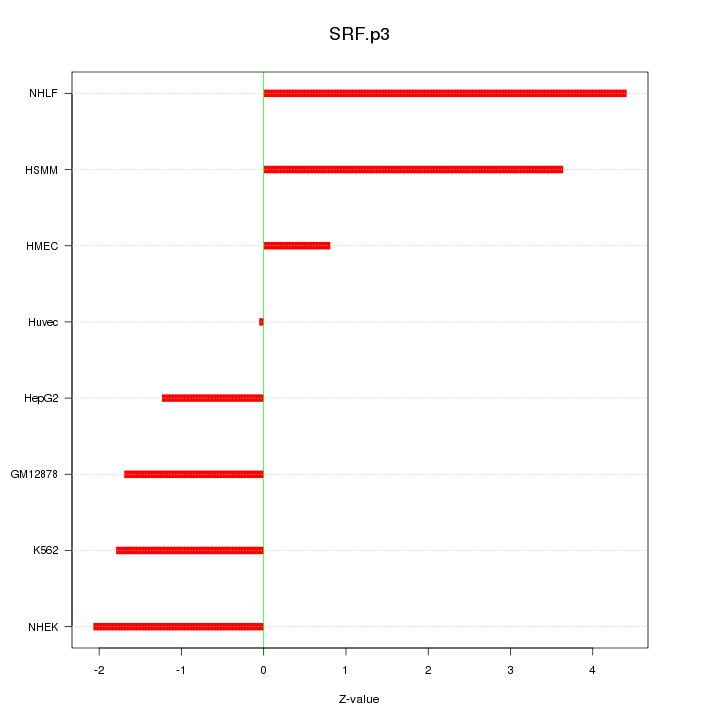
SRF
|
serum response factor (c-fos serum response element-binding transcription factor)
|
|
chr7_-_5535726
|
0.220
|
|
ACTB
|
actin, beta
|
|
chr3_+_62279707
|
0.217
|
|
C3orf14
|
chromosome 3 open reading frame 14
|
|
chr17_+_3326045
|
0.216
|
NM_000049
|
ASPA
|
aspartoacylase
|
|
chr14_-_104507862
|
0.216
|
|
AHNAK2
|
AHNAK nucleoprotein 2
|
|
chr5_+_88220846
|
0.212
|
|
|
|
|
chr14_+_62740878
|
0.212
|
NM_020663
|
RHOJ
|
ras homolog gene family, member J
|
|
chr2_-_73373956
|
0.211
|
NM_001965
|
EGR4
|
early growth response 4
|
|
chr17_+_38256710
|
0.210
|
NM_003734
|
AOC3
|
amine oxidase, copper containing 3 (vascular adhesion protein 1)
|
|
chr22_+_28206180
|
0.210
|
NM_021076
|
NEFH
|
neurofilament, heavy polypeptide
|
|
chr1_+_113064711
|
0.209
|
NM_001004440
NM_182759
|
FAM19A3
|
family with sequence similarity 19 (chemokine (C-C motif)-like), member A3
|
|
chr10_+_63950212
|
0.208
|
NM_199452
|
ZNF365
|
zinc finger protein 365
|
|
chr5_-_150264696
|
0.207
|
NM_001172831
NM_001172832
NM_052860
|
ZNF300
|
zinc finger protein 300
|
|
chr19_-_50518072
|
0.202
|
NM_001824
|
CKM
|
creatine kinase, muscle
|
|
chr8_+_24827173
|
0.202
|
NM_005382
|
NEFM
|
neurofilament, medium polypeptide
|
|
chr7_-_94123413
|
0.200
|
NM_001099400
NM_001099401
NM_003919
|
SGCE
|
sarcoglycan, epsilon
|
|
chr2_-_160972606
|
0.199
|
|
RBMS1
|
RNA binding motif, single stranded interacting protein 1
|
|
chr4_+_120276386
|
0.199
|
NM_016599
|
MYOZ2
|
myozenin 2
|
|
chr10_-_44794146
|
0.198
|
NM_007021
|
C10orf10
|
chromosome 10 open reading frame 10
|
|
chr2_-_96174865
|
0.193
|
NM_004418
|
DUSP2
|
dual specificity phosphatase 2
|
|
chr22_+_24468168
|
0.192
|
|
MYO18B
|
myosin XVIIIB
|
|
chr1_-_240228987
|
0.191
|
NM_001004343
|
MAP1LC3C
|
microtubule-associated protein 1 light chain 3 gamma
|
|
chr3_-_158695832
|
0.190
|
NM_001167917
|
VEPH1
|
ventricular zone expressed PH domain homolog 1 (zebrafish)
|
|
chr19_+_62566690
|
0.187
|
NM_173631
|
TRAPPC2P1
ZNF547
|
trafficking protein particle complex 2 pseudogene 1
zinc finger protein 547
|
|
chr10_+_6226884
|
0.187
|
|
PFKFB3
|
6-phosphofructo-2-kinase/fructose-2,6-biphosphatase 3
|