|
chr17_-_64568641
|
2.254
|
NM_080283
|
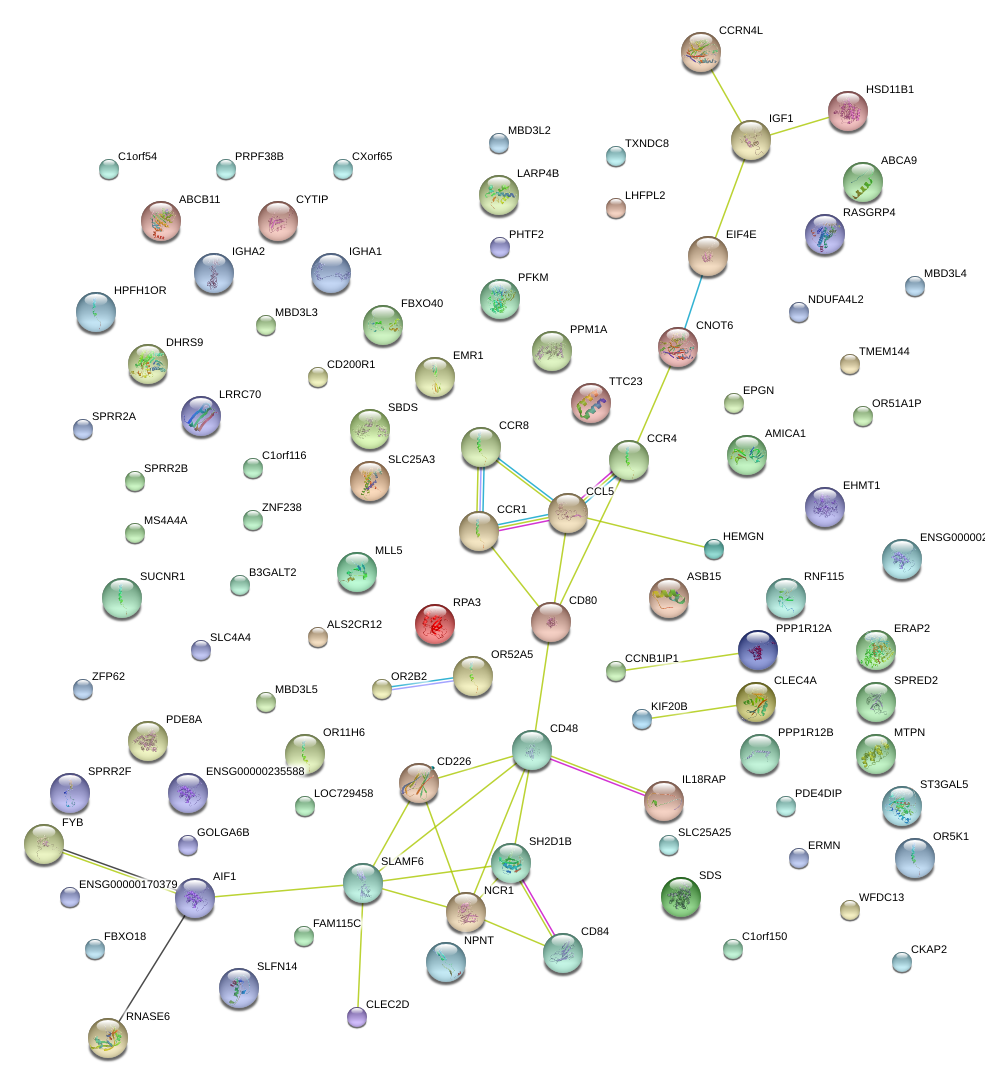
ABCA9
|
ATP-binding cassette, sub-family A (ABC1), member 9
|
|
chr2_-_157892391
|
2.181
|
NM_001009959
|
ERMN
|
ermin, ERM-like protein
|
|
chr10_+_5976354
|
1.975
|
NM_032807
|
FBXO18
|
F-box protein, helicase, 18
|
|
chr3_+_39346200
|
1.973
|
NM_005201
|
CCR8
|
chemokine (C-C motif) receptor 8
|
|
chr2_+_102401580
|
1.968
|
NM_003853
|
IL18RAP
|
interleukin 18 receptor accessory protein
|
|
chrX_-_70243362
|
1.880
|
NM_001025265
|
CXorf65
|
chromosome X open reading frame 65
|
|
chr18_-_65766068
|
1.870
|
|
CD226
|
CD226 molecule
|
|
chr1_-_158815895
|
1.817
|
NM_001184879
NM_001184881
NM_001184882
NM_003874
|
CD84
|
CD84 molecule
|
|
chr7_+_77307382
|
1.780
|
NM_001127357
NM_001127359
NM_020432
|
PHTF2
|
putative homeodomain transcription factor 2
|
|
chr7_-_135263737
|
1.769
|
|
MTPN
LUZP6
|
myotrophin
leucine zipper protein 6
|
|
chr1_-_158815850
|
1.672
|
|
CD84
|
CD84 molecule
|
|
chr11_-_5130174
|
1.628
|
NM_012375
|
OR52A1
|
olfactory receptor, family 52, subfamily A, member 1
|
|
chr5_-_39238818
|
1.535
|
|
FYB
|
FYN binding protein
|
|
chr3_+_32968069
|
1.475
|
NM_005508
|
CCR4
|
chemokine (C-C motif) receptor 4
|
|
chr9_+_139758336
|
1.463
|
|
EHMT1
|
euchromatic histone-lysine N-methyltransferase 1
|
|
chr6_+_31690957
|
1.440
|
NM_004847
NM_001623
|
AIF1
|
allograft inflammatory factor 1
|
|
chr4_+_75393053
|
1.439
|
NM_001013442
|
EPGN
|
epithelial mitogen homolog (mouse)
|
|
chr1_-_143708467
|
1.393
|
NM_001195260
|
PDE4DIP
|
phosphodiesterase 4D interacting protein
|
|
chr3_-_114176401
|
1.330
|
NM_138806
NM_138939
NM_138940
NM_170780
|
CD200R1
|
CD200 receptor 1
|
|
chr7_+_123036312
|
1.328
|
NM_080928
|
ASB15
|
ankyrin repeat and SOCS box containing 15
|
|
chr12_+_46802695
|
1.321
|
NM_001166687
NM_001166688
|
PFKM
|
phosphofructokinase, muscle
|
|
chr4_+_72423633
|
1.314
|
NM_003759
|
SLC4A4
|
solute carrier family 4, sodium bicarbonate cotransporter, member 4
|
|
chr19_-_43608641
|
1.280
|
NM_001146202
NM_001146203
NM_001146204
NM_001146205
NM_001146206
NM_001146207
NM_170604
|
RASGRP4
|
RAS guanyl releasing protein 4
|
|
chr3_+_153074118
|
1.267
|
NM_033050
|
SUCNR1
|
succinate receptor 1
|
|
chr3_-_46224791
|
1.250
|
NM_001295
|
CCR1
|
chemokine (C-C motif) receptor 1
|
|
chr11_-_117600918
|
1.248
|
NM_001098526
|
AMICA1
|
adhesion molecule, interacts with CXADR antigen 1
|
|
chr5_+_96237399
|
1.248
|
NM_001130140
NM_022350
|
ERAP2
|
endoplasmic reticulum aminopeptidase 2
|
|
chr1_+_148511806
|
1.247
|
NM_024579
|
C1orf54
|
chromosome 1 open reading frame 54
|
|
chr7_+_143043871
|
1.205
|
NM_001130026
|
FAM115C
|
family with sequence similarity 115, member C
|
|
chr2_-_64944214
|
1.156
|
|
|
|
|
chr1_+_242283129
|
1.153
|
NM_006352
|
ZNF238
|
zinc finger protein 238
|
|
chr12_+_9713472
|
1.146
|
NM_001197318
NM_013269
NM_001004419
NM_001197317
NM_001197319
|
CLEC2D
|
C-type lectin domain family 2, member D
|
|
chr9_-_112139908
|
1.145
|
NM_001003936
|
TXNDC8
|
thioredoxin domain containing 8 (spermatozoa)
|
|
chr14_+_19761708
|
1.139
|
NM_001004480
|
OR11H6
|
olfactory receptor, family 11, subfamily H, member 6
|
|
chr1_-_160648429
|
1.132
|
NM_053282
|
SH2D1B
|
SH2 domain containing 1B
|
|
chr3_-_120761092
|
1.129
|
NM_005191
|
CD80
|
CD80 molecule
|
|
chr4_-_100070808
|
1.073
|
NM_001130679
NM_001968
|
EIF4E
|
eukaryotic translation initiation factor 4E
|
|
chr3_+_122794859
|
1.071
|
NM_016298
|
FBXO40
|
F-box protein 40
|
|
chr7_-_7724762
|
1.063
|
NM_002947
|
RPA3
|
replication protein A3, 14kDa
|
|
chr11_+_59804634
|
1.060
|
NM_148975
|
MS4A4A
|
membrane-spanning 4-domains, subfamily A, member 4
|
|
chr6_-_27988152
|
1.060
|
NM_033057
|
OR2B2
|
olfactory receptor, family 2, subfamily B, member 2
|
|
chr1_-_158948176
|
1.049
|
NM_001778
|
CD48
|
CD48 molecule
|
|
chr2_-_65447267
|
1.048
|
|
SPRED2
|
sprouty-related, EVH1 domain containing 2
|
|
chr14_-_106249999
|
1.027
|
|
IGHA1
|
immunoglobulin heavy constant alpha 1
|
|
chr7_+_104468614
|
1.020
|
|
MLL5
|
myeloid/lymphoid or mixed-lineage leukemia 5 (trithorax homolog, Drosophila)
|
|
chr10_-_921694
|
1.017
|
NM_015155
|
LARP4B
|
La ribonucleoprotein domain family, member 4B
|
|
chr1_-_158759606
|
1.017
|
NM_001184714
NM_001184715
NM_001184716
NM_052931
|
SLAMF6
|
SLAM family member 6
|
|
chr14_+_59782222
|
1.015
|
NM_177952
|
PPM1A
|
protein phosphatase, Mg2+/Mn2+ dependent, 1A
|
|
chr17_-_30909219
|
1.008
|
NM_001129820
|
SLFN14
|
schlafen family member 14
|
|
chr2_-_85948287
|
1.004
|
NM_001042437
|
ST3GAL5
|
ST3 beta-galactoside alpha-2,3-sialyltransferase 5
|
|
chr2_-_169596078
|
1.002
|
NM_003742
|
ABCB11
|
ATP-binding cassette, sub-family B (MDR/TAP), member 11
|
|
chr5_+_61910318
|
1.001
|
NM_181506
|
LRRC70
|
leucine rich repeat containing 70
|
|
chr4_+_159350850
|
1.001
|
NM_018342
|
TMEM144
|
transmembrane protein 144
|
|
chr19_+_6838576
|
0.994
|
NM_001974
|
EMR1
|
egf-like module containing, mucin-like, hormone receptor-like 1
|
|
chr2_+_169637255
|
0.994
|
NM_001142270
|
DHRS9
|
dehydrogenase/reductase (SDR family) member 9
|
|
chr5_-_77880731
|
0.988
|
|
LHFPL2
|
lipoma HMGIC fusion partner-like 2
|
|
chr17_-_31231421
|
0.983
|
NM_002985
|
CCL5
|
chemokine (C-C motif) ligand 5
|
|
chr12_-_101396459
|
0.971
|
NM_001111284
|
IGF1
|
insulin-like growth factor 1 (somatomedin C)
|
|
chr19_+_60109319
|
0.970
|
NM_001145457
NM_001145458
NM_004829
|
NCR1
|
natural cytotoxicity triggering receptor 1
|
|
chr3_-_42818221
|
0.969
|
|
|
|
|
chr15_-_97607108
|
0.965
|
NM_001040655
NM_001040656
NM_001040657
NM_001040658
NM_001040659
NM_001040660
NM_022905
|
TTC23
|
tetratricopeptide repeat domain 23
|
|
chr1_+_207944807
|
0.965
|
NM_005525
|
HSD11B1
|
hydroxysteroid (11-beta) dehydrogenase 1
|
|
chr2_-_201930311
|
0.962
|
NM_001127391
NM_139163
|
ALS2CR12
|
amyotrophic lateral sclerosis 2 (juvenile) chromosome region, candidate 12
|
|
chr10_+_91488704
|
0.959
|
|
KIF20B
|
kinesin family member 20B
|
|
chr9_+_129893948
|
0.954
|
NM_001006642
|
SLC25A25
|
solute carrier family 25 (mitochondrial carrier; phosphate carrier), member 25
|
|
chr12_+_8167494
|
0.948
|
NM_016184
NM_194447
NM_194448
NM_194450
|
CLEC4A
|
C-type lectin domain family 4, member A
|
|
chr9_-_99740243
|
0.944
|
NM_197978
|
HEMGN
|
hemogen
|
|
chr12_-_112326037
|
0.922
|
NM_006843
|
SDS
|
serine dehydratase
|
|
chr1_-_191422346
|
0.919
|
NM_003783
|
B3GALT2
|
UDP-Gal:betaGlcNAc beta 1,3-galactosyltransferase, polypeptide 2
|
|
chr1_+_200698493
|
0.919
|
NM_032103
NM_032104
|
PPP1R12B
|
protein phosphatase 1, regulatory (inhibitor) subunit 12B
|
|
chr7_+_21434818
|
0.916
|
|
|
|
|
chr14_-_19867372
|
0.913
|
NM_182852
NM_182851
|
CCNB1IP1
|
cyclin B1 interacting protein 1, E3 ubiquitin protein ligase
|
|
chr20_+_43764068
|
0.912
|
NM_172005
|
WFDC13
|
WAP four-disulfide core domain 13
|
|
chr2_-_158008763
|
0.896
|
NM_004288
|
CYTIP
|
cytohesin 1 interacting protein
|
|
chr12_+_97513644
|
0.888
|
|
SLC25A3
|
solute carrier family 25 (mitochondrial carrier; phosphate carrier), member 3
|
|
chr13_+_51933228
|
0.885
|
|
CKAP2
|
cytoskeleton associated protein 2
|
|
chr1_-_151352587
|
0.885
|
NM_001014450
|
SPRR2A
SPRR2F
|
small proline-rich protein 2A
small proline-rich protein 2F
|
|
chr20_-_30703219
|
0.885
|
NM_182584
|
C20orf203
|
chromosome 20 open reading frame 203
|
|
chr12_-_78831821
|
0.882
|
NM_001143886
|
PPP1R12A
|
protein phosphatase 1, regulatory (inhibitor) subunit 12A
|
|
chr1_+_109043550
|
0.875
|
|
PRPF38B
|
PRP38 pre-mRNA processing factor 38 (yeast) domain containing B
|
|
chr14_+_20319049
|
0.874
|
NM_005615
|
RNASE6
|
ribonuclease, RNase A family, k6
|
|
chr15_+_83467295
|
0.860
|
|
PDE8A
|
phosphodiesterase 8A
|
|
chr11_-_5110383
|
0.857
|
NM_001005160
|
OR52A5
|
olfactory receptor, family 52, subfamily A, member 5
|
|
chr19_-_7009644
|
0.856
|
NM_001164425
|
MBD3L3
|
methyl-CpG-binding domain protein 3-like 3-like
|
|
chr1_+_144374513
|
0.847
|
|
RNF115
|
ring finger protein 115
|
|
chr1_+_245779018
|
0.845
|
NM_145278
|
C1orf150
|
chromosome 1 open reading frame 150
|
|
chr4_+_100714995
|
0.834
|
|
MTTP
|
microsomal triglyceride transfer protein
|
|
chr1_+_173111306
|
0.833
|
NM_001035230
|
RABGAP1L
|
RAB GTPase activating protein 1-like
|
|
chr1_+_205068844
|
0.832
|
NM_013371
|
IL19
|
interleukin 19
|
|
chr18_-_27594696
|
0.827
|
NM_001034172
|
MCART2
|
mitochondrial carrier triple repeat 2
|
|
chr3_+_46386636
|
0.823
|
NM_000579
NM_001100168
|
CCR5
|
chemokine (C-C motif) receptor 5
|
|
chr7_+_116447499
|
0.822
|
|
ST7
|
suppression of tumorigenicity 7
|
|
chr1_-_171838802
|
0.821
|
NM_178527
|
SLC9A11
|
solute carrier family 9, member 11
|
|
chr15_-_41195994
|
0.817
|
|
RPS3A
|
ribosomal protein S3A
|
|
chr20_-_45410033
|
0.816
|
|
ZMYND8
|
zinc finger, MYND-type containing 8
|
|
chr12_-_642786
|
0.813
|
NM_016533
|
NINJ2
|
ninjurin 2
|
|
chr3_+_3056307
|
0.807
|
NM_175612
|
CNTN4
|
contactin 4
|
|
chr12_-_53661888
|
0.806
|
NM_001098815
|
KIAA0748
|
KIAA0748
|
|
chr1_-_165326148
|
0.806
|
NM_005814
|
GPA33
|
glycoprotein A33 (transmembrane)
|
|
chr2_+_169645862
|
0.804
|
NM_001142271
|
DHRS9
|
dehydrogenase/reductase (SDR family) member 9
|
|
chr15_-_70350609
|
0.795
|
NM_020214
|
PARP6
|
poly (ADP-ribose) polymerase family, member 6
|
|
chrX_-_138742050
|
0.795
|
NM_001010986
NM_173694
|
ATP11C
|
ATPase, class VI, type 11C
|
|
chr12_-_9777126
|
0.794
|
NM_172004
|
CLECL1
|
C-type lectin-like 1
|
|
chr1_+_116727514
|
0.783
|
NM_001160234
|
ATP1A1
|
ATPase, Na+/K+ transporting, alpha 1 polypeptide
|
|
chr7_+_116447527
|
0.782
|
|
ST7
|
suppression of tumorigenicity 7
|
|
chr6_+_31081707
|
0.779
|
NM_001198815
|
PBMUCL1
|
panbronchiolitis related mucin-like 1
|
|
chr8_-_95298706
|
0.772
|
NM_001144663
|
CDH17
|
cadherin 17, LI cadherin (liver-intestine)
|
|
chr8_+_107529327
|
0.771
|
NM_001198532
|
OXR1
|
oxidation resistance 1
|
|
chr3_-_152585226
|
0.768
|
NM_022788
|
P2RY12
|
purinergic receptor P2Y, G-protein coupled, 12
|
|
chr5_-_147996769
|
0.766
|
NM_001040169
NM_001040172
NM_001040173
NM_199453
|
HTR4
|
5-hydroxytryptamine (serotonin) receptor 4
|
|
chr2_-_37228452
|
0.764
|
NM_001135652
|
EIF2AK2
|
eukaryotic translation initiation factor 2-alpha kinase 2
|
|
chr20_-_55628852
|
0.762
|
NM_001160417
NM_001160418
NM_001160419
NM_030776
|
ZBP1
|
Z-DNA binding protein 1
|
|
chr5_+_69356827
|
0.761
|
NM_001178087
NM_022978
NM_021967
NM_022968
|
SERF1B
SERF1A
|
small EDRK-rich factor 1B (centromeric)
small EDRK-rich factor 1A (telomeric)
|
|
chr1_+_239762179
|
0.760
|
NM_003679
|
KMO
|
kynurenine 3-monooxygenase (kynurenine 3-hydroxylase)
|
|
chr7_-_107930170
|
0.759
|
|
PNPLA8
|
patatin-like phospholipase domain containing 8
|
|
chr16_+_33168191
|
0.757
|
NM_001099687
|
TP53TG3B
|
TP53 target 3B
|
|
chr9_+_6318348
|
0.757
|
NM_001001874
NM_001001875
NM_033516
|
TPD52L3
|
tumor protein D52-like 3
|
|
chr2_-_65447370
|
0.754
|
NM_001128210
|
SPRED2
|
sprouty-related, EVH1 domain containing 2
|
|
chr14_+_59934178
|
0.753
|
|
|
|
|
chr16_-_32596378
|
0.752
|
NM_001099687
|
TP53TG3B
|
TP53 target 3B
|
|
chr5_-_88155360
|
0.749
|
NM_001193348
NM_001193349
|
MEF2C
|
myocyte enhancer factor 2C
|
|
chr3_+_123526700
|
0.739
|
NM_005213
|
CSTA
|
cystatin A (stefin A)
|
|
chr1_-_151296611
|
0.733
|
NM_005988
|
SPRR2A
|
small proline-rich protein 2A
|
|
chr3_-_195670256
|
0.730
|
NM_024524
|
ATP13A3
|
ATPase type 13A3
|
|
chr12_-_8110268
|
0.729
|
|
C3AR1
|
complement component 3a receptor 1
|
|
chr10_-_50066386
|
0.727
|
NM_001010863
|
C10orf128
|
chromosome 10 open reading frame 128
|
|
chr10_+_89257569
|
0.727
|
NM_001178118
|
MINPP1
|
multiple inositol-polyphosphate phosphatase 1
|
|
chrX_+_118598325
|
0.726
|
NM_181777
|
UBE2A
|
ubiquitin-conjugating enzyme E2A (RAD6 homolog)
|
|
chr8_-_82557956
|
0.721
|
NM_001442
|
FABP4
|
fatty acid binding protein 4, adipocyte
|
|
chr2_-_175170674
|
0.720
|
|
WIPF1
|
WAS/WASL interacting protein family, member 1
|
|
chr3_-_152517204
|
0.717
|
NM_023915
|
GPR87
|
G protein-coupled receptor 87
|
|
chr12_-_8110196
|
0.705
|
NM_004054
|
C3AR1
|
complement component 3a receptor 1
|
|
chr12_-_120270035
|
0.705
|
|
ANAPC5
|
anaphase promoting complex subunit 5
|
|
chr19_-_60528480
|
0.701
|
NM_001085488
|
TMEM150B
|
transmembrane protein 150B
|
|
chr8_-_38324809
|
0.701
|
|
WHSC1L1
|
Wolf-Hirschhorn syndrome candidate 1-like 1
|
|
chr13_+_108079570
|
0.697
|
NM_001198950
|
MYO16
|
myosin XVI
|
|
chr7_+_73826244
|
0.694
|
NM_000265
|
NCF1
NCF1B
NCF1C
|
neutrophil cytosolic factor 1
neutrophil cytosolic factor 1B pseudogene
neutrophil cytosolic factor 1C pseudogene
|
|
chr15_-_48626193
|
0.691
|
NM_203494
|
USP50
|
ubiquitin specific peptidase 50
|
|
chr6_+_16251260
|
0.688
|
|
MYLIP
|
myosin regulatory light chain interacting protein
|
|
chr6_-_76259976
|
0.687
|
NM_015687
|
FILIP1
|
filamin A interacting protein 1
|
|
chr4_+_71806538
|
0.683
|
NM_001037442
NM_014961
|
RUFY3
|
RUN and FYVE domain containing 3
|
|
chr11_+_67133502
|
0.680
|
|
NDUFV1
|
NADH dehydrogenase (ubiquinone) flavoprotein 1, 51kDa
|
|
chr12_+_21570457
|
0.680
|
NM_030572
|
C12orf39
|
chromosome 12 open reading frame 39
|
|
chr1_+_156526182
|
0.679
|
NM_001765
|
CD1C
|
CD1c molecule
|
|
chr12_+_9871343
|
0.678
|
NM_016523
|
KLRF1
|
killer cell lectin-like receptor subfamily F, member 1
|
|
chr7_+_64136078
|
0.674
|
|
CCT6P3
|
chaperonin containing TCP1, subunit 6 (zeta) pseudogene 3
|
|
chr1_+_557269
|
0.673
|
|
|
|
|
chr2_+_161701711
|
0.672
|
NM_004180
NM_133484
|
TANK
|
TRAF family member-associated NFKB activator
|
|
chr6_+_37511383
|
0.667
|
|
|
|
|
chr9_-_21132143
|
0.666
|
NM_002177
|
IFNW1
|
interferon, omega 1
|
|
chr17_+_28342994
|
0.664
|
NM_173847
|
SPACA3
|
sperm acrosome associated 3
|
|
chrX_-_119593646
|
0.664
|
NM_003588
|
CUL4B
|
cullin 4B
|
|
chr6_-_53034445
|
0.663
|
|
ICK
|
intestinal cell (MAK-like) kinase
|
|
chr11_+_10433241
|
0.657
|
NM_001025389
|
AMPD3
|
adenosine monophosphate deaminase 3
|
|
chr7_+_115650240
|
0.654
|
NM_152829
|
TES
|
testis derived transcript (3 LIM domains)
|
|
chr7_-_132371208
|
0.650
|
|
EEF1G
|
eukaryotic translation elongation factor 1 gamma
|
|
chr1_+_109043711
|
0.648
|
|
PRPF38B
|
PRP38 pre-mRNA processing factor 38 (yeast) domain containing B
|
|
chr8_+_107807415
|
0.648
|
NM_001198534
NM_001198535
|
OXR1
|
oxidation resistance 1
|
|
chr1_+_234624266
|
0.647
|
NM_145861
|
EDARADD
|
EDAR-associated death domain
|
|
chr21_-_34820916
|
0.646
|
NM_203418
|
RCAN1
|
regulator of calcineurin 1
|
|
chr1_+_84539876
|
0.646
|
NM_001134663
|
SAMD13
|
sterile alpha motif domain containing 13
|
|
chr19_-_14750347
|
0.646
|
NM_013447
NM_152916
NM_152917
NM_152918
NM_152919
NM_152920
NM_152921
|
EMR2
|
egf-like module containing, mucin-like, hormone receptor-like 2
|
|
chr10_+_35524060
|
0.646
|
NM_182717
NM_182718
NM_182719
NM_182720
|
CREM
|
cAMP responsive element modulator
|
|
chr9_-_85773899
|
0.640
|
|
HNRNPK
|
heterogeneous nuclear ribonucleoprotein K
|
|
chr3_+_142587973
|
0.636
|
|
|
|
|
chr19_+_14554895
|
0.635
|
NM_207390
|
CLEC17A
|
C-type lectin domain family 17, member A
|
|
chr5_-_160211623
|
0.634
|
NM_025153
|
ATP10B
|
ATPase, class V, type 10B
|
|
chr19_-_16111594
|
0.633
|
|
|
|
|
chr1_-_202726068
|
0.629
|
NM_002646
|
PIK3C2B
|
phosphoinositide-3-kinase, class 2, beta polypeptide
|
|
chr7_+_28692122
|
0.625
|
NM_001011666
|
CREB5
|
cAMP responsive element binding protein 5
|
|
chr3_+_171112053
|
0.625
|
NM_182610
|
SAMD7
|
sterile alpha motif domain containing 7
|
|
chr13_-_48873735
|
0.619
|
NM_030925
|
CAB39L
|
calcium binding protein 39-like
|
|
chr10_+_74323344
|
0.616
|
NM_152635
|
OIT3
|
oncoprotein induced transcript 3
|
|
chr6_+_31662454
|
0.616
|
NM_205837
|
LST1
|
leukocyte specific transcript 1
|
|
chr6_+_134800533
|
0.614
|
|
LOC154092
|
hypothetical LOC154092
|
|
chr17_-_36232366
|
0.614
|
NM_000421
|
KRT10
|
keratin 10
|
|
chr1_+_40635058
|
0.613
|
NM_001198980
|
SMAP2
|
small ArfGAP2
|
|
chr7_-_143085704
|
0.611
|
NM_178561
|
CTAGE6P
|
CTAGE family, member 6, pseudogene
|
|
chr2_+_114390975
|
0.610
|
|
ACTR3
|
ARP3 actin-related protein 3 homolog (yeast)
|
|
chr8_+_24297742
|
0.605
|
NM_001145271
NM_001145272
NM_014479
|
ADAMDEC1
|
ADAM-like, decysin 1
|
|
chr3_+_38282301
|
0.599
|
NM_004256
|
SLC22A13
|
solute carrier family 22 (organic anion transporter), member 13
|
|
chr15_+_65217412
|
0.598
|
NM_001145103
|
SMAD3
|
SMAD family member 3
|
|
chr4_+_100957003
|
0.598
|
NM_014395
|
DAPP1
|
dual adaptor of phosphotyrosine and 3-phosphoinositides
|
|
chr19_-_16111695
|
0.598
|
|
|
|
|
chr22_-_39189369
|
0.597
|
|
MKL1
|
megakaryoblastic leukemia (translocation) 1
|
|
chr6_+_27215039
|
0.595
|
NM_003495
|
HIST1H4I
|
histone cluster 1, H4i
|
|
chr7_-_139948780
|
0.594
|
NM_015689
|
DENND2A
|
DENN/MADD domain containing 2A
|
|
chr1_-_21310462
|
0.593
|
NM_003760
|
EIF4G3
|
eukaryotic translation initiation factor 4 gamma, 3
|
|
chr14_-_106064887
|
0.588
|
|
LOC100126583
IGHV3-48
IGHA1
IGHM
|
hypothetical LOC100126583
immunoglobulin heavy variable 3-48
immunoglobulin heavy constant alpha 1
immunoglobulin heavy constant mu
|
|
chr22_-_39587944
|
0.587
|
NM_145174
|
DNAJB7
|
DnaJ (Hsp40) homolog, subfamily B, member 7
|
|
chr7_-_92615593
|
0.584
|
NM_152703
|
SAMD9L
|
sterile alpha motif domain containing 9-like
|
|
chr19_-_3013880
|
0.583
|
NM_198969
|
AES
|
amino-terminal enhancer of split
|
|
chr20_-_23014828
|
0.582
|
NM_012072
|
CD93
|
CD93 molecule
|
|
chr6_+_31782618
|
0.582
|
NM_001003693
|
LY6G6F
|
lymphocyte antigen 6 complex, locus G6F
|
|
chr19_+_61624
|
0.581
|
NM_001005240
|
OR4F4
OR4F17
|
olfactory receptor, family 4, subfamily F, member 4
olfactory receptor, family 4, subfamily F, member 17
|
|
chr7_+_150013716
|
0.581
|
NM_015660
|
GIMAP2
|
GTPase, IMAP family member 2
|
|
chr4_-_151993422
|
0.577
|
|
|
|
|
chr19_+_52532210
|
0.577
|
NM_018485
|
GPR77
|
G protein-coupled receptor 77
|
|
chr5_-_71838875
|
0.576
|
NM_152625
|
ZNF366
|
zinc finger protein 366
|
|
chr14_-_30927931
|
0.574
|
NM_015473
|
HEATR5A
|
HEAT repeat containing 5A
|