|
chr4_+_74566325
|
32.045
|
NM_001133
|
AFM
|
afamin
|
|
chr10_+_44726635
|
18.923
|
NM_001123376
|
TMEM72
|
transmembrane protein 72
|
|
chr6_-_24491498
|
18.251
|
NM_001195610
|
DCDC2
|
doublecortin domain containing 2
|
|
chr14_+_94097513
|
18.027
|
NM_006215
|
SERPINA4
|
serpin peptidase inhibitor, clade A (alpha-1 antiproteinase, antitrypsin), member 4
|
|
chr14_+_20226762
|
17.841
|
NM_001097577
NM_194431
|
ANG
RNASE4
|
angiogenin, ribonuclease, RNase A family, 5
ribonuclease, RNase A family, 4
|
|
chr10_+_114144512
|
17.547
|
|
ACSL5
|
acyl-CoA synthetase long-chain family member 5
|
|
chr1_+_205344200
|
17.108
|
NM_000715
|
C4BPA
|
complement component 4 binding protein, alpha
|
|
chr19_+_11211282
|
16.907
|
NM_018687
|
LOC55908
|
hepatocellular carcinoma-associated gene TD26
|
|
chr17_+_38306339
|
16.074
|
NM_000151
|
G6PC
|
glucose-6-phosphatase, catalytic subunit
|
|
chr17_+_71065478
|
15.923
|
|
LLGL2
|
lethal giant larvae homolog 2 (Drosophila)
|
|
chr4_-_155731288
|
15.408
|
NM_000508
NM_021871
|
FGA
|
fibrinogen alpha chain
|
|
chr1_+_48460943
|
15.011
|
NM_001011547
NM_001135181
|
SLC5A9
|
solute carrier family 5 (sodium/glucose cotransporter), member 9
|
|
chr1_-_20014180
|
14.790
|
NM_019062
|
RNF186
|
ring finger protein 186
|
|
chr15_-_88150823
|
14.539
|
|
ANPEP
|
alanyl (membrane) aminopeptidase
|
|
chr7_-_50600536
|
14.048
|
NM_001082971
|
DDC
|
dopa decarboxylase (aromatic L-amino acid decarboxylase)
|
|
chr16_-_67943157
|
14.028
|
NM_144676
|
TMED6
|
transmembrane emp24 protein transport domain containing 6
|
|
chr20_+_41621119
|
13.917
|
|
SGK2
|
serum/glucocorticoid regulated kinase 2
|
|
chr3_+_142525744
|
13.866
|
NM_001080412
|
ZBTB38
|
zinc finger and BTB domain containing 38
|
|
chr20_+_41621079
|
13.101
|
NM_170693
|
SGK2
|
serum/glucocorticoid regulated kinase 2
|
|
chr21_-_46399900
|
12.848
|
NM_006657
NM_206965
|
FTCD
|
formiminotransferase cyclodeaminase
|
|
chrX_-_105169370
|
12.823
|
NM_000354
|
SERPINA7
|
serpin peptidase inhibitor, clade A (alpha-1 antiproteinase, antitrypsin), member 7
|
|
chr7_-_44547382
|
12.652
|
NM_001101648
NM_013389
|
NPC1L1
|
NPC1 (Niemann-Pick disease, type C1, gene)-like 1
|
|
chr4_+_155703581
|
12.616
|
NM_001184741
NM_005141
|
FGB
|
fibrinogen beta chain
|
|
chr16_+_21152516
|
12.364
|
NM_145865
|
ANKS4B
|
ankyrin repeat and sterile alpha motif domain containing 4B
|
|
chr14_-_93924873
|
12.231
|
NM_000295
|
SERPINA1
|
serpin peptidase inhibitor, clade A (alpha-1 antiproteinase, antitrypsin), member 1
|
|
chr11_-_64582568
|
11.988
|
NM_005468
|
NAALADL1
|
N-acetylated alpha-linked acidic dipeptidase-like 1
|
|
chr16_-_46826588
|
11.893
|
NM_032583
NM_145186
|
ABCC11
|
ATP-binding cassette, sub-family C (CFTR/MRP), member 11
|
|
chr8_-_17797127
|
11.582
|
NM_147203
NM_201553
NM_004467
NM_201552
|
FGL1
|
fibrinogen-like 1
|
|
chr6_+_167624792
|
11.526
|
NM_001143947
NM_018974
|
UNC93A
|
unc-93 homolog A (C. elegans)
|
|
chr20_+_42417752
|
11.160
|
NM_001030003
NM_001030004
NM_175914
|
HNF4A
|
hepatocyte nuclear factor 4, alpha
|
|
chr6_+_31731667
|
11.067
|
|
APOM
|
apolipoprotein M
|
|
chr16_-_65510230
|
11.011
|
NM_004062
|
CDH16
|
cadherin 16, KSP-cadherin
|
|
chr1_-_195302973
|
10.967
|
NM_001994
|
F13B
|
coagulation factor XIII, B polypeptide
|
|
chr4_+_74520796
|
10.774
|
NM_001134
|
AFP
|
alpha-fetoprotein
|
|
chr6_+_31731647
|
10.664
|
NM_019101
|
APOM
|
apolipoprotein M
|
|
chr20_+_42417502
|
10.640
|
|
HNF4A
|
hepatocyte nuclear factor 4, alpha
|
|
chr11_-_62539857
|
10.617
|
NM_001184732
NM_001184733
NM_001184736
NM_004254
|
SLC22A8
|
solute carrier family 22 (organic anion transporter), member 8
|
|
chr14_-_93924663
|
10.587
|
|
SERPINA1
|
serpin peptidase inhibitor, clade A (alpha-1 antiproteinase, antitrypsin), member 1
|
|
chr10_+_99334411
|
10.526
|
|
HOGA1
|
4-hydroxy-2-oxoglutarate aldolase 1
|
|
chr19_-_63556632
|
10.490
|
NM_130786
|
A1BG
|
alpha-1-B glycoprotein
|
|
chr6_-_26038817
|
10.402
|
NM_005835
|
SLC17A2
|
solute carrier family 17 (sodium phosphate), member 2
|
|
chr14_-_93829347
|
10.401
|
NM_001100607
|
SERPINA10
|
serpin peptidase inhibitor, clade A (alpha-1 antiproteinase, antitrypsin), member 10
|
|
chr20_+_42463279
|
10.373
|
NM_000457
NM_178849
NM_178850
|
HNF4A
|
hepatocyte nuclear factor 4, alpha
|
|
chr4_-_186970366
|
10.226
|
NM_003603
NM_001145670
|
SORBS2
|
sorbin and SH3 domain containing 2
|
|
chr14_-_93829309
|
10.163
|
|
SERPINA10
|
serpin peptidase inhibitor, clade A (alpha-1 antiproteinase, antitrypsin), member 10
|
|
chr17_+_71154240
|
9.991
|
NM_001162997
|
LOC100130933
|
hypothetical protein LOC100130933
|
|
chr6_+_167456230
|
9.766
|
NM_031409
|
CCR6
|
chemokine (C-C motif) receptor 6
|
|
chr20_+_42463350
|
9.733
|
|
HNF4A
|
hepatocyte nuclear factor 4, alpha
|
|
chr1_+_17779528
|
9.721
|
NM_001011722
|
ARHGEF10L
|
Rho guanine nucleotide exchange factor (GEF) 10-like
|
|
chr5_+_175908948
|
9.718
|
NM_017675
|
CDHR2
|
cadherin-related family member 2
|
|
chr8_+_21967008
|
9.709
|
NM_001114137
|
EPB49
|
erythrocyte membrane protein band 4.9 (dematin)
|
|
chr6_+_64289585
|
9.571
|
|
PTP4A1
|
protein tyrosine phosphatase type IVA, member 1
|
|
chr1_+_18680010
|
9.485
|
NM_152375
|
KLHDC7A
|
kelch domain containing 7A
|
|
chr14_-_93829113
|
9.474
|
NM_016186
|
SERPINA10
|
serpin peptidase inhibitor, clade A (alpha-1 antiproteinase, antitrypsin), member 10
|
|
chr2_-_88208650
|
9.457
|
NM_001443
|
FABP1
|
fatty acid binding protein 1, liver
|
|
chr6_-_52060327
|
9.441
|
NM_138694
NM_170724
|
PKHD1
|
polycystic kidney and hepatic disease 1 (autosomal recessive)
|
|
chr20_+_42463419
|
9.400
|
|
HNF4A
|
hepatocyte nuclear factor 4, alpha
|
|
chr4_-_69852090
|
9.297
|
NM_024743
|
UGT2A3
|
UDP glucuronosyltransferase 2 family, polypeptide A3
|
|
chr14_+_38772870
|
9.231
|
NM_054024
|
MIA2
|
melanoma inhibitory activity 2
|
|
chr20_+_42463387
|
9.161
|
|
HNF4A
|
hepatocyte nuclear factor 4, alpha
|
|
chr17_-_61655915
|
9.044
|
NM_000042
|
APOH
|
apolipoprotein H (beta-2-glycoprotein I)
|
|
chr9_-_122852356
|
8.869
|
NM_001735
|
C5
|
complement component 5
|
|
chr14_+_54238581
|
8.783
|
|
SAMD4A
|
sterile alpha motif domain containing 4A
|
|
chr16_+_88224276
|
8.457
|
|
DPEP1
|
dipeptidase 1 (renal)
|
|
chr14_-_57030227
|
8.310
|
NM_018168
|
C14orf105
|
chromosome 14 open reading frame 105
|
|
chr2_+_27573206
|
8.228
|
NM_001486
|
GCKR
|
glucokinase (hexokinase 4) regulator
|
|
chr6_-_52736231
|
8.186
|
NM_000846
|
GSTA2
|
glutathione S-transferase alpha 2
|
|
chr4_+_3413489
|
8.082
|
NM_001528
|
HGFAC
|
HGF activator
|
|
chr12_-_15757114
|
8.011
|
|
EPS8
|
epidermal growth factor receptor pathway substrate 8
|
|
chr4_-_100359353
|
7.686
|
NM_000672
NM_001102470
|
ADH6
|
alcohol dehydrogenase 6 (class V)
|
|
chr4_+_3413457
|
7.662
|
|
HGFAC
|
HGF activator
|
|
chr20_-_7869068
|
7.623
|
NM_017545
|
HAO1
|
hydroxyacid oxidase (glycolate oxidase) 1
|
|
chr16_+_88224175
|
7.575
|
|
DPEP1
|
dipeptidase 1 (renal)
|
|
chr3_+_187866464
|
7.477
|
NM_000412
|
HRG
|
histidine-rich glycoprotein
|
|
chr14_-_93859394
|
7.456
|
NM_001756
|
SERPINA6
|
serpin peptidase inhibitor, clade A (alpha-1 antiproteinase, antitrypsin), member 6
|
|
chr12_+_54910767
|
7.380
|
NM_001135195
|
SLC39A5
|
solute carrier family 39 (metal ion transporter), member 5
|
|
chr8_-_124818754
|
7.291
|
NM_001003954
NM_004306
|
ANXA13
|
annexin A13
|
|
chr17_+_1592879
|
7.225
|
NM_000934
NM_001165921
|
SERPINF2
|
serpin peptidase inhibitor, clade F (alpha-2 antiplasmin, pigment epithelium derived factor), member 2
|
|
chr16_-_86527608
|
7.192
|
NM_001739
|
CA5A
|
carbonic anhydrase VA, mitochondrial
|
|
chr10_-_69736600
|
7.125
|
|
PBLD
|
phenazine biosynthesis-like protein domain containing
|
|
chr1_-_42402973
|
7.056
|
NM_033553
|
GUCA2A
|
guanylate cyclase activator 2A (guanylin)
|
|
chr1_-_204455269
|
7.000
|
NM_001007544
|
C1orf186
|
chromosome 1 open reading frame 186
|
|
chr19_-_53081383
|
6.802
|
NM_003167
|
SULT2A1
|
sulfotransferase family, cytosolic, 2A, dehydroepiandrosterone (DHEA)-preferring, member 1
|
|
chr19_-_44135166
|
6.769
|
NM_148169
|
FBXO17
|
F-box protein 17
|
|
chr6_+_161043214
|
6.703
|
NM_000301
NM_001168338
|
PLG
|
plasminogen
|
|
chr4_+_74488835
|
6.500
|
NM_000477
|
ALB
|
albumin
|
|
chr19_-_53081326
|
6.474
|
|
SULT2A1
|
sulfotransferase family, cytosolic, 2A, dehydroepiandrosterone (DHEA)-preferring, member 1
|
|
chr11_+_64079665
|
6.292
|
NM_018484
|
SLC22A11
|
solute carrier family 22 (organic anion/urate transporter), member 11
|
|
chr13_-_99983945
|
6.089
|
NM_033110
|
A2LD1
|
AIG2-like domain 1
|
|
chr4_+_74488910
|
5.975
|
|
ALB
|
albumin
|
|
chr7_-_47545717
|
5.961
|
NM_022748
|
TNS3
|
tensin 3
|
|
chr4_-_110942783
|
5.950
|
NM_000204
|
CFI
|
complement factor I
|
|
chr3_-_171070314
|
5.925
|
NM_024727
|
LRRC31
|
leucine rich repeat containing 31
|
|
chr18_+_27425727
|
5.831
|
NM_000371
|
TTR
|
transthyretin
|
|
chr17_+_1592893
|
5.642
|
|
SERPINF2
|
serpin peptidase inhibitor, clade F (alpha-2 antiplasmin, pigment epithelium derived factor), member 2
|
|
chr2_+_234333653
|
5.638
|
NM_000463
|
UGT1A1
|
UDP glucuronosyltransferase 1 family, polypeptide A1
|
|
chr6_+_25862905
|
5.523
|
NM_005495
|
SLC17A4
|
solute carrier family 17 (sodium phosphate), member 4
|
|
chr17_+_1586034
|
5.406
|
|
WDR81
|
WD repeat domain 81
|
|
chr4_+_74497998
|
5.383
|
|
ALB
|
albumin
|
|
chr4_+_74488947
|
5.382
|
|
ALB
|
albumin
|
|
chr4_-_977163
|
5.371
|
NM_022042
NM_134425
NM_213613
|
SLC26A1
|
solute carrier family 26 (sulfate transporter), member 1
|
|
chr6_+_31815703
|
5.218
|
NM_002441
NM_025259
NM_172165
NM_172166
|
MSH5-C6ORF26
MSH5
|
MSH5-C6orf26 read-through transcript
mutS homolog 5 (E. coli)
|
|
chr22_-_36836478
|
5.081
|
|
BAIAP2L2
|
BAI1-associated protein 2-like 2
|
|
chr15_-_96875133
|
5.080
|
NM_182562
|
FAM169B
|
family with sequence similarity 169, member B
|
|
chr6_-_25982418
|
5.010
|
NM_001098486
NM_006632
|
SLC17A3
|
solute carrier family 17 (sodium phosphate), member 3
|
|
chr4_+_187424111
|
4.985
|
NM_000128
|
F11
|
coagulation factor XI
|
|
chr6_+_54281161
|
4.890
|
NM_014464
|
TINAG
|
tubulointerstitial nephritis antigen
|
|
chr6_-_31789824
|
4.878
|
|
|
|
|
chr4_+_74498042
|
4.857
|
|
ALB
|
albumin
|
|
chr15_+_56511466
|
4.838
|
NM_000236
|
LIPC
|
lipase, hepatic
|
|
chr12_-_54965996
|
4.837
|
|
CS
|
citrate synthase
|
|
chr19_+_46201665
|
4.702
|
|
CYP2B6
|
cytochrome P450, family 2, subfamily B, polypeptide 6
|
|
chr22_-_36836620
|
4.692
|
NM_025045
|
BAIAP2L2
|
BAI1-associated protein 2-like 2
|
|
chr10_+_115302767
|
4.540
|
NM_004132
|
HABP2
|
hyaluronan binding protein 2
|
|
chr4_-_110942576
|
4.279
|
|
CFI
|
complement factor I
|
|
chr7_-_104354325
|
4.253
|
|
LOC723809
|
hypothetical LOC723809
|
|
chr20_-_43972061
|
4.218
|
|
PLTP
|
phospholipid transfer protein
|
|
chr10_-_52315390
|
4.171
|
|
A1CF
|
APOBEC1 complementation factor
|
|
chr19_-_40995606
|
4.056
|
|
PRODH2
|
proline dehydrogenase (oxidase) 2
|
|
chr4_+_69996780
|
4.048
|
NM_001074
|
UGT2B7
|
UDP glucuronosyltransferase 2 family, polypeptide B7
|
|
chr10_+_99334069
|
3.956
|
NM_001134670
NM_138413
|
HOGA1
|
4-hydroxy-2-oxoglutarate aldolase 1
|
|
chrX_+_70351773
|
3.938
|
NM_001097642
|
GJB1
|
gap junction protein, beta 1, 32kDa
|
|
chr16_-_20271530
|
3.890
|
NM_001008389
NM_003361
|
UMOD
|
uromodulin
|
|
chr2_+_87828718
|
3.855
|
NM_002665
NM_001032392
|
PLGLB2
PLGLB1
|
plasminogen-like B2
plasminogen-like B1
|
|
chr3_+_150675117
|
3.850
|
NM_004617
|
TM4SF4
|
transmembrane 4 L six family member 4
|
|
chr5_+_140509803
|
3.815
|
NM_018939
|
PCDHB6
|
protocadherin beta 6
|
|
chr20_-_17589122
|
3.780
|
|
RRBP1
|
ribosome binding protein 1 homolog 180kDa (dog)
|
|
chr10_-_52315436
|
3.766
|
NM_001198818
NM_001198819
NM_001198820
NM_014576
NM_138932
NM_138933
|
A1CF
|
APOBEC1 complementation factor
|
|
chr2_+_101981888
|
3.731
|
NM_173343
|
IL1R2
|
interleukin 1 receptor, type II
|
|
chr19_-_38052481
|
3.704
|
NM_001126335
NM_014270
|
SLC7A9
|
solute carrier family 7 (cationic amino acid transporter, y+ system), member 9
|
|
chrX_+_70351812
|
3.618
|
|
GJB1
|
gap junction protein, beta 1, 32kDa
|
|
chr2_+_234302511
|
3.583
|
NM_019093
|
UGT1A3
|
UDP glucuronosyltransferase 1 family, polypeptide A3
|
|
chr11_+_46697345
|
3.517
|
|
F2
|
coagulation factor II (thrombin)
|
|
chr11_+_64114857
|
3.433
|
NM_144585
NM_153378
|
SLC22A12
|
solute carrier family 22 (organic anion/urate transporter), member 12
|
|
chr16_+_56286212
|
3.378
|
NM_032269
|
CCDC135
|
coiled-coil domain containing 135
|
|
chr5_+_141326620
|
3.360
|
NM_183399
|
RNF14
|
ring finger protein 14
|
|
chr11_+_46697335
|
3.359
|
|
F2
|
coagulation factor II (thrombin)
|
|
chr11_+_46697312
|
3.320
|
NM_000506
|
F2
|
coagulation factor II (thrombin)
|
|
chr11_+_118561375
|
3.219
|
NM_001168468
NM_024791
|
PDZD3
|
PDZ domain containing 3
|
|
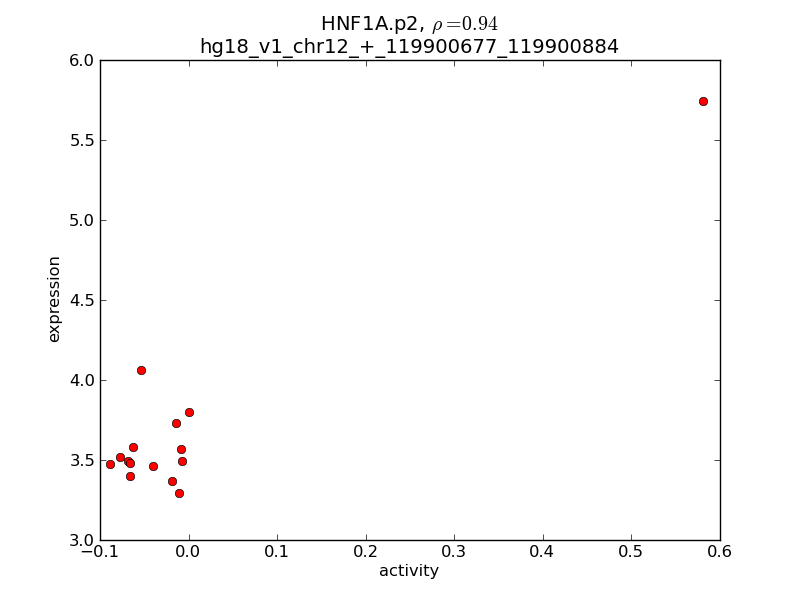
chr12_+_119900677
|
3.186
|
|
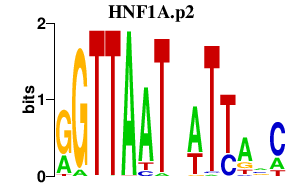
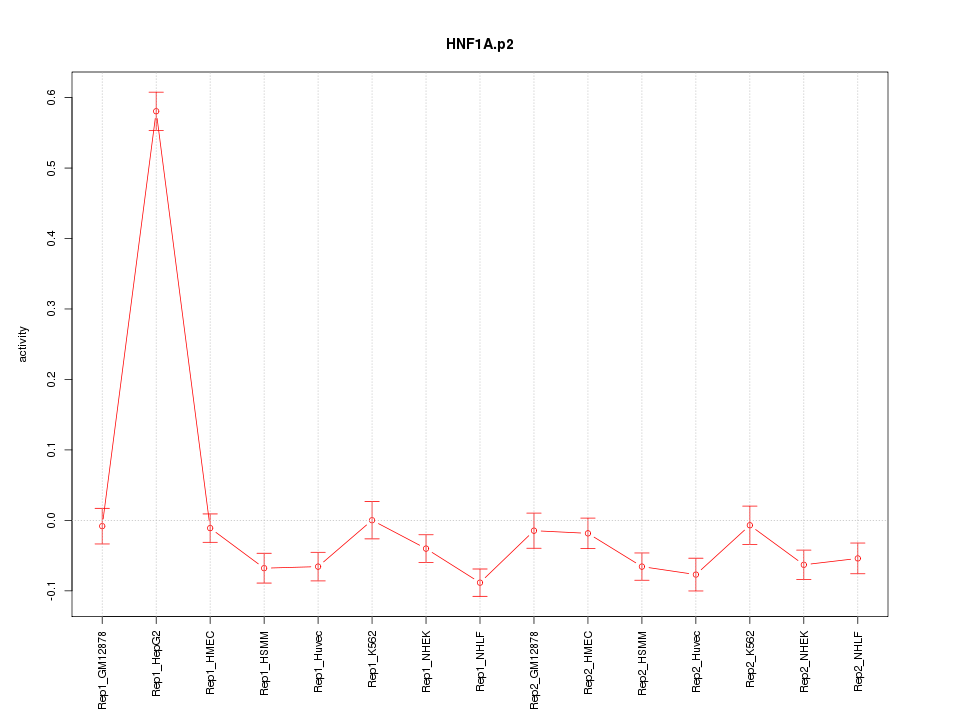
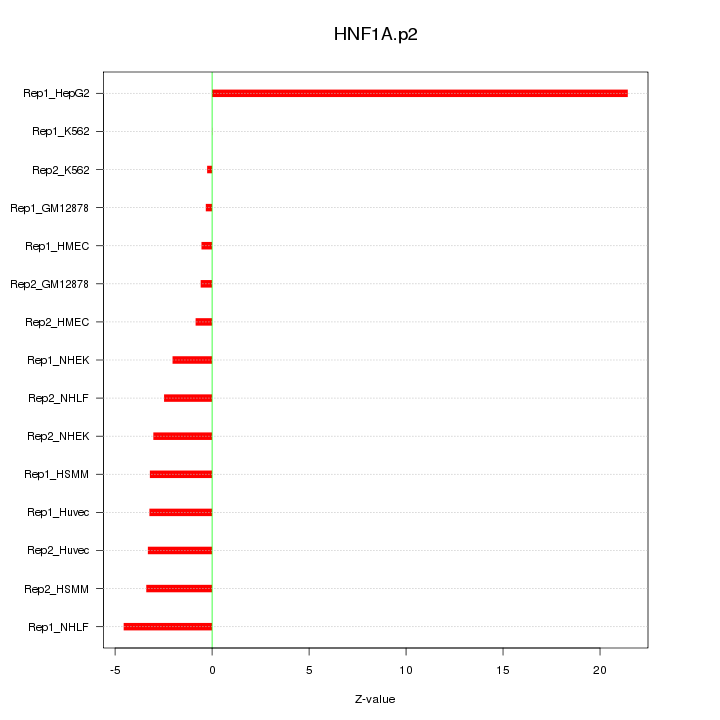
HNF1A
|
HNF1 homeobox A
|
|
chr3_+_150675169
|
3.150
|
|
TM4SF4
|
transmembrane 4 L six family member 4
|
|
chr7_+_94953148
|
3.058
|
NM_016116
NM_145872
|
ASB4
|
ankyrin repeat and SOCS box containing 4
|
|
chr1_+_42391678
|
3.057
|
NM_007102
|
GUCA2B
|
guanylate cyclase activator 2B (uroguanylin)
|
|
chr14_+_87560646
|
3.033
|
|
LOC283587
|
hypothetical protein LOC283587
|
|
chr5_-_138746840
|
2.999
|
|
SLC23A1
|
solute carrier family 23 (nucleobase transporters), member 1
|
|
chr19_-_40996040
|
2.901
|
NM_021232
|
PRODH2
|
proline dehydrogenase (oxidase) 2
|
|
chr9_+_81376666
|
2.856
|
NM_007005
|
TLE4
|
transducin-like enhancer of split 4 (E(sp1) homolog, Drosophila)
|
|
chr20_+_35406497
|
2.810
|
NM_005417
|
SRC
|
v-src sarcoma (Schmidt-Ruppin A-2) viral oncogene homolog (avian)
|
|
chr17_+_1593040
|
2.804
|
NM_001165920
|
SERPINF2
|
serpin peptidase inhibitor, clade F (alpha-2 antiplasmin, pigment epithelium derived factor), member 2
|
|
chr2_+_97696462
|
2.791
|
NM_001079
|
ZAP70
|
zeta-chain (TCR) associated protein kinase 70kDa
|
|
chr16_+_20682812
|
2.727
|
NM_005622
NM_202000
|
ACSM3
|
acyl-CoA synthetase medium-chain family member 3
|
|
chr14_+_38805251
|
2.690
|
NM_203356
|
CTAGE5
|
CTAGE family, member 5
|
|
chr1_+_205328834
|
2.661
|
NM_001017365
NM_001017366
|
C4BPB
|
complement component 4 binding protein, beta
|
|
chr9_+_80134302
|
2.628
|
|
PSAT1
|
phosphoserine aminotransferase 1
|
|
chr2_+_10103735
|
2.627
|
|
|
|
|
chr5_+_73145098
|
2.610
|
|
RGNEF
|
190 kDa guanine nucleotide exchange factor
|
|
chr1_+_198263352
|
2.590
|
NM_003822
NM_205860
|
NR5A2
|
nuclear receptor subfamily 5, group A, member 2
|
|
chr2_-_87102453
|
2.551
|
NM_002665
NM_001032392
|
PLGLB2
PLGLB1
|
plasminogen-like B2
plasminogen-like B1
|
|
chr5_-_138746917
|
2.525
|
NM_005847
NM_152685
|
SLC23A1
|
solute carrier family 23 (nucleobase transporters), member 1
|
|
chr9_-_33385265
|
2.425
|
|
AQP7
|
aquaporin 7
|
|
chr6_+_31604717
|
2.424
|
NM_001011700
|
MCCD1
|
mitochondrial coiled-coil domain 1
|
|
chr17_+_4638966
|
2.333
|
NM_001014985
|
GLTPD2
|
glycolipid transfer protein domain containing 2
|
|
chr10_+_85923473
|
2.313
|
NM_207373
|
C10orf99
|
chromosome 10 open reading frame 99
|
|
chr17_+_77910411
|
2.299
|
NM_207459
|
TEX19
|
testis expressed 19
|
|
chr4_-_70115037
|
2.275
|
NM_001073
|
UGT2B11
|
UDP glucuronosyltransferase 2 family, polypeptide B11
|
|
chr4_-_40211324
|
2.143
|
|
RBM47
|
RNA binding motif protein 47
|
|
chr7_-_36992221
|
2.105
|
NM_130442
|
ELMO1
|
engulfment and cell motility 1
|
|
chr20_+_55569542
|
2.075
|
NM_002591
|
PCK1
|
phosphoenolpyruvate carboxykinase 1 (soluble)
|
|
chr12_+_20854904
|
2.041
|
NM_019844
|
SLCO1B3
|
solute carrier organic anion transporter family, member 1B3
|
|
chr19_-_40995564
|
2.021
|
|
PRODH2
|
proline dehydrogenase (oxidase) 2
|
|
chr6_+_131936057
|
2.004
|
NM_000045
|
ARG1
|
arginase, liver
|
|
chr7_+_139175420
|
2.003
|
NM_001061
NM_001166253
NM_030984
|
TBXAS1
|
thromboxane A synthase 1 (platelet)
|
|
chr7_+_99263571
|
2.001
|
NM_022820
NM_057095
NM_057096
|
CYP3A43
|
cytochrome P450, family 3, subfamily A, polypeptide 43
|
|
chrX_-_131375217
|
2.001
|
NM_001170701
NM_001170702
NM_001170703
|
MBNL3
|
muscleblind-like 3 (Drosophila)
|
|
chr12_+_25096755
|
1.999
|
|
LRMP
|
lymphoid-restricted membrane protein
|
|
chr13_-_40491405
|
1.995
|
|
ELF1
|
E74-like factor 1 (ets domain transcription factor)
|
|
chr16_-_56393871
|
1.970
|
|
KIFC3
|
kinesin family member C3
|
|
chr1_-_151852128
|
1.963
|
NM_080388
|
S100A16
|
S100 calcium binding protein A16
|
|
chrX_+_107174855
|
1.952
|
NM_001170553
NM_182607
|
VSIG1
|
V-set and immunoglobulin domain containing 1
|
|
chr3_-_10309600
|
1.902
|
NM_001134944
NM_001134945
NM_001134946
|
GHRL
|
ghrelin/obestatin prepropeptide
|
|
chr6_-_29120930
|
1.866
|
NM_030903
|
OR2W1
|
olfactory receptor, family 2, subfamily W, member 1
|
|
chr9_-_115901157
|
1.853
|
NM_138424
|
KIF12
|
kinesin family member 12
|
|
chr11_-_118405288
|
1.843
|
NM_001164280
|
SLC37A4
|
solute carrier family 37 (glucose-6-phosphate transporter), member 4
|
|
chr13_+_52500830
|
1.832
|
NM_006418
|
OLFM4
|
olfactomedin 4
|
|
chr6_-_116488458
|
1.830
|
NM_002031
|
FRK
|
fyn-related kinase
|
|
chr20_-_4938913
|
1.827
|
NM_203327
|
SLC23A2
|
solute carrier family 23 (nucleobase transporters), member 2
|
|
chr6_-_108252200
|
1.800
|
NM_198081
|
SCML4
|
sex comb on midleg-like 4 (Drosophila)
|
|
chr8_-_6407882
|
1.767
|
NM_001118887
NM_001118888
NM_001147
|
ANGPT2
|
angiopoietin 2
|
|
chr4_-_100492854
|
1.749
|
NM_000669
|
ADH1C
|
alcohol dehydrogenase 1C (class I), gamma polypeptide
|
|
chr17_-_202557
|
1.735
|
|
RPH3AL
|
rabphilin 3A-like (without C2 domains)
|
|
chr4_-_69116839
|
1.733
|
NM_001077
|
UGT2B17
|
UDP glucuronosyltransferase 2 family, polypeptide B17
|
|
chr12_+_91620749
|
1.711
|
NM_001037671
NM_001178097
|
C12orf74
|
chromosome 12 open reading frame 74
|
|
chr2_+_108271526
|
1.670
|
NM_001056
NM_176825
|
SULT1C2
|
sulfotransferase family, cytosolic, 1C, member 2
|
|
chr20_+_31713750
|
1.645
|
NM_080825
|
C20orf144
|
chromosome 20 open reading frame 144
|
|
chr16_-_56389176
|
1.628
|
NM_001130099
|
KIFC3
|
kinesin family member C3
|
|
chr12_-_69838045
|
1.603
|
NM_004616
|
TSPAN8
|
tetraspanin 8
|
|
chrX_-_15593074
|
1.594
|
NM_020665
|
TMEM27
|
transmembrane protein 27
|
|
chr5_+_67622242
|
1.588
|
NM_181504
|
PIK3R1
|
phosphoinositide-3-kinase, regulatory subunit 1 (alpha)
|
|
chr13_-_40491491
|
1.582
|
NM_172373
|
ELF1
|
E74-like factor 1 (ets domain transcription factor)
|
|
chr2_-_6924092
|
1.572
|
|
CMPK2
|
cytidine monophosphate (UMP-CMP) kinase 2, mitochondrial
|