|
chr2_+_73973640
|
4.193
|
|
ACTG2
|
actin, gamma 2, smooth muscle, enteric
|
|
chr2_+_73973600
|
4.188
|
NM_001615
|
ACTG2
|
actin, gamma 2, smooth muscle, enteric
|
|
chr15_-_32875040
|
3.583
|
NM_005159
|
ACTC1
|
actin, alpha, cardiac muscle 1
|
|
chr20_+_34603290
|
3.580
|
NM_006097
NM_181526
|
MYL9
|
myosin, light chain 9, regulatory
|
|
chr20_+_34603311
|
3.243
|
|
MYL9
|
myosin, light chain 9, regulatory
|
|
chr5_+_137829065
|
2.975
|
|
EGR1
|
early growth response 1
|
|
chr1_-_16217025
|
2.874
|
|
HSPB7
|
heat shock 27kDa protein family, member 7 (cardiovascular)
|
|
chr3_+_189413414
|
2.757
|
NM_005578
|
LPP
|
LIM domain containing preferred translocation partner in lipoma
|
|
chr18_-_3209846
|
2.755
|
|
MYOM1
|
myomesin 1, 185kDa
|
|
chr1_-_11830328
|
2.503
|
NM_006172
|
NPPA
|
natriuretic peptide A
|
|
chr2_+_218992053
|
2.378
|
NM_007127
|
VIL1
|
villin 1
|
|
chr19_-_50517971
|
2.229
|
|
CKM
|
creatine kinase, muscle
|
|
chr3_-_46879883
|
2.070
|
NM_000258
|
MYL3
|
myosin, light chain 3, alkali; ventricular, skeletal, slow
|
|
chr15_-_63147350
|
1.980
|
NM_016563
|
RASL12
|
RAS-like, family 12
|
|
chr16_-_11282595
|
1.907
|
NM_002761
|
PRM1
|
protamine 1
|
|
chr10_-_90702490
|
1.860
|
NM_001613
|
ACTA2
|
actin, alpha 2, smooth muscle, aorta
|
|
chr5_+_137829077
|
1.749
|
NM_001964
|
EGR1
|
early growth response 1
|
|
chr17_+_30498948
|
1.633
|
NM_001033576
NM_173167
|
UNC45B
|
unc-45 homolog B (C. elegans)
|
|
chr3_-_71376919
|
1.592
|
|
FOXP1
|
forkhead box P1
|
|
chr3_+_150675117
|
1.578
|
NM_004617
|
TM4SF4
|
transmembrane 4 L six family member 4
|
|
chr16_-_66535457
|
1.516
|
NM_000229
|
LCAT
|
lecithin-cholesterol acyltransferase
|
|
chr10_+_88418147
|
1.479
|
NM_001171610
|
LDB3
|
LIM domain binding 3
|
|
chr10_+_88418243
|
1.457
|
NM_001080116
NM_001080114
NM_001080115
NM_001171611
NM_007078
|
LDB3
|
LIM domain binding 3
|
|
chr1_-_240228987
|
1.451
|
NM_001004343
|
MAP1LC3C
|
microtubule-associated protein 1 light chain 3 gamma
|
|
chr6_-_109882116
|
1.441
|
|
MICAL1
|
microtubule associated monoxygenase, calponin and LIM domain containing 1
|
|
chr11_-_16387001
|
1.402
|
NM_001145811
|
SOX6
|
SRY (sex determining region Y)-box 6
|
|
chr2_+_88148413
|
1.377
|
NM_198274
|
SMYD1
|
SET and MYND domain containing 1
|
|
chr18_-_3209986
|
1.377
|
NM_003803
NM_019856
|
MYOM1
|
myomesin 1, 185kDa
|
|
chr2_-_225086564
|
1.376
|
|
CUL3
|
cullin 3
|
|
chr3_-_124821868
|
1.285
|
|
MYLK
|
myosin light chain kinase
|
|
chr19_-_50518072
|
1.268
|
NM_001824
|
CKM
|
creatine kinase, muscle
|
|
chr3_-_187124290
|
1.229
|
|
TRA2B
|
transformer 2 beta homolog (Drosophila)
|
|
chrX_-_11194015
|
1.198
|
NM_013423
|
ARHGAP6
|
Rho GTPase activating protein 6
|
|
chr3_-_153470022
|
1.195
|
|
LOC401093
|
hypothetical LOC401093
|
|
chr2_+_42128521
|
1.175
|
NM_138370
|
PKDCC
|
protein kinase domain containing, cytoplasmic homolog (mouse)
|
|
chr19_+_50109416
|
1.153
|
|
APOC1
|
apolipoprotein C-I
|
|
chr1_-_227636462
|
1.103
|
NM_001100
|
ACTA1
|
actin, alpha 1, skeletal muscle
|
|
chr6_-_123999640
|
1.086
|
NM_006073
|
TRDN
|
triadin
|
|
chr17_+_3326045
|
1.079
|
NM_000049
|
ASPA
|
aspartoacylase
|
|
chr3_-_124822113
|
0.991
|
NM_053031
NM_053032
|
MYLK
|
myosin light chain kinase
|
|
chr15_-_63147228
|
0.983
|
|
RASL12
|
RAS-like, family 12
|
|
chr4_+_24406182
|
0.967
|
NM_003102
|
SOD3
|
superoxide dismutase 3, extracellular
|
|
chr1_-_31618405
|
0.959
|
NM_004102
|
FABP3
|
fatty acid binding protein 3, muscle and heart (mammary-derived growth inhibitor)
|
|
chr2_+_100545827
|
0.957
|
NM_024065
|
PDCL3
|
phosducin-like 3
|
|
chr10_+_112247614
|
0.900
|
NM_004419
|
DUSP5
|
dual specificity phosphatase 5
|
|
chr19_+_2427122
|
0.876
|
NM_015675
|
GADD45B
|
growth arrest and DNA-damage-inducible, beta
|
|
chr19_+_59064795
|
0.874
|
|
MYADM
|
myeloid-associated differentiation marker
|
|
chr12_-_23995220
|
0.852
|
|
SOX5
|
SRY (sex determining region Y)-box 5
|
|
chr3_+_150675169
|
0.833
|
|
TM4SF4
|
transmembrane 4 L six family member 4
|
|
chr17_+_38256710
|
0.824
|
NM_003734
|
AOC3
|
amine oxidase, copper containing 3 (vascular adhesion protein 1)
|
|
chr14_-_93512818
|
0.823
|
|
ASB2
|
ankyrin repeat and SOCS box containing 2
|
|
chr4_+_14985272
|
0.784
|
NM_001135171
|
C1QTNF7
|
C1q and tumor necrosis factor related protein 7
|
|
chr6_+_151602787
|
0.738
|
NM_005100
|
AKAP12
|
A kinase (PRKA) anchor protein 12
|
|
chr1_+_15957832
|
0.728
|
NM_017556
|
FBLIM1
|
filamin binding LIM protein 1
|
|
chr1_-_20178680
|
0.717
|
NM_001161729
|
PLA2G2A
|
phospholipase A2, group IIA (platelets, synovial fluid)
|
|
chr17_+_29707583
|
0.709
|
NM_005408
|
CCL13
|
chemokine (C-C motif) ligand 13
|
|
chr10_+_123912930
|
0.698
|
|
TACC2
|
transforming, acidic coiled-coil containing protein 2
|
|
chr20_-_33783409
|
0.698
|
|
RBM39
|
RNA binding motif protein 39
|
|
chr2_-_105381855
|
0.697
|
NM_001039492
NM_001450
NM_201555
|
FHL2
|
four and a half LIM domains 2
|
|
chr20_-_33706532
|
0.696
|
|
RBM12
|
RNA binding motif protein 12
|
|
chr1_-_152431175
|
0.691
|
NM_152263
|
TPM3
|
tropomyosin 3
|
|
chr1_+_165865953
|
0.681
|
NM_052862
|
RCSD1
|
RCSD domain containing 1
|
|
chr6_+_144654565
|
0.669
|
NM_007124
|
UTRN
|
utrophin
|
|
chr2_-_105421661
|
0.661
|
NM_201557
|
FHL2
|
four and a half LIM domains 2
|
|
chr6_-_29635680
|
0.650
|
NM_006398
|
UBD
|
ubiquitin D
|
|
chr6_+_158322875
|
0.637
|
NM_003898
|
SYNJ2
|
synaptojanin 2
|
|
chr14_-_93512647
|
0.635
|
|
ASB2
|
ankyrin repeat and SOCS box containing 2
|
|
chr11_+_62189354
|
0.622
|
NM_001043229
|
METTL12
|
methyltransferase like 12
|
|
chr1_+_165866127
|
0.600
|
|
RCSD1
|
RCSD domain containing 1
|
|
chr11_+_116575249
|
0.585
|
NM_001001522
NM_003186
|
TAGLN
|
transgelin
|
|
chr8_-_22606653
|
0.578
|
NM_004430
|
EGR3
|
early growth response 3
|
|
chr19_+_50663089
|
0.570
|
NM_001114171
NM_006732
|
FOSB
|
FBJ murine osteosarcoma viral oncogene homolog B
|
|
chr6_+_44322764
|
0.555
|
NM_007355
|
HSP90AB1
|
heat shock protein 90kDa alpha (cytosolic), class B member 1
|
|
chr2_+_46560207
|
0.553
|
NM_001145051
|
LOC388946
|
transmembrane protein ENSP00000343375
|
|
chr20_-_33198721
|
0.548
|
NM_001145025
NM_018217
|
EDEM2
|
ER degradation enhancer, mannosidase alpha-like 2
|
|
chr11_-_57038891
|
0.540
|
NM_001198810
|
SLC43A1
|
solute carrier family 43, member 1
|
|
chr12_-_23995109
|
0.537
|
|
SOX5
|
SRY (sex determining region Y)-box 5
|
|
chr12_+_50731457
|
0.536
|
NM_002135
NM_173157
|
NR4A1
|
nuclear receptor subfamily 4, group A, member 1
|
|
chr17_-_69869552
|
0.533
|
NM_001080466
|
BTBD17
|
BTB (POZ) domain containing 17
|
|
chr2_-_73373956
|
0.531
|
NM_001965
|
EGR4
|
early growth response 4
|
|
chr17_-_38385511
|
0.525
|
NM_025267
|
AARSD1
|
alanyl-tRNA synthetase domain containing 1
|
|
chr11_+_59564323
|
0.503
|
NM_173801
|
PLAC1L
|
placenta-specific 1-like
|
|
chr6_-_16869579
|
0.501
|
NM_000332
NM_001128164
|
ATXN1
|
ataxin 1
|
|
chr18_-_42804291
|
0.496
|
NM_001100817
|
TCEB3C
TCEB3CL
|
transcription elongation factor B polypeptide 3C (elongin A3)
transcription elongation factor B polypeptide 3C-like
|
|
chr17_+_29636799
|
0.472
|
NM_002986
|
CCL11
|
chemokine (C-C motif) ligand 11
|
|
chr16_+_30015899
|
0.468
|
|
|
|
|
chr11_-_75599433
|
0.467
|
|
WNT11
|
wingless-type MMTV integration site family, member 11
|
|
chr10_+_114033403
|
0.459
|
NM_058222
|
TECTB
|
tectorin beta
|
|
chr2_-_21120420
|
0.449
|
NM_000384
|
APOB
|
apolipoprotein B (including Ag(x) antigen)
|
|
chr20_-_61728866
|
0.446
|
|
GMEB2
|
glucocorticoid modulatory element binding protein 2
|
|
chr17_+_16259636
|
0.442
|
|
TRPV2
|
transient receptor potential cation channel, subfamily V, member 2
|
|
chr11_-_2118743
|
0.441
|
|
IGF2
|
insulin-like growth factor 2 (somatomedin A)
|
|
chr3_-_158704056
|
0.440
|
NM_001167915
NM_001167916
|
VEPH1
|
ventricular zone expressed PH domain homolog 1 (zebrafish)
|
|
chr18_-_42804531
|
0.425
|
NM_145653
|
TCEB3C
|
transcription elongation factor B polypeptide 3C (elongin A3)
|
|
chr6_-_29635456
|
0.424
|
|
UBD
|
ubiquitin D
|
|
chr11_+_66070949
|
0.410
|
NM_001104
|
ACTN3
|
actinin, alpha 3
|
|
chr7_-_107430566
|
0.406
|
NM_002291
|
LAMB1
|
laminin, beta 1
|
|
chr5_-_178983241
|
0.401
|
|
HNRNPH1
|
heterogeneous nuclear ribonucleoprotein H1 (H)
|
|
chr19_-_40939756
|
0.399
|
NM_144617
|
HSPB6
|
heat shock protein, alpha-crystallin-related, B6
|
|
chr6_-_25834733
|
0.398
|
NM_170745
|
HIST1H2AA
|
histone cluster 1, H2aa
|
|
chr16_+_31105579
|
0.390
|
|
|
|
|
chr17_+_16259573
|
0.388
|
NM_016113
|
TRPV2
|
transient receptor potential cation channel, subfamily V, member 2
|
|
chr5_+_60663842
|
0.388
|
NM_020928
|
ZSWIM6
|
zinc finger, SWIM-type containing 6
|
|
chr7_+_111908143
|
0.385
|
NM_001134468
NM_182597
|
C7orf53
|
chromosome 7 open reading frame 53
|
|
chr19_-_52666886
|
0.383
|
|
SLC8A2
|
solute carrier family 8 (sodium/calcium exchanger), member 2
|
|
chr11_-_65424385
|
0.377
|
|
FOSL1
|
FOS-like antigen 1
|
|
chr12_+_48784057
|
0.376
|
NM_005276
|
GPD1
|
glycerol-3-phosphate dehydrogenase 1 (soluble)
|
|
chr20_-_21442663
|
0.375
|
NM_002509
|
NKX2-2
|
NK2 homeobox 2
|
|
chr17_-_36456949
|
0.366
|
NM_001123387
|
KRTAP2-1
|
keratin associated protein 2-1
|
|
chr14_-_54438913
|
0.358
|
NM_000161
NM_001024024
NM_001024070
NM_001024071
|
GCH1
|
GTP cyclohydrolase 1
|
|
chr12_-_90029672
|
0.357
|
NM_002345
|
LUM
|
lumican
|
|
chr19_+_59064471
|
0.357
|
NM_001020821
NM_001020818
|
MYADM
|
myeloid-associated differentiation marker
|
|
chr11_+_65945050
|
0.353
|
NM_178864
|
NPAS4
|
neuronal PAS domain protein 4
|
|
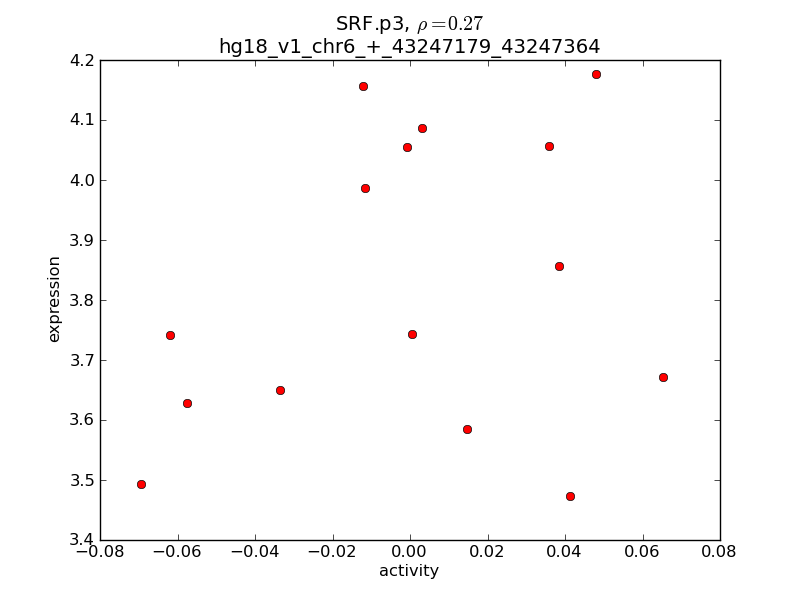
chr6_+_43247179
|
0.352
|
|
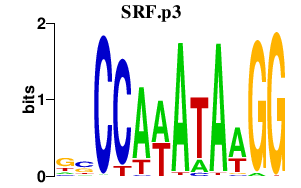
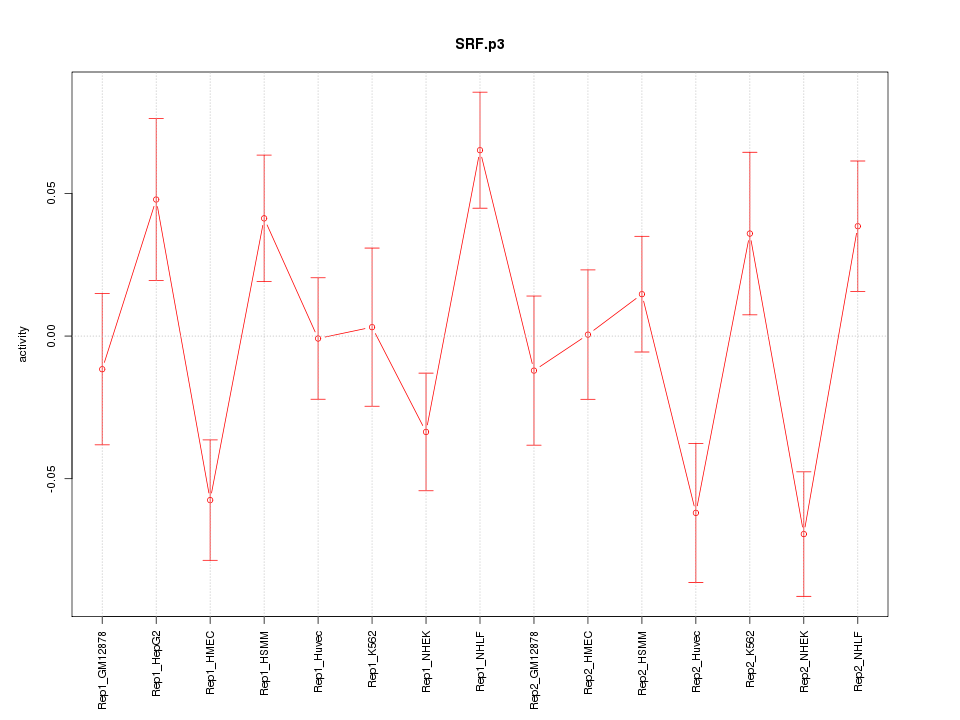
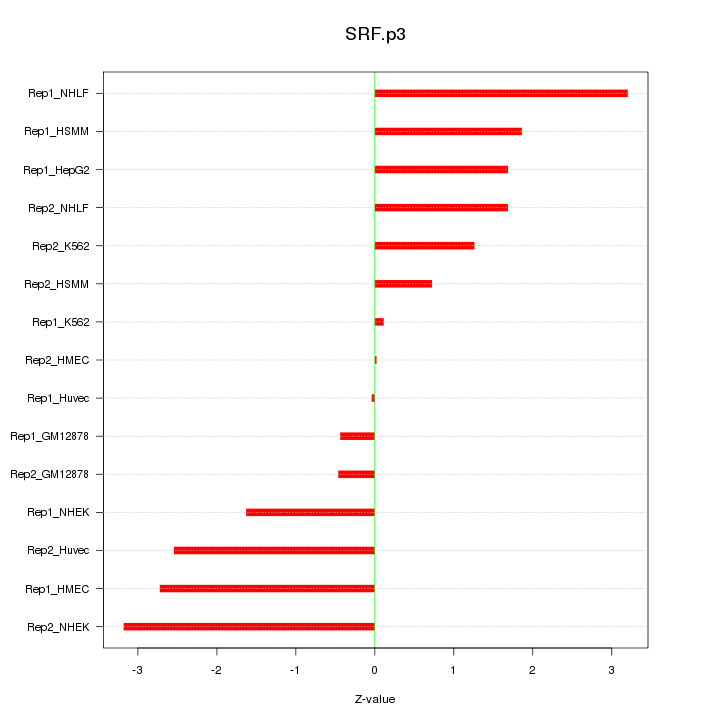
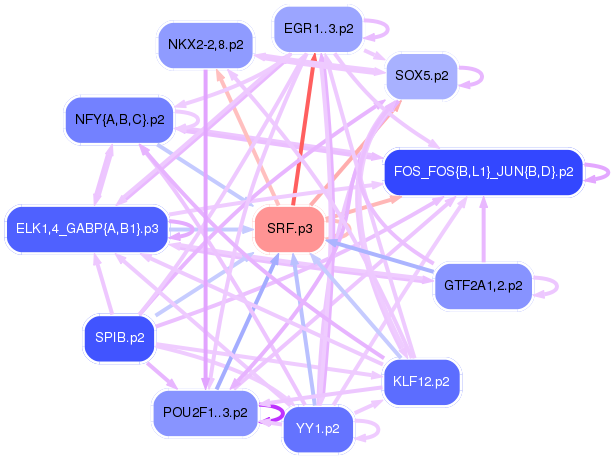
SRF
|
serum response factor (c-fos serum response element-binding transcription factor)
|
|
chr10_+_80777234
|
0.349
|
|
PPIF
|
peptidylprolyl isomerase F
|
|
chr6_+_158322904
|
0.344
|
|
SYNJ2
|
synaptojanin 2
|
|
chr5_+_88220846
|
0.332
|
|
|
|
|
chr17_-_34603577
|
0.326
|
|
CACNB1
|
calcium channel, voltage-dependent, beta 1 subunit
|
|
chr18_-_42810446
|
0.324
|
NM_145653
|
TCEB3C
|
transcription elongation factor B polypeptide 3C (elongin A3)
|
|
chr2_-_128149112
|
0.323
|
NM_001136037
NM_001161403
|
LIMS2
|
LIM and senescent cell antigen-like domains 2
|
|
chr7_-_5536783
|
0.315
|
|
ACTB
|
actin, beta
|
|
chr11_+_46339691
|
0.314
|
NM_001105540
|
DGKZ
|
diacylglycerol kinase, zeta
|
|
chr6_+_44322831
|
0.312
|
|
HSP90AB1
|
heat shock protein 90kDa alpha (cytosolic), class B member 1
|
|
chr10_+_80777199
|
0.309
|
NM_005729
|
PPIF
|
peptidylprolyl isomerase F
|
|
chr17_-_77094426
|
0.308
|
|
ACTG1
|
actin, gamma 1
|
|
chr17_-_77094375
|
0.299
|
NM_001614
|
ACTG1
|
actin, gamma 1
|
|
chr22_+_24468110
|
0.292
|
NM_032608
|
MYO18B
|
myosin XVIIIB
|
|
chr17_+_16259812
|
0.290
|
|
TRPV2
|
transient receptor potential cation channel, subfamily V, member 2
|
|
chr17_-_77386156
|
0.288
|
|
DYSFIP1
|
dysferlin interacting protein 1
|
|
chr14_+_74815233
|
0.288
|
NM_005252
|
FOS
|
FBJ murine osteosarcoma viral oncogene homolog
|
|
chr15_-_53369261
|
0.286
|
NM_183235
|
RAB27A
|
RAB27A, member RAS oncogene family
|
|
chr5_+_6799100
|
0.284
|
NM_001171806
|
PAPD7
|
PAP associated domain containing 7
|
|
chr4_-_88669625
|
0.282
|
NM_001128310
NM_004684
|
SPARCL1
|
SPARC-like 1 (hevin)
|
|
chr6_+_43246897
|
0.282
|
NM_003131
|
SRF
|
serum response factor (c-fos serum response element-binding transcription factor)
|
|
chr17_-_23721351
|
0.280
|
|
VTN
|
vitronectin
|
|
chr17_-_23721420
|
0.275
|
|
VTN
|
vitronectin
|
|
chr20_+_4650499
|
0.271
|
NM_012409
|
PRND
|
prion protein 2 (dublet)
|
|
chr11_-_65424434
|
0.263
|
|
FOSL1
|
FOS-like antigen 1
|
|
chr6_+_43247168
|
0.256
|
|
SRF
|
serum response factor (c-fos serum response element-binding transcription factor)
|
|
chr2_+_107969410
|
0.252
|
NM_021815
|
SLC5A7
|
solute carrier family 5 (choline transporter), member 7
|
|
chr10_+_6226909
|
0.250
|
|
PFKFB3
|
6-phosphofructo-2-kinase/fructose-2,6-biphosphatase 3
|
|
chr20_+_60558104
|
0.250
|
NM_178463
|
C20orf166
|
chromosome 20 open reading frame 166
|
|
chr14_+_104338423
|
0.248
|
|
ZBTB42
|
zinc finger and BTB domain containing 42
|
|
chr12_-_55730125
|
0.247
|
NM_005379
|
MYO1A
|
myosin IA
|
|
chr3_-_158695832
|
0.243
|
NM_001167917
|
VEPH1
|
ventricular zone expressed PH domain homolog 1 (zebrafish)
|
|
chr17_-_46296376
|
0.243
|
NM_005749
|
TOB1
|
transducer of ERBB2, 1
|
|
chr2_+_55312542
|
0.240
|
NM_001135592
|
RPS27A
|
ribosomal protein S27a
|
|
chr1_-_120737466
|
0.240
|
NM_001004340
NM_001017986
|
FCGR1A
FCGR1B
|
Fc fragment of IgG, high affinity Ia, receptor (CD64)
Fc fragment of IgG, high affinity Ib, receptor (CD64)
|
|
chr17_-_77386212
|
0.235
|
NM_001007533
|
DYSFIP1
|
dysferlin interacting protein 1
|
|
chr9_+_96561750
|
0.234
|
NM_001193329
|
C9orf3
|
chromosome 9 open reading frame 3
|
|
chr1_+_11917330
|
0.233
|
NM_000302
|
PLOD1
|
procollagen-lysine 1, 2-oxoglutarate 5-dioxygenase 1
|
|
chr22_+_28206180
|
0.225
|
NM_021076
|
NEFH
|
neurofilament, heavy polypeptide
|
|
chr2_-_21120398
|
0.224
|
|
APOB
|
apolipoprotein B (including Ag(x) antigen)
|
|
chr7_+_143378393
|
0.221
|
NM_012365
|
OR2A5
|
olfactory receptor, family 2, subfamily A, member 5
|
|
chr7_+_113842284
|
0.215
|
NM_001172766
NM_014491
NM_148898
NM_148900
|
FOXP2
|
forkhead box P2
|
|
chr16_+_55523526
|
0.211
|
|
HERPUD1
|
homocysteine-inducible, endoplasmic reticulum stress-inducible, ubiquitin-like domain member 1
|
|
chr20_-_604443
|
0.210
|
|
|
|
|
chr18_-_42798364
|
0.209
|
NM_001100817
|
TCEB3C
TCEB3CL
|
transcription elongation factor B polypeptide 3C (elongin A3)
transcription elongation factor B polypeptide 3C-like
|
|
chr7_-_75280962
|
0.207
|
NM_002991
|
CCL24
|
chemokine (C-C motif) ligand 24
|
|
chr19_+_39402167
|
0.204
|
|
LSM14A
|
LSM14A, SCD6 homolog A (S. cerevisiae)
|
|
chr6_-_88468667
|
0.204
|
|
AKIRIN2
|
akirin 2
|
|
chr5_+_176955595
|
0.202
|
|
|
|
|
chr16_+_22011362
|
0.199
|
NM_173615
|
VWA3A
|
von Willebrand factor A domain containing 3A
|
|
chr18_+_9698299
|
0.197
|
|
RAB31
|
RAB31, member RAS oncogene family
|
|
chr6_+_151603201
|
0.195
|
|
AKAP12
|
A kinase (PRKA) anchor protein 12
|
|
chr19_-_50975603
|
0.195
|
NM_001081563
|
DMPK
|
dystrophia myotonica-protein kinase
|
|
chr17_-_36181927
|
0.192
|
NM_181539
|
KRT26
|
keratin 26
|
|
chr20_-_61728774
|
0.189
|
NM_012384
|
GMEB2
|
glucocorticoid modulatory element binding protein 2
|
|
chr20_-_18425811
|
0.187
|
NM_006606
|
RBBP9
|
retinoblastoma binding protein 9
|
|
chr4_+_156899575
|
0.185
|
NM_000857
|
GUCY1B3
|
guanylate cyclase 1, soluble, beta 3
|
|
chr4_-_88669267
|
0.185
|
|
SPARCL1
|
SPARC-like 1 (hevin)
|
|
chr2_+_138975819
|
0.184
|
NM_001001664
|
SPOPL
|
speckle-type POZ protein-like
|
|
chr10_+_6226884
|
0.182
|
|
PFKFB3
|
6-phosphofructo-2-kinase/fructose-2,6-biphosphatase 3
|
|
chr7_-_121731721
|
0.180
|
NM_001024613
NM_001160264
|
FEZF1
|
FEZ family zinc finger 1
|
|
chr15_+_38462213
|
0.178
|
NM_001142761
NM_001142762
NM_033286
|
C15orf23
|
chromosome 15 open reading frame 23
|
|
chr22_+_24468168
|
0.176
|
|
MYO18B
|
myosin XVIIIB
|
|
chr20_-_62151216
|
0.173
|
NM_018419
|
SOX18
|
SRY (sex determining region Y)-box 18
|
|
chr7_+_113842470
|
0.171
|
|
FOXP2
|
forkhead box P2
|
|
chr16_-_67943157
|
0.171
|
NM_144676
|
TMED6
|
transmembrane emp24 protein transport domain containing 6
|
|
chr6_-_88468591
|
0.169
|
|
AKIRIN2
|
akirin 2
|
|
chr17_-_36938111
|
0.169
|
NM_002276
|
KRT19
|
keratin 19
|
|
chr1_-_120737416
|
0.168
|
|
FCGR1B
|
Fc fragment of IgG, high affinity Ib, receptor (CD64)
|
|
chr19_+_3536541
|
0.167
|
NM_133261
|
GIPC3
|
GIPC PDZ domain containing family, member 3
|
|
chr11_-_19180092
|
0.167
|
NM_001127656
NM_003476
|
CSRP3
|
cysteine and glycine-rich protein 3 (cardiac LIM protein)
|
|
chr1_-_148080888
|
0.166
|
NM_001040874
NM_003516
|
HIST2H2AA4
HIST2H2AA3
|
histone cluster 2, H2aa4
histone cluster 2, H2aa3
|
|
chr15_+_38430517
|
0.165
|
NM_001145643
|
PHGR1
|
proline/histidine/glycine-rich 1
|
|
chr15_-_68177280
|
0.163
|
|
TLE3
|
transducin-like enhancer of split 3 (E(sp1) homolog, Drosophila)
|
|
chr2_+_138975946
|
0.160
|
|
|
|
|
chr1_-_166373434
|
0.159
|
|
GPR161
|
G protein-coupled receptor 161
|
|
chr1_-_925215
|
0.157
|
|
HES4
|
hairy and enhancer of split 4 (Drosophila)
|
|
chr2_-_151052391
|
0.157
|
NM_005168
|
RND3
|
Rho family GTPase 3
|
|
chr6_+_158322916
|
0.156
|
|
SYNJ2
|
synaptojanin 2
|
|
chr15_-_99847395
|
0.155
|
|
PCSK6
|
proprotein convertase subtilisin/kexin type 6
|
|
chr11_+_43920385
|
0.154
|
NM_001145033
|
C11orf96
|
chromosome 11 open reading frame 96
|
|
chr16_+_29984611
|
0.154
|
|
ALDOA
|
aldolase A, fructose-bisphosphate
|
|
chr10_+_6226764
|
0.154
|
NM_001145443
|
PFKFB3
|
6-phosphofructo-2-kinase/fructose-2,6-biphosphatase 3
|
|
chrX_-_152592450
|
0.154
|
|
PNCK
|
pregnancy up-regulated non-ubiquitously expressed CaM kinase
|
|
chr15_+_79276273
|
0.150
|
NM_001172128
|
IL16
|
interleukin 16 (lymphocyte chemoattractant factor)
|
|
chr21_+_34112456
|
0.147
|
|
ITSN1
|
intersectin 1 (SH3 domain protein)
|
|
chr11_-_47330797
|
0.145
|
NM_000256
|
MYBPC3
|
myosin binding protein C, cardiac
|